Last close As at 05/08/2026
GBP8.17
▲ 7.00 (0.86%)
Market capitalisation
GBP819m
Research: Investment Companies
Finsbury Growth & Income Trust
Finsbury Growth & Income Trust |
Highly concentrated portfolio, strong performance |
Investment trusts |
26 October 2016 |
Share price/discount performance
Three-year performance vs index
Gearing
Analysts
|
|||||||||||||||||||||||||||||||||||||||||||||||||||||||||||||||||||||||||||||||||||||
Finsbury Growth & Income Trust (FGT) aims to generate long-term growth in capital and income from a concentrated portfolio of primarily UK equities, which are held for the long term. FGT is benchmarked against the FTSE All-Share index, but is not constrained by its composition; c 70% of the portfolio is invested in consumer stocks. The trust has a progressive dividend policy and annual dividends have compounded by 7.3% pa since FY11; the current dividend yield is 2.0%. FGT has outperformed its peers and the benchmark over one, three, five and 10 years. Strong investor demand along with capital appreciation means the size of the trust has grown significantly; assets under management now approach £1bn.
12 months ending |
Share price |
NAV |
FTSE All-Share |
FTSE 350 |
MSCI World |
30/09/12 |
23.6 |
21.2 |
17.2 |
17.2 |
18.0 |
30/09/13 |
30.5 |
31.9 |
18.9 |
18.6 |
20.6 |
30/09/14 |
8.6 |
9.0 |
6.1 |
6.1 |
12.7 |
30/09/15 |
11.8 |
12.2 |
(2.3) |
(2.6) |
2.1 |
30/09/16 |
20.8 |
20.6 |
16.8 |
16.9 |
30.6 |
Source: Thomson Datastream. Note: All % on a total return basis in GBP.
Investment strategy: Buy and hold
Manager Nick Train focuses on good-quality businesses, aiming to “buy great companies and hold them forever”; they typically have low capital intensity and relatively high cash flow. The three broad themes within the FGT portfolio are global consumer brands, owners of media/software intellectual property and capital market proxies. Average turnover of c 5% pa is very low – the last position added to the portfolio was spirit and wine producer Rémy Cointreau in 2015, the first new holding since 2011, while the recent sale of Thomson Reuters was the first disposal since 2013. Up to 10% of the portfolio may be held in cash; however, the manager prefers to remain fully invested.
Market outlook: Room for profitability to increase
UK equities have rallied following the UK’s EU referendum, as weakness in sterling translates into higher earnings for companies generating profits overseas. As a result, market valuation based on a forward P/E multiple is towards the high end of the 10-year range. However, this is based on earnings that are arguably depressed. The return on equity is significantly below the average of the last 10 years, suggesting potential for increased profitability over time. For investors wanting exposure to UK equities, a concentrated fund with a focus on cash-generative companies and positive long-term performance track record may be of interest.
Valuation: Shares trading close to NAV
FGT’s current 0.8% share price premium to cum-income net asset value is broadly in line with the averages of the last one, three, five and 10 years. It is active in managing investor demand, between end H116 (31 March) and end-September 2016 a further 12.8m shares were issued, representing an additional 9.9% in share capital. Although FGT is in the AIC UK Equity Income sector, it has a mandate for capital and income growth; its current dividend yield is 2.0%.
Exhibit 1: Trust at a glance
Investment objective and fund background |
Recent developments |
||||||||||||||||||||||||||||||||||||||||||||||||||||||||||||||||||||||
FGT’s investment objective is to achieve capital and income growth and provide shareholders with a total return above that of the FTSE All-Share Index. It invests principally in the securities of UK-quoted companies, but up to a maximum of 20% at the time of acquisition can be invested in non-UK-quoted companies. FTSE 100 companies normally represent 50-100% of the portfolio, with at least 70% usually invested in FTSE 350 companies. |
■ 11 October 2016: Amendment to fee structure (see page 7) ■ 4 October 2016: Announcement of second interim dividend of 7.0p. ■ 14 July 2016: Block listing interim review for 6 January to 13 July 2016 – 10.34m unallotted shares. ■ 7 July 2016: Block listing application for 10m new shares to be issued according to market demand. ■ 5 May 2016: Six-month results to 31 march 2016. NAV TR 10.0% versus benchmark TR 3.5%. Share price TR 9.9%. |
||||||||||||||||||||||||||||||||||||||||||||||||||||||||||||||||||||||
Forthcoming |
Capital structure |
Fund details |
|||||||||||||||||||||||||||||||||||||||||||||||||||||||||||||||||||||
AGM |
February 2017 |
Ongoing charges |
0.8% |
Group |
Frostrow Capital |
||||||||||||||||||||||||||||||||||||||||||||||||||||||||||||||||||
Final results |
December 2016 |
Net gearing |
2% |
Manager |
Lindsell Train |
||||||||||||||||||||||||||||||||||||||||||||||||||||||||||||||||||
Year end |
30 September |
Annual mgmt fee |
Recent change (see page 7) |
Address |
25 Southampton Buildings, London, WC2A 1AL |
||||||||||||||||||||||||||||||||||||||||||||||||||||||||||||||||||
Dividend paid |
May, November |
Performance fee |
None |
||||||||||||||||||||||||||||||||||||||||||||||||||||||||||||||||||||
Launch date |
January 1926 |
Trust life |
Indefinite |
Phone |
+44 (0)20 3008 4910 |
||||||||||||||||||||||||||||||||||||||||||||||||||||||||||||||||||
Continuation vote |
None |
Loan facilities |
£50m |
Website |
|||||||||||||||||||||||||||||||||||||||||||||||||||||||||||||||||||
Dividend policy and history |
Share buyback policy and history |
||||||||||||||||||||||||||||||||||||||||||||||||||||||||||||||||||||||
Two dividends paid annually in May and November. The dividend is expected to rise over the longer term. |
Renewed annually, the trust has authority to purchase up to 14.99% and allot up to 10% of issued share capital. Financial years shown. |
||||||||||||||||||||||||||||||||||||||||||||||||||||||||||||||||||||||
|
|
||||||||||||||||||||||||||||||||||||||||||||||||||||||||||||||||||||||
Shareholder base (as at 30 September 2016) |
Portfolio exposure by geography (as at 30 September 2016) |
||||||||||||||||||||||||||||||||||||||||||||||||||||||||||||||||||||||
|
|
||||||||||||||||||||||||||||||||||||||||||||||||||||||||||||||||||||||
Top 10 holdings (as at 30 September 2016) |
|||||||||||||||||||||||||||||||||||||||||||||||||||||||||||||||||||||||
|
|||||||||||||||||||||||||||||||||||||||||||||||||||||||||||||||||||||||
Source: Finsbury Growth & Income Trust, Edison Investment Research, Bloomberg, Morningstar. Note: *N/A where not in September 2015 top 10. **Formerly Reed Elsevier.
Market outlook: Potential for higher earnings
Exhibit 2 (left-hand side) shows the performance of the FTSE All-Share and MSCI World indices over the last 10 years. UK equities have lagged global equities in recent years; factors include a higher percentage of resource stocks, which have been negatively affected by lower commodity prices, and the relatively strong performance of the US market. However, both global and UK stocks have rallied in the near term as commodity prices have risen, and sterling weakness following the Brexit vote is having a positive impact on the translation of earnings of UK companies where the bulk of their income is generated overseas.
Valuation of UK stocks illustrated by the Datastream UK index (Exhibit 2 right-hand side) is looking stretched on some measures. The 12-months forward P/E multiple is towards the top end of the range and 25% above the 10-year average. However, this is arguably on depressed earnings. The return on equity is significantly below the 10-year average, which suggests potential for companies to increase profitability over time. For investors wishing to maintain exposure to UK equities, a concentrated fund investing in high-quality companies for the long term may hold appeal.
|
Exhibit 2: Market performance and UK valuation metrics |
|||||||||||||||||||||||||||||||
FTSE All-Share and MSCI World indices over 10 years |
Datastream UK index valuation metrics (as at 25 October 2016) |
||||||||||||||||||||||||||||||
|
|
||||||||||||||||||||||||||||||
|
Source: Thomson Datastream, Edison Investment Research |
|||||||||||||||||||||||||||||||
Fund profile: Long-established, concentrated fund
FGT was incorporated in 1926 as Scottish Cities Investment Trust with assets of £100,000, which increased to £1m by 1958. In 2000 (with assets of £64m), the trust changed its name to Finsbury Growth Trust and Lindsell Train was appointed as investment manager. In 2004, its name was changed to Finsbury Growth & Income Trust, to better reflect a total return mandate. Due to strong investor demand and capital appreciation, the size of the trust has grown significantly; assets under management are now approaching £1bn.
Managed by Nick Train (a founding partner of Lindsell Train) since 2000, FGT aims to achieve long-term growth in capital and income by investing in a portfolio of primarily UK-listed companies, although up to 20% of the portfolio at the time of purchase may be invested in companies listed outside of the UK. FGT’s performance is benchmarked against the FTSE All-Share index. Positions are typically more than 1% of the portfolio unless in the process of being built or disposed of, and the portfolio generally comprises c 30 holdings. Normally, between 50% and 100% of the portfolio is invested in FTSE 100 companies and comparable companies on overseas stock exchanges, and at least 70% will be invested in FTSE 350 or similarly sized overseas companies. Up to 25% of gross assets may be held in preference shares, bonds and other debt instruments and although the manager prefers to be fully invested, up to 10% of the portfolio may be held in cash.
The fund manager: Nick Train
The manager’s view: Remains bullish on global equities
Considering the current macro environment, the manager notes that at end-July 2016, for the first time in history (including during the dotcom bubble), the top five global companies by market cap were all US technology businesses. He considers this symbolic, as it confirms the accelerating pace of value creation by digital companies, while also accelerating the pace of value destruction from digital technology as some traditional sources of profit are under threat. This is evident in companies such as Daily Mail and General Trust, where the newspaper business is in decline, but its digital operations such as MailOnline and Zoopla are performing well.
M&A activity remains robust, although the 2016 run-rate is lower than the levels achieved in 2015, which was a record for global M&A. Last year deals totalled $5.6tn, up 27% year-on-year and 16% above the previous peak in 2007; they were struck at an average premium of 24% (source: Bloomberg). FGT has a holding in London Stock Exchange Group, which is in the process of merging with Deutsche Börse. The manager considers that the company is attractive with or without the deal, and has been adding to his holding.
Train comments that despite views to the contrary, the level of volatility in stock markets is not out of the ordinary. Looking at the VIX index (a measure of volatility in the US stock market) since 1950, the annual volatility is c 15% per year. However, it is currently running at c 13%, which is lower than the long-term average. He suggests that equities are naturally volatile and investors are always looking for something to worry about. The UK equity market has been in positive territory for 73% of years since 1900 so, while there is no certainty that equities will appreciate in each year, over the long term the balance of probability suggests that equities are a good investment. The manager has used recent volatility in the stock market to add to portfolio positions that he believes have been unfairly penalised, such as Burberry, Daily Mail and General Trust and Diageo. He has also recently added to his personal holding in FGT, further aligning his interest with those of the trust’s other shareholders.
Regarding investor concerns about Brexit and its potential impact on the UK economy, the manager comments that people misunderstand the relationship between the economy and the stock market. There is some overlap, but the bulk of earnings of FTSE 100 companies are generated overseas, so when sterling weakens, the value of global earnings is increased. The manager remains fully invested and although he does not try to predict the level of the stock market, he comments that while the FTSE 100 index has recently touched an all-time high, it is barely higher than 16 years ago. This is a long time for a major stock market to move sideways, so he believes that UK equities can continue to appreciate.
Asset allocation
Investment process: Long-term investment in global brands
FGT’s investments are selected on a bottom-up basis without regard to the stock and sector weightings of the benchmark. The manager aims to “buy great companies and hold them forever”; he suggests that good businesses are rare and deserve higher valuations than most people give them credit for. There are three broad themes within the portfolio: global consumer brands, owners of media/software intellectual property, and capital market proxies. The manager has maintained this stance and high portfolio weightings in these areas for many years. Companies fitting into these themes have relatively low capital intensity and corresponding relatively high cash generation. Stocks are purchased at valuations below the manager’s estimate of their long-term intrinsic values and positions are generally held for many years; three-quarters of companies in the portfolio have been held for more than 10 years.
The manager and his team spend a large part of their time reading a variety of sources, such as trade journals, research and investment books, looking for additional information to reinforce or question the reasons for an investment to remain in the FGT portfolio. The manager highlights recent information learned about top 10 positions Sage Group and Burberry. In countries where Sage operates, there are 70m small businesses, with only a fifth having any kind of accounting software. This offers significant opportunity for Sage to increase its business in existing markets, notwithstanding the opportunities to grow into new geographies. Burberry has recently reported earnings, and announced that it has conducted customer research on its brand awareness. The company ranks in the top five global luxury companies in terms of unaided brand awareness, which is strategically extremely important for future growth potential.
Current portfolio positioning
FGT currently holds 23 mainstream equities plus minor positions in the Lindsell Train Investment Trust, in unlisted Frostrow Capital (FGT’s Alternative Investment Fund Manager) and Celtic FC 6% preference shares. At end-September 2016, the top 10 positions in FGT’s portfolio accounted for 72.4% of the total. This is an increase in concentration versus 66.9% at end-September 2015; nine companies were common to both periods. Non-UK exposure is currently 17.9%, which is close to the maximum 20.0% permitted. As shown in Exhibit 3, investments are concentrated into four sectors, with consumer exposure accounting for more than two- thirds of the portfolio. There are six sectors representing c 50% of the benchmark, where FGT has zero exposure.
Exhibit 3: Portfolio sector exposure vs FTSE All-Share (% unless stated)
Portfolio end-September 2016 |
Portfolio end- September 2015 |
Change (pp) |
FTSE All-Share index weight |
Active weight |
Trust weight/ index weight (x) |
|
Consumer goods |
46.1 |
42.9 |
3.2 |
17.4 |
28.7 |
2.7 |
Consumer services |
21.8 |
26.0 |
-4.2 |
11.5 |
10.3 |
1.9 |
Technology |
9.9 |
9.2 |
0.7 |
0.9 |
9.0 |
10.5 |
Financials |
22.2 |
21.9 |
0.3 |
23.7 |
-1.5 |
0.9 |
Utilities |
0.0 |
0.0 |
0.0 |
3.9 |
-3.9 |
0.0 |
Telecommunications |
0.0 |
0.0 |
0.0 |
4.4 |
-4.4 |
0.0 |
Basic materials |
0.0 |
0.0 |
0.0 |
6.1 |
-6.1 |
0.0 |
Healthcare |
0.0 |
0.0 |
0.0 |
9.9 |
-9.9 |
0.0 |
Industrials |
0.0 |
0.0 |
0.0 |
10.6 |
-10.6 |
0.0 |
Oil & gas |
0.0 |
0.0 |
0.0 |
11.6 |
-11.6 |
0.0 |
100.0 |
100.0 |
100.0 |
Source: Finsbury Growth & Income Trust, Edison Investment Research. Note: Ranked by active weight vs index.
Portfolio turnover is very low (c 5% per year over the long term). The last new equity holding added was Rémy Cointreau in 2015; the next most recent new holding was Heineken in 2011. Both companies are international rather than UK domestic, providing exposure to a brand or theme not directly available in the UK stock market. Both companies are very well established – Heineken was founded in 1864 and Rémy Cointreau in 1724 – and both have controlling family ownership. The manager favours companies with this structure, as it means business decisions are generally made with a long-term view, even if they have a detrimental effect on short-term earnings. Rémy Cointreau was purchased following a period of significant price weakness and despite economically driven fluctuations in demand for cognac, the manager is attracted to the earnings growth from its market-leading portfolio of global brands. The average age of portfolio companies is 129 years, and half of all companies in the portfolio are family owned.
The last position in Thomson Reuters has recently been sold. It was ‘inherited’ following the merger of UK holding Reuters with Canadian company Thomson Corp in 2007. Although the stock has performed well, the position has been viewed as a source of cash to allow investment in higher-conviction UK companies. This is the first complete sale since 2013, when pub company Marston’s was sold on valuation grounds; proceeds from the sale of Thomson Reuters were reinvested into Burberry and Daily Mail and General Trust, which had weak share prices at the time. Both companies also offered a higher dividend yield.
Performance: Consistent long-term outperformance
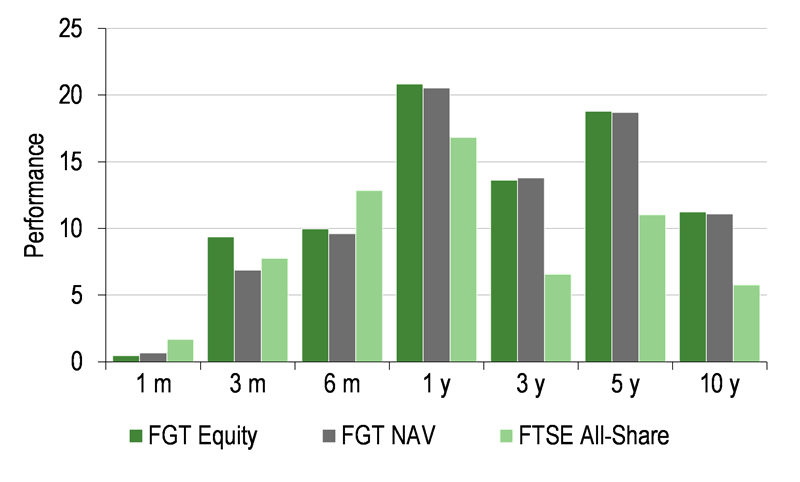
FGT has generated very strong performance versus the benchmark. From 2001 to 2016, FGT’s NAV total return was 10.0% per year versus a 4.8% annual total return in the FTSE All-Share index. In H116, FGT’s NAV and share price total returns of 10.0% and 9.9% respectively were ahead of the benchmark’s 3.5% total return. The main contributors to performance were holdings in Unilever, Sage Group and RELX.
|
Exhibit 4: Investment trust performance to 30 September 2016 |
|
Price, NAV and benchmark total return performance, one-year rebased |
Price, NAV and benchmark total return performance (%) |
|
|
|
Source: Thomson Datastream, Edison Investment Research. Note: Three, five and 10-year performance figures annualised. |
|
Looking at absolute returns in Exhibit 4 (right-hand side), FGT’s NAV and share price total returns have been particularly strong over the last 12 months. The respective share price and NAV total returns of 20.8% and 20.6% compare to the 16.8% total return of the benchmark.
|
Exhibit 5: Share price and NAV total return performance, relative to indices (%) |
|||||||
|
One month |
Three months |
Six months |
One year |
Three years |
Five years |
10 years |
Price relative to FTSE All-Share |
(1.2) |
1.5 |
(2.6) |
3.4 |
21.2 |
40.2 |
65.3 |
NAV relative to FTSE All-Share |
(1.0) |
(0.8) |
(2.9) |
3.2 |
21.8 |
39.6 |
63.3 |
Price relative to FTSE 350 |
(1.2) |
1.6 |
(2.6) |
3.4 |
21.4 |
40.9 |
65.3 |
NAV relative to FTSE 350 |
(1.0) |
(0.7) |
(2.9) |
3.1 |
22.0 |
40.3 |
63.3 |
Price relative to MSCI World |
(0.9) |
1.2 |
(6.5) |
(7.5) |
(2.4) |
10.7 |
23.2 |
NAV relative to MSCI World |
(0.7) |
(1.1) |
(6.8) |
(7.7) |
(1.9) |
10.2 |
21.7 |
|
Source: Thomson Datastream, Edison Investment Research. Note: Data to end-September 2016. Geometric calculation. |
|||||||
Exhibit 5 shows FGT’s relative returns; it has consistently outperformed the benchmark over one, three, five and 10 years. Near-term performance lags the index and is a result of a lack of exposure to energy and resource stocks, which have performed strongly. In addition, despite a rising stock market, FGT’s holdings in fund and wealth managers Hargreaves Lansdown, Schroders and Rathbones have had lacklustre near-term share price performance.
Capital structure and fees
FGT is a conventional investment trust with one class of share; there are currently 143.1m ordinary shares in issue. FGT has a £50m three-year secured fixed term revolving credit facility with Scotiabank Europe. At end-September 2016, net gearing was 2.0%.
There have recently been changes to the fee structures. Effective since 11 October 2016, portfolio manager Lindsell Train will be paid an annual management fee of 0.450% of FGT’s market cap up to £1bn, and 0.405% of market cap above £1bn, calculated monthly and payable in arrears. (Prior fees were 0.450% of market cap.) Frostrow Capital is the appointed Alternative Investment Fund Manager and provides company management, secretarial, administrative and marketing services. It will receive an annual fee of £70,000 (until the 1 October that falls after the date at which the market cap exceeds £1bn) plus 0.150% of FGT’s market cap up to £1bn, and 0.135% of market cap above £1bn; also calculated monthly and payable in arrears. (Prior fees were fixed at £70,000 per annum plus 0.15% of FGT’s market cap.) In FY15, the ongoing charges were 0.8%; this was in line with the prior year.
Dividend policy and record
FGT has a progressive dividend policy; dividends are paid twice a year in May and November. Annual dividends have increased regularly since FY11, compounding at an annual rate of 7.3%, which is significantly higher than the growth in CPI inflation over the period. FGT’s current dividend yield of 2.0% is lower than its peers. However, the trust has a total return rather than an income mandate and its NAV total returns have significantly outperformed its peers over both short and longer-term periods.
Although the rate of dividend growth of portfolio companies has slowed, after accelerating following the global financial crisis, the manager still considers that the current rate of 8% per year is attractive, particularly in real terms. The majority of portfolio companies have recently increased their dividends, such as top 10 holdings Unilever and RELX. Unilever raised its H116 dividend by 22.3% year-on-year and RELX raised its interim dividend by 38.5% year-on-year. Dividends for both companies are declared in euros and translated into sterling; sterling weakness has enhanced the income for UK investors.
Peer group comparison
FGT is one of 23 trusts in the AIC’s UK Equity Income sector. Exhibit 8 shows the larger trusts with market capitalisations greater than £300m. FGT’s NAV total return has outperformed the weighted peer group average over all periods shown, ranking first over three and 10 years out of 23 and 22 respectively. It also ranks second over one year and third over five years out of 23. Its risk-adjusted returns as measured by the Sharpe ratio rank second over one year and first over three years. At 26 October, FGT was one of five trusts in the sector trading at a premium. Its ongoing charge is modestly above the group average, but no performance fee is payable; net gearing is lower than average. FGT has the lowest dividend yield in the sector, which is a reflection of its total return rather than income-specific mandate.
Exhibit 8: Selected peer group as at 26 October 2016
% unless stated |
Market cap £m |
NAV TR 1 Year |
NAV TR 3 Year |
NAV TR 5 Year |
NAV TR 10 Year |
Sharpe 1y (NAV) |
Sharpe 3y (NAV) |
Discount (ex-par) |
Ongoing charge |
Perf. fee |
Net gearing |
Dividend yield (%) |
Finsbury Growth & Income |
933.7 |
14.9 |
42.8 |
127.4 |
189.3 |
(0.2) |
0.3 |
0.6 |
0.8 |
No |
102 |
2.0 |
City of London |
1,319.3 |
7.5 |
22.6 |
78.2 |
94.5 |
(0.5) |
(0.0) |
0.1 |
0.4 |
No |
107 |
4.0 |
Diverse Income Trust |
337.5 |
2.8 |
31.1 |
130.5 |
|
(0.8) |
0.1 |
(2.5) |
1.2 |
No |
100 |
3.2 |
Dunedin Income Growth |
369.1 |
15.3 |
14.8 |
57.4 |
57.2 |
(0.2) |
(0.1) |
(11.5) |
0.6 |
No |
115 |
4.7 |
Edinburgh Investment |
1,388.4 |
8.0 |
38.9 |
93.8 |
115.2 |
(0.6) |
0.2 |
(4.1) |
0.6 |
No |
115 |
3.5 |
JPMorgan Claverhouse |
322.9 |
8.1 |
19.1 |
77.6 |
70.1 |
(0.4) |
(0.1) |
(11.7) |
0.8 |
No |
112 |
3.7 |
Lowland |
366.1 |
7.9 |
14.8 |
97.8 |
109.7 |
(0.4) |
(0.2) |
(4.4) |
0.6 |
Yes |
105 |
3.3 |
Merchants Trust |
462.1 |
8.4 |
9.4 |
60.4 |
51.9 |
(0.4) |
(0.2) |
(13.0) |
0.6 |
No |
118 |
5.7 |
Murray Income Trust |
486.3 |
13.4 |
15.9 |
60.7 |
67.9 |
(0.2) |
(0.1) |
(8.9) |
0.7 |
No |
103 |
4.5 |
Perpetual Income & Growth |
896.8 |
3.0 |
26.9 |
95.2 |
128.9 |
(0.8) |
0.0 |
(8.8) |
0.7 |
Yes |
116 |
3.4 |
Temple Bar |
755.7 |
12.5 |
13.9 |
75.8 |
109.9 |
(0.4) |
(0.2) |
(9.7) |
0.5 |
No |
105 |
3.5 |
Weighted avg (whole sector) |
8.8 |
25.4 |
86.7 |
102.7 |
(0.5) |
0.0 |
(5.3) |
0.7 |
109 |
3.7 |
||
Rank (whole sector) |
3 |
2 |
1 |
3 |
1 |
2 |
1 |
4 |
12 |
18 |
23 |
Source: Morningstar, Edison Investment Research. Note: TR=total return. Sharpe ratio is a measure of risk-adjusted return. The ratios shown are calculated by Morningstar for the past 12- and 36-month periods by dividing a fund’s annualised excess returns over the risk-free rate by its annualised standard deviation. Net gearing is total assets less cash and equivalents as a percentage of net assets.
The board
There are six directors on the board of FGT; all are non-executive and independent of the manager. Chairman Anthony Townsend rejoined the board in February 2005 and took up his current role in January 2008. David Hunt is the senior independent director and chairman of the audit committee; he has been on the board since July 2006. The other board members and their dates of appointment are John Allard and Vanessa Renwick (October 2000); Neil Collins (January 2008); and Simon Hayes (June 2015).
|
|
Investment Companies