Last close As at 05/08/2026
GBP2.22
▲ 1.00 (0.45%)
Market capitalisation
GBP508m
Research: TMT
The year-on-year doubling of EBITA in H118 reflects continued strong underlying organic growth at GB Group (GBG), boosted by recent acquisitions and a perpetual licence deal. H2 has started well and forecasts, which are largely unchanged, appear comfortably underpinned. GBG’s consistent organic performance and increasing product innovation support its current rating, meanwhile its buy and build strategy could support further earnings-driven share price upside.
Written by
GB Group |
Excellent first half underpins outlook |
Interim results |
Software & comp services |
28 November 2017 |
Share price performance
Business description
Next events
Analysts
GB Group is a research client of Edison Investment Research Limited |
|||||||||||||||||||||||||||||||||||||||||||||||
The year-on-year doubling of EBITA in H118 reflects continued strong underlying organic growth at GB Group (GBG), boosted by recent acquisitions and a perpetual licence deal. H2 has started well and forecasts, which are largely unchanged, appear comfortably underpinned. GBG’s consistent organic performance and increasing product innovation support its current rating, meanwhile its buy and build strategy could support further earnings-driven share price upside.
Year end |
Revenue (£m) |
EBITA |
PBT* |
EPS* |
DPS |
P/E |
Yield |
03/16 |
73.4 |
13.4 |
13.2 |
8.2 |
2.1 |
53.0 |
0.5 |
03/17 |
87.5 |
17.0 |
16.5 |
9.9 |
2.4 |
43.9 |
0.6 |
03/18e |
117.1 |
23.3 |
22.6 |
11.8 |
2.5 |
36.9 |
0.6 |
03/19e |
133.4 |
27.0 |
26.4 |
13.5 |
2.8 |
32.2 |
0.6 |
Note: *PBT and EPS are normalised, excluding amortisation of acquired intangibles, exceptional items and share-based payments.
Excellent first half result
H1 results were as preannounced in October’s trading update. Revenues increased 40% y-o-y and EBITA of £10.4m doubled. The strong performance reflects the initial contribution from the acquisition of PCA Predict in May and a full six months from ID Scan, both of which continue to perform ahead of management’s expectations. Headline organic growth of 18% and EBITA margins of 19.8%, which were up 6pp on last year, were boosted by a £3.5m licensing deal. Backing this out, the underlying organic growth rate remains a consistent 12%, and margins were broadly flat year on year. Cash conversion at 92% remains high.
Forecasts comfortably underpinned
Bar the consumer engagement services (renamed to Building Relationships), growth was strong across all product lines, particularly so in fraud, risk and compliance as well as in the enlarged location intelligence segment (which includes Matchcode 360, Loqate and PCA Predict). H2 is reported to have started well and with 70% of revenues recurring in nature and a 53% increase in the deferred revenue balance, our forecasts for the full year appear comfortably underpinned.
Valuation: Momentum, investment and market
The revenue visibility and operational gearing characteristics of GBG could support a higher EBITA margin. However, management intends to manage the margin to approximately 20% over the next few years. This is enabling it to reinvest a widening margin in innovation, data sets and international expansion. It is also bolstering resources dedicated to improving customer services. These initiatives, together with the supportive market backdrop from the rising requirement for security, compliance and data management demanded by a globalising online community, should support a continued strong organic performance for the group and GBG’s 32.2x P/E rating (in line with cyber security peers). Meanwhile, its active M&A pipeline has the potential to support earnings-driven share price upside.
H1 results summary
Revenues increased by 40% to £52.6m, of which organic growth accounted for 18%, or 12% when adjusting for the impact of the sale of a perpetual licence within IDScan to a European bank. PCA Predict (acquired 9 May 2017) and IDScan (acquired 9 June 2016) together accounted for 22% of growth.
We understand that the licensing deal was from a leading European bank, which had previously bought the product from IDScan on this basis (before its acquisition by GB Group in June 2016).The company’s focus and incentive structures remain strongly weighted towards recurring revenues, which accounted for c 70% of revenues in FY17. However, this customer had allocated the spend to capex and was not prepared to reverse this. The full £3.5m was received in H1.
Adjusted EBITA of £10.4m increased by 101% and the adjusted EBITA margin increased by c 6pp to 19.8%. Backing out the impact of the licence implies an underlying margin of 14.1%, in line with that reported in H117. Despite the impact of a higher effective tax rate (13% vs 8% in H117), adjusted diluted EPS increased by 71% to 6.0p.
On a reported basis, net earnings of £2.4m (+98%) were affected by a higher charge for amortisation of acquired intangibles (£3.8m), £1.1m of share-based payments and a £1.7m exceptional charge related to the acquisitions.
Operating cash flow of £10.5m equates to a 92% cash conversion (H117: 77%). Cash conversion has benefited in part due to the upfront payment of this licence, as well as from the inclusion of the PCA business, which has a prepayment business model, as well as the implementation of a wholly owned foreign enterprise (WOFE) in order to shorten the receivables cycle in Chinese business. After the £62.9m paid for PCA Predict (net of cash acquired) and £56.3m net proceeds from the placing in May, net cash of £4.1m was reported (from net cash of £5.2m at March 2017).
Exhibit 1: Summary H118 results
£m |
H116 |
FY16 |
H117 |
FY17e |
H118 |
y-o-y change |
FY18e |
Revenues |
32.4 |
73.4 |
37.5 |
87.5 |
52.6 |
40% |
117.1 |
Share of full year total from H1 |
44% |
100% |
43% |
100% |
45% |
100% |
|
Gross profit |
24.6 |
55.8 |
28.9 |
67.2 |
41.3 |
43% |
88.6 |
Gross profit margin |
75.9% |
76.0% |
77.0% |
76.8% |
78.6% |
75.6% |
|
EBITA |
4.5 |
13.4 |
5.2 |
17.0 |
10.4 |
101% |
23.3 |
EBITA margin |
14.0% |
18.3% |
13.9% |
19.4% |
19.8% |
19.9% |
|
Amortisation of acquired intangibles |
(1.3) |
(2.5) |
(1.8) |
(4.0) |
(3.8) |
117% |
(3.5) |
Share-based payments |
(0.6) |
(1.2) |
(0.7) |
(1.0) |
(1.1) |
67% |
(1.8) |
Exceptional items |
(0.0) |
(0.1) |
(1.0) |
(1.4) |
(1.7) |
75% |
(2.2) |
Reported operating profit |
2.7 |
9.6 |
1.8 |
10.6 |
3.8 |
111% |
15.9 |
Net financing costs |
(0.1) |
(0.3) |
(0.2) |
(0.5) |
(0.3) |
17% |
(0.8) |
Adjusted PBT |
4.4 |
13.2 |
5.0 |
16.5 |
10.2 |
105% |
22.6 |
Reported PBT |
2.6 |
9.3 |
1.6 |
10.1 |
3.5 |
125% |
15.1 |
Tax |
(0.3) |
(0.2) |
(0.3) |
0.7 |
(1.1) |
228% |
(4.5) |
PAT – adjusted |
4.1 |
13.0 |
4.6 |
17.2 |
9.1 |
96% |
18.0 |
PAT – reported |
2.3 |
9.1 |
1.2 |
10.8 |
2.4 |
98% |
10.6 |
Adjusted diluted EPS (p) |
8.2 |
3.5 |
9.9 |
6.0 |
71% |
11.6 |
Source: GB Group (historics), Edison Investment Research (forecasts)
New divisional classification
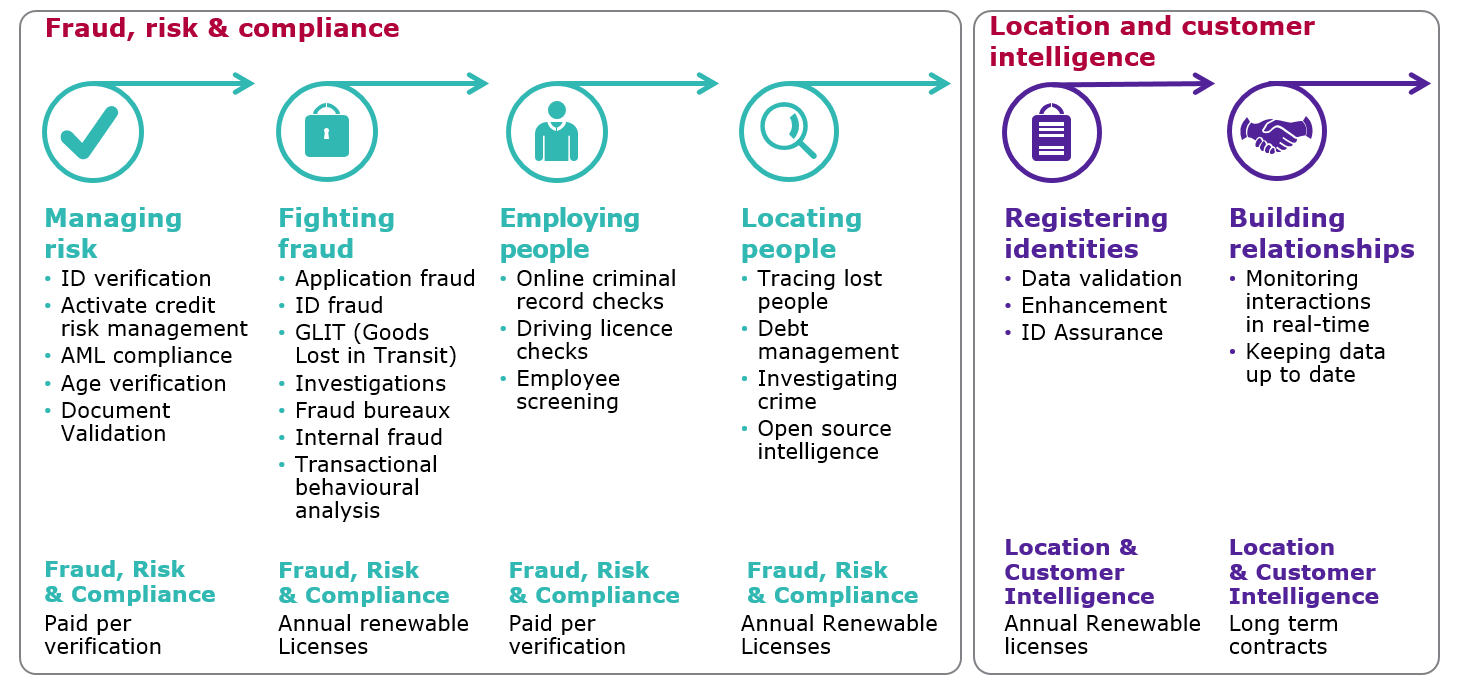
Having made 10 acquisitions over the last six years, the group structure has changed considerably, and management has reclassified its divisions to more appropriately reflect the end markets for their services as well as to provide more intuitive names for its service lines.
Identity Proofing (IDP) becomes Fraud, Risk and Compliance (FRC), and Identity Solutions (IDS) becomes Location and Customer Intelligence (LCI). Within these classifications, the Trace and Investigate service is now classified within Fraud, Risk and Compliance. Exhibit 2 details the new divisional structure.
|
Exhibit 2: New divisional classification |
|
|
Source: GB Group |
Divisional performance
The Fraud, Risk and Compliance (FRC) division saw revenues increase by 35% to £32.1m with EBITA margins of 24.0% (H117: 18.6%) resulting in a 74% increase in EBITA to £7.7m. Location and Customer Intelligence (LCI) revenues increased by 50% to £20.6m and EBITA margins almost doubled y-o-y to 16.7% resulting in a near doubling of EBITA to £3.4m.
Fraud, risk and compliance: 12% of revenue growth relates to the inclusion of IDScan (within managing risk) for a full six months. The organic growth of 27% in part reflects the aforementioned sale of a perpetual licence. Backing this out, underlying divisional organic growth was 12%. All product lines performed well, particularly the fraud and risk management products.
The licence sale added £3.5m to divisional EBITA and accounts for the 5.4pp increase in margins to 24.0%. On an underlying basis, margins in this division were approximately 14.6%, down on last year’s 18.6%, consistent with management’s strategy to increase the pace of investment in this division in order to support the international growth plan, deepening of data sets and investment in capabilities. It also continues to absorb losses from GBG’s gov.uk/verify platform, which has had a slower uptake than initially anticipated.
Location and Customer Intelligence: Organic growth was 2% and the acquisition impact from PCA Predict 48%. Whereas the consumer engagement services continue to feel the effects of competitive pressure (revenues down 9%), Identity Registration services increased revenues by 77%. We estimate that the acquisition of PCA Predict accounts for c 70% of this growth, which means 7% organic growth from these services; PCA Predict, which provides type ahead look up functionality to SMEs, provides an excellent complement to GBG’s other address intelligence services: Loqate and Matchcode 360. This acquisition (which we looked at in more detail in our May report, PCA acquisition an excellent fit) has given the group a market-leading position in the address intelligence market. The integration is on track; first half profits and revenues are ahead of management’s expectations and it has accelerated its plans to expand in the US and Germany (with Australia to follow). Moving forward, the three product sets within the registering identities segment will be moved to a common brand, and more of GBG’s wider data sets integrated. The integration of PCA Predict underpinned the near doubling of margins in this division to 16.7%.
Exhibit 3 presents the divisional performance in H118. Given the new classification of divisions, we also include some historical information under the new segmentation.
Exhibit 3: Divisional performance – new classification (£000s)
Revenues |
2015 |
H116 |
2016 |
H117 |
2017 |
H118 |
Managing risk |
14,900 |
9,600 |
19,800 |
12,354 |
27,614 |
18,555 |
Locating people |
8,600 |
4,000 |
9,900 |
4,800 |
11,000 |
5,000 |
Fraud management |
6,000 |
3,300 |
7,700 |
3,700 |
10,300 |
5,400 |
Employ and comply |
4,300 |
2,500 |
5,000 |
2,900 |
5,900 |
3,100 |
Total: Fraud, Risk & Compliance |
33,800 |
19,400 |
42,400 |
23,754 |
54,814 |
32,055 |
Registering identities |
13,500 |
7,500 |
18,000 |
9,300 |
22,172 |
16,471 |
Building relationships |
10,100 |
5,400 |
13,000 |
4,500 |
10,500 |
4,100 |
Total: Location & Customer Intelligence |
23,600 |
12,900 |
31,000 |
13,758 |
32,672 |
20,571 |
Total revenue |
57,283 |
32,368 |
73,401 |
37,512 |
87,468 |
52,626 |
Revenue growth |
||||||
Managing risk |
26% |
43% |
33% |
29% |
39% |
50% |
Locating people (Trace and investigate) |
19% |
21% |
15% |
20% |
11% |
4% |
Fraud management |
27% |
28% |
12% |
34% |
46% |
|
Employ and comply |
30% |
25% |
16% |
16% |
18% |
6% |
Total: Fraud, Risk & Compliance |
52% |
33% |
25% |
22% |
29% |
35% |
Registering identities |
4% |
32% |
33% |
24% |
23% |
78% |
Building relationships |
58% |
80% |
29% |
-17% |
-19% |
-10% |
Total: Location & Customer Intelligence |
21% |
50% |
31% |
7% |
5% |
50% |
Total revenue growth |
37% |
39% |
28% |
16% |
19% |
40% |
EBITA margins |
||||||
Fraud, Risk & Compliance |
19.5% |
22.2% |
24.3% |
18.6% |
23.6% |
24.0% |
Location & Customer Intelligence |
20.3% |
5.4% |
12.9% |
8.5% |
14.6% |
16.7% |
Group (post group costs) |
18.8% |
14.0% |
18.3% |
13.9% |
19.4% |
19.8% |
Source: GB Group
Outlook: On track to meet FY18 expectations
Bar the consumer marketing services, all of GBG’s product lines are growing strongly, as are the recent acquisitions: GBG DecTec, GBG Loqate, ID Scan and PCA Predict. H2 has reportedly started well, with good growth both from the UK and internationally (now accounting for 30% of revenues or 33% adjusting for PCA).
The recognition of 100% of the revenues from the perpetual licence sale means this year will be more H1 weighted than typical. However, the underlying organic growth of 12% is consistent with our FY estimates, and recent periods and our full year forecast look very well underpinned; approximately 70% of revenues are recurring in nature, and the H118 deferred revenue balance has increased 53% y-o-y to £23.7m (covering 20% of our FY18 revenue forecast, vs 18% this time last year).
With a target EBIT margin of c 20%, this good visibility and high operational gearing is enabling the group to invest a widening margin in expanding and improving its product sets, international expansion as well as increasing its focus on customer service, further supporting future growth.
We leave our estimates for adjusted net profit. However, we make some changes to our forecast for amortisation of acquired intangibles following the recent acquisitions and make some small changes to our estimates for share based payments and the diluted share count. These changes result in a slight reduction to our adjusted EPS (2% in FY18e) and reduce our forecasts for reported EPS by 48% in FY18 to 3.7p and 35% in FY19 to 7.0p.
|
Exhibit 4: Trend of organic vs acquisition growth |
Exhibit 5: New divisional revenue and EBIT split FY18e |
|
|
|
Source: GB Group |
Source: Edison Investment Research |
|
Exhibit 4: Trend of organic vs acquisition growth |
|
|
Source: GB Group |
|
Exhibit 5: New divisional revenue and EBIT split FY18e |
|
|
Source: Edison Investment Research |
Valuation
On an EV/EBITA of 28.3x FY18 (March year-end) and 24.4x in FY19, and P/E multiples of 36.9x and 32.2x, respectively, the shares are already factoring in the group’s superior growth prospects to other identity management groups such as Experian and Equifax (average of 19.0x FY17 EV/EBIT, 17.3x FY18 EBIT). With approximately 60% of revenues now derived from the fast-growing Fraud, Risk and Compliance services and a further 30% from the high-growth services for Registering Identities and Location Intelligence, we believe it appropriate to benchmark GBG against the wider internet security peer set, which shares similar organic growth and margin characteristics as GBG. This peer set trades on an average EV/EBITA of 26.0x this year and 21.8x next year and on P/Es of 41.7x and 30.5x, respectively, in line with GBG.
We believe this rating is supported by the group’s organic growth prospects. By way of illustration, a reverse DCF (8.4% WACC, 3% perpetuity growth after 10 years) implies that the current share price is discounting organic revenue growth of approximately 13% over the next 10 years, assuming a stable EBITDA margin (in line with management’s current policy).
GBG’s growing scale, widened product sets and international presence should support the current level of organic growth over the medium term, and the investments made in product and customer have the potential to add new revenue streams further down the line.
We see potential for share price upside to be driven through management’s active M&A strategy. GBG has made 10 acquisitions over the last five years, adding capabilities, data sets and client reach, as well as driving revenue and cost synergies; most recently, it acquired PCA Predict, which is expected to be earnings accretive in its first year despite a planned increase in investment. The global market for identity data intelligence services remains fragmented, which should provide GBG with a steady pipeline of acquisition opportunities.
Exhibit 6: DCF scenarios (p/share)
EBITDA margin |
|||||||||
20.0% |
21.0% |
22.0% |
23.0% |
24.0% |
25.0% |
26.0% |
27.0% |
||
Revenue growth |
3.0% |
35 |
36 |
38 |
40 |
41 |
43 |
45 |
47 |
5.0% |
98 |
103 |
109 |
115 |
121 |
128 |
135 |
142 |
|
7.5% |
176 |
186 |
197 |
209 |
221 |
233 |
247 |
261 |
|
10.0% |
254 |
270 |
286 |
302 |
320 |
339 |
359 |
380 |
|
12.5% |
349 |
370 |
392 |
415 |
440 |
466 |
494 |
523 |
|
15.0% |
411 |
436 |
462 |
490 |
520 |
551 |
583 |
618 |
|
Source: Edison Investment Research
Exhibit 7: Financial summary
£000s |
2014 |
2015 |
2016 |
2017 |
2018e |
2019e |
||
Year end March |
IFRS |
IFRS |
IFRS |
IFRS |
IFRS |
IFRS |
||
PROFIT & LOSS |
||||||||
Revenue |
|
|
41,835 |
57,283 |
73,401 |
87,468 |
117,093 |
133,352 |
Cost of Sales |
(14,473) |
(16,448) |
(17,606) |
(20,302) |
(28,538) |
(32,461) |
||
Gross Profit |
27,362 |
40,835 |
55,795 |
67,166 |
88,555 |
100,890 |
||
EBITDA |
|
|
7,849 |
11,844 |
14,772 |
18,734 |
25,300 |
29,270 |
Operating Profit (before amort. and except.) |
7,164 |
10,790 |
13,428 |
17,006 |
23,300 |
27,000 |
||
Acquired intangible amortisation |
(1,110) |
(1,986) |
(2,501) |
(4,022) |
(8,000) |
(8,000) |
||
Exceptionals |
(1,080) |
(1,629) |
(94) |
(1,410) |
(2,200) |
0 |
||
Share of associate |
(159) |
(10) |
0 |
0 |
0 |
0 |
||
Share based payments |
(747) |
(971) |
(1,245) |
(994) |
(2,300) |
(2,500) |
||
Operating Profit |
4,068 |
6,194 |
9,588 |
10,580 |
10,800 |
16,500 |
||
Net Interest |
(79) |
(266) |
(270) |
(498) |
(600) |
(500) |
||
Profit Before Tax (norm) |
|
|
7,085 |
10,524 |
13,158 |
16,508 |
22,700 |
26,500 |
Profit Before Tax (FRS 3) |
|
|
3,989 |
5,928 |
9,318 |
10,082 |
10,200 |
16,000 |
Tax |
(474) |
(1,127) |
(178) |
668 |
(4,540) |
(5,300) |
||
Profit After Tax (norm) |
5,597 |
8,314 |
10,395 |
13,206 |
18,160 |
21,200 |
||
Profit After Tax (FRS 3) |
3,515 |
4,801 |
9,140 |
10,750 |
5,660 |
10,700 |
||
Average Number of Shares Outstanding (m) |
109.6 |
119.1 |
122.7 |
131.6 |
151.0 |
152.8 |
||
EPS - normalised (p) |
|
|
5.1 |
7.0 |
8.5 |
10.0 |
12.0 |
13.9 |
EPS - normalised and fully diluted (p) |
|
4.8 |
6.7 |
8.2 |
9.9 |
11.8 |
13.5 |
|
EPS - (IFRS) (p) |
|
|
3.2 |
4.0 |
7.4 |
8.2 |
3.7 |
7.0 |
Dividend per share (p) |
1.7 |
1.9 |
2.1 |
2.4 |
2.5 |
2.8 |
||
Gross Margin (%) |
65.4 |
71.3 |
76.0 |
76.8 |
75.6 |
75.7 |
||
EBITDA Margin (%) |
18.8 |
20.7 |
20.1 |
21.4 |
21.6 |
21.9 |
||
Operating Margin (before GW and except.) (%) |
17.1 |
18.8 |
18.3 |
19.4 |
19.9 |
20.2 |
||
BALANCE SHEET |
||||||||
Fixed Assets |
|
|
26,985 |
51,238 |
59,364 |
105,653 |
172,353 |
164,733 |
Intangible Assets |
23,329 |
45,296 |
54,113 |
98,753 |
164,653 |
156,503 |
||
Tangible Assets |
1,519 |
2,829 |
2,234 |
2,856 |
3,656 |
4,186 |
||
Other fixed assets |
2,137 |
3,113 |
3,017 |
4,044 |
4,044 |
4,044 |
||
Current Assets |
|
|
23,775 |
33,186 |
36,189 |
48,187 |
66,461 |
84,785 |
Debtors |
11,929 |
17,408 |
23,774 |
30,569 |
49,815 |
57,394 |
||
Cash |
11,846 |
15,778 |
12,415 |
17,618 |
16,646 |
27,391 |
||
Other |
0 |
0 |
0 |
0 |
0 |
0 |
||
Current Liabilities |
|
|
(17,861) |
(30,784) |
(32,559) |
(44,444) |
(61,190) |
(66,469) |
Creditors |
(17,861) |
(24,305) |
(30,927) |
(36,436) |
(53,182) |
(58,461) |
||
Contingent consideration |
0 |
(5,733) |
(1,050) |
(7,122) |
(7,122) |
(7,122) |
||
Short term borrowings |
0 |
(746) |
(582) |
(886) |
(886) |
(886) |
||
Long Term Liabilities |
|
|
(2,066) |
(7,506) |
(6,593) |
(15,940) |
(23,040) |
(19,040) |
Long term borrowings |
0 |
(3,643) |
(3,160) |
(11,499) |
(18,599) |
(14,599) |
||
Contingent consideration |
0 |
(895) |
0 |
0 |
0 |
0 |
||
Other long term liabilities |
(2,066) |
(2,968) |
(3,433) |
(4,441) |
(4,441) |
(4,441) |
||
Net Assets |
|
|
30,833 |
46,134 |
56,401 |
93,456 |
154,584 |
164,009 |
CASH FLOW |
||||||||
Operating Cash Flow |
|
|
9,355 |
11,684 |
13,397 |
16,305 |
20,600 |
26,970 |
Net Interest |
(79) |
(266) |
(282) |
(498) |
(600) |
(500) |
||
Tax |
65 |
(337) |
(248) |
(2,193) |
(4,540) |
(5,300) |
||
Capex |
(1,144) |
(2,011) |
(1,762) |
(2,227) |
(2,700) |
(2,650) |
||
Acquisitions/disposals |
(1,443) |
(18,672) |
(12,263) |
(36,840) |
(74,000) |
0 |
||
Financing |
416 |
10,954 |
790 |
24,755 |
56,261 |
0 |
||
Dividends |
(1,632) |
(1,955) |
(2,277) |
(2,775) |
(3,093) |
(3,775) |
||
Net Cash Flow |
5,538 |
(603) |
(2,645) |
(3,473) |
(8,072) |
14,745 |
||
Opening net debt/(cash) |
|
|
(6,308) |
(11,846) |
(11,389) |
(8,673) |
(5,233) |
2,839 |
HP finance leases initiated |
0 |
0 |
0 |
0 |
0 |
0 |
||
Other |
0 |
146 |
(71) |
33 |
0 |
0 |
||
Closing net debt/(cash) |
|
|
(11,846) |
(11,389) |
(8,673) |
(5,233) |
2,839 |
(11,906) |
Source: GB Group (historic), Edison Investment Research (forecast)
|
|
Research: Healthcare
Selvita offers a two-pronged strategy with steady double digit growth from its drug discovery business coupled with potential upside from drug development within its broad R&D pipeline. Recently the company introduced a new strategy for 2017-2021 focused on continuing growth in the Services business and ramping up investment in the internal R&D pipeline. While this has been overshadowed somewhat by the clinical hold on the lead asset SEL24, our investment thesis for Selvita is based on supportive long-term company-specific and macro trends and we increase our valuation from PLN577m to PLN1.04bn or PLN75/share.