Share’s full-year results were similar to our expectations with revenue growth of over 12%, despite the equity market downturn in the final quarter. The group is now drawing to the end of its investment programme to achieve a digital transformation and has succeeded in making further acquisitions to gain greater scale. With a pipeline of further transactions and full benefits of its IT spend still to come, earnings should respond in a geared fashion, reducing the current high earnings multiples substantially on a medium-term view.
Written by
Share |
Evidence that investment is paying off |
FY18 results |
Financial services |
28 March 2019 |
Share price performance
Business description
Next events
Analysts
Share is a research client of Edison Investment Research Limited |
|||||||||||||||||||||||||||||||||||||||||||||||
Share’s full-year results were similar to our expectations with revenue growth of over 12%, despite the equity market downturn in the final quarter. The group is now drawing to the end of its investment programme to achieve a digital transformation and has succeeded in making further acquisitions to gain greater scale. With a pipeline of further transactions and full benefits of its IT spend still to come, earnings should respond in a geared fashion, reducing the current high earnings multiples substantially on a medium-term view.
Year end |
Revenue (£m) |
PBT* |
EPS* |
DPS |
P/E |
Yield |
12/17 |
18.7 |
0.4 |
0.27 |
0.40 |
94.6 |
1.5 |
12/18 |
21.0 |
0.7 |
0.45 |
0.55 |
58.1 |
2.1 |
12/19e |
22.3 |
1.3 |
0.75 |
0.70 |
34.9 |
2.7 |
12/20e |
23.0 |
1.5 |
0.86 |
0.75 |
30.2 |
2.9 |
Note: *PBT and EPS are normalised, excluding amortisation of acquired intangibles, exceptional items and share-based payments.
FY18 results
Revenue growth was over 12%, benefiting in part from the full inclusion of the Computershare partnership (started May 2017). Fee income was up 8% whereas commission was more modestly ahead (+3%), with the second half (-9% vs H217) affected by the significant weakness in equity markets in Q4. Interest income more than doubled, reflecting higher rates and customer cash balances. There was an EBITDA profit of £0.5m (loss £0.4m) and operating loss of £0.3m (£0.79m). Normalised EPS was up from 0.27p to 0.45p and the full-year dividend was increased from 0.40p to 0.55p. Operationally, significant progress was made on the investment programme with key customer-evident outcomes including a new website launch and functionality added to The Share Centre App. The acquisition of the Beaufort Securities accounts has gone well, with 17,000 accounts transferred and a 78% retention rate recorded to end February.
Outlook
The uncertain macro background was unhelpful in Q418 and early this year, but Share has seen an increase in activity among its customers recently. It remains to be seen how resilient investor confidence will be but Share should benefit from completion of its digital transformation and hence a levelling out in its related expenditure. Full benefits from the enhanced customer experience should become evident over time as will the scale benefits of its acquisition and partnership strategy with a further tranche of 22,000 accounts due to transfer in Q3 this year. Our estimate for revenues increases modestly (+3%) but this feeds through to a 19% increase in PBT forecast for 2019 (see page 6).
Valuation: Increased to reflect improving profitability
We still focus on a DCF valuation given the group is at a relatively early point in its improvement in profitability. Reflecting increased estimates our central valuation is now 32p (was 31p – see page 7).
FY18 results show progress on several fronts
To provide a longer-term context for the 2018 results, we show assets under administration (AUA) and revenue since 2008 in Exhibits 1 and 2. AUA have grown at a compound rate of 18% over the period, outpacing the FTSE 100 price index, which had a CAGR of 4%. Share has augmented growth in AUA arising from asset appreciation and individual client additions by securing corporate partnerships such as those with Henderson and Barclays and by buying books of business (most recently from the administrator of Beaufort Securities, last year). AUA grew by 3% in 2018 to £4.9bn, despite a 13% decline in the UK equity market. At the end of February this year AUA stood at over £5bn. The fund-of-fund offering (providing an easy entry point for those new to investing) increased AUM from £101m to £110m. Revenues are not directly linked to AUA as flat administration fees are charged but growth in AUA is likely to generate greater volume of trading and hence dealing commission.
The analysis of revenues over this period shows how interest income declined as rates fell following the financial crisis. From 2013 to 2016 overall revenue trod water as the introduction of a flat administration fee structure and the ending of trail commissions following the Retail Distribution Review also took effect. The last two years have seen a return to growth helped in part by book acquisitions and partnerships.
|
Exhibit 1: Share AUA |
Exhibit 2: Share revenue analysis |
|
|
|
Source: Share plc |
Source: Share plc |
|
Exhibit 1: Share AUA |
|
|
Source: Share plc |
|
Exhibit 2: Share revenue analysis |
|
|
Source: Share plc |
The profit and loss figures for H218 and FY18 are compared with prior periods in Exhibit 3 and we highlight key points below, referencing the full-year comparison unless stated.
■
Group revenue increased by more than 12% with the largest contributor to growth being interest income, which more than doubled, benefiting from higher cash held on behalf of customers (+15% to £446m), higher rates and the ability to use term deposits (permitted by the FCA from April 2017). Fee income was 8% up, helped by a 5% increase in the number of customer accounts containing assets to 271,000; this was after closure of dormant, empty and deceased accounts equivalent to nearly 3% of the opening level. Dealing commission was up 3%, held back by the market downturn in Q4 and, reflecting this, second-half commissions were 9% and 12% down on H217 and H118, respectively.
■
Costs increased by 9% with the largest contributor being an 11% increase in staff costs and a 9% increase in headcount to 244 as the customer service and dealing teams were enlarged to facilitate expansion of the customer base. Transaction costs rose 9%, reflecting sharing of commission with Computershare, which is included within costs. Marketing costs fell as more of this activity was undertaken in-house.
■
Normalised pre-tax profit doubled to £0.7m, while there was only a marginal reported loss for the full year and a profit in the second half (£0.25m versus H118 loss of £0.28m).
■
Normalised EPS increased from 0.27p to 0.45p and the full-year dividend increased from 0.40p to 0.55p.
Exhibit 3: FY18 and H218 profit and loss analysis
Year-end 31 December (£000) |
H217 |
H118 |
H218 |
H217 vs H216 % |
FY17 |
FY18 |
% change* |
Account fees |
3,667 |
3,603 |
4,197 |
14.4 |
7,200 |
7,800 |
8.0 |
Dealing Commissions |
5,608 |
5,791 |
5,109 |
(8.9) |
10,600 |
10,900 |
3.0 |
Interest and other income |
576 |
781 |
1,558 |
170.6 |
926 |
2,339 |
150.0 |
Revenue |
9,851 |
10,175 |
10,864 |
10.3 |
18,726 |
21,039 |
12.4 |
Total costs |
(10,445) |
(10,695) |
(10,659) |
2.0 |
(19,519) |
(21,354) |
9.4 |
Operating profit |
(594) |
(520) |
205 |
(134.5) |
(793) |
(315) |
(60.3) |
Investment revenues |
18 |
245 |
48 |
166.7 |
225 |
293 |
30.2 |
Other losses and gains |
(16) |
0 |
0 |
(100.0) |
51 |
0 |
(100.0) |
Non-recurring items |
900 |
0 |
0 |
(100.0) |
900 |
0 |
(100.0) |
Pre-tax profit |
308 |
(275) |
253 |
(17.9) |
383 |
(22) |
(105.7) |
Normalising adjustments: |
|||||||
Other gains and losses |
(884) |
0 |
0 |
(100.0) |
(951) |
0 |
(100.0) |
Non-recurring items incl. FSCS |
301 |
171 |
207 |
(31.2) |
397 |
378 |
(4.8) |
One-off/restructuring |
114 |
13 |
130 |
14.0 |
114 |
143 |
25.4 |
Share-based payments |
242 |
267 |
284 |
17.4 |
513 |
551 |
7.4 |
Profit share impact of above |
74 |
(94) |
(106) |
(243.2) |
9 |
(200) |
(2,322.2) |
Normalised pre-tax profit |
41 |
69 |
638 |
1,456.1 |
351 |
707 |
101.4 |
Tax |
(11) |
(4) |
(43) |
290.9 |
(73) |
(47) |
(35.6) |
Post-tax profit |
297 |
(279) |
210 |
(29.3) |
310 |
(69) |
(122.3) |
Normalised post-tax profit |
128 |
50 |
576 |
350.0 |
383 |
626 |
63.4 |
Source: Share plc. Note: *Rounded segmental revenue % change as reported for FY18/17.
Exhibits 4 and 5 show revenue performance in 2018 compared with peers and revenue market share. The peer group data is collated by Compeer and comprises 15 other retail stockbroking companies including Hargreaves Lansdown.1 The revenue comparison shows Share ahead of the group on dealing commission but below on fees, with the peer fee performance probably reflecting adjustments to fee structure following the integration of Interactive Investor and TD Direct. The dramatic relative increase in Share’s interest income reflects recovery from a low level while some peers may have benefited previously from their position as subsidiaries of banks. Market share has been broadly stable during 2018 and, although marginally lower than in 2017, has shown progress over the period shown.
Full list: AJ Bell; Alliance Trust Savings; Barclays Stockbrokers; Equiniti; Halifax Share Dealing; Hargreaves Lansdown; HSBC Stockbrokers; iDealing.com; Interactive Investor; ITI Capital; Jarvis Investment Management; Saga Personal Finance; Selftrade; Thomas Grant & Co; and Yorkshire Building Society.
|
Exhibit 4: Revenue performance versus peers |
Exhibit 5: Revenue market share |
|
|
|
Source: Share plc |
Source: Compeer, Share plc |
|
Exhibit 4: Revenue performance versus peers |
|
|
Source: Share plc |
|
Exhibit 5: Revenue market share |
|
|
Source: Compeer, Share plc |
Share has continued to make progress against its strategic objectives: putting customers first; focus on the core business; and strategic partnerships and acquisitions.
Addressing the customer first and core focus objectives, Share has now largely completed its digital transformation plan initiated in 2016. The new website was launched in April 2018 and the functionality of the mobile app was also enhanced, increasing the usability and appeal of both methods of accessing The Share Centre’s services. The app now regularly accounts for 8% of trades. During 2018 the group also adapted its processes and systems to deal with regulatory changes including MiFID II, PRIIPs and GDPR. Earlier elements in the IT investment programme included renewing key elements of the group’s IT infrastructure, including migrating customers to a new database. More recent work has included the introduction of survey software to provide rapid feedback on customer contact centre performance, enhancement of back-office systems and new solutions to improve the efficiency of staff training. Following completion of the programme investment will continue but at a lower level. In addition to benefiting from the improved customer experience arising from investments in technology, it can be argued that Share now has a more sustainable (less risky) platform for development of the business.
On the acquisitions, Share announced at the first-half stage that it had reached three agreements for the acquisition of a combined c 39,000 customer accounts and over £1.5bn of assets under administration. One was the acquisition from the administrator of Beaufort Securities of c 17,500 clients with reported assets of c £570m and cash of £50m (Financial Times, 9 August). The consideration has not been disclosed but the apparent absence of substantial uptick within the investment items in cash flow for H218 suggests it was relatively small. Share reports that over 17,000 accounts have been transferred and that more than 78% of these have been retained: a higher than expected level given the poor experience of these investors at the previous firm.
The second transaction has involved the transfer of a small number of accounts and a position as preferred destination for Premier Asset Management clients. The third agreement has not been disclosed but a further transfer of c 22,000 accounts is expected in Q3 this year. Exhibit 6 puts this transfer in context. We have used an illustrative retention rate of 60% (higher than we previously assumed for all three acquisitions but below the rate for Beaufort Securities accounts to date). On this basis the transfer would add 5% to the number of accounts and would increase the average AUA.
Exhibit 6: Third acquisition – numbers in context
AUA and client accounts |
% of end 2018 |
|
End 2018 AUA (£bn) |
4,900 |
|
End 2018 client accounts |
271,000 |
|
Estimated AUA to be added (£bn) |
930 |
19% |
Retention rate |
60% |
|
AUA retained (£bn) |
558 |
11% |
Accounts to be added |
22,000 |
8% |
Retention rate |
60% |
|
Accounts retained |
13,200 |
5% |
AUA per end 2018 account (£) |
18,081 |
|
AUA per account added (£) |
42,273 |
134% |
Source: Edison Investment Research, Share plc
Background and outlook
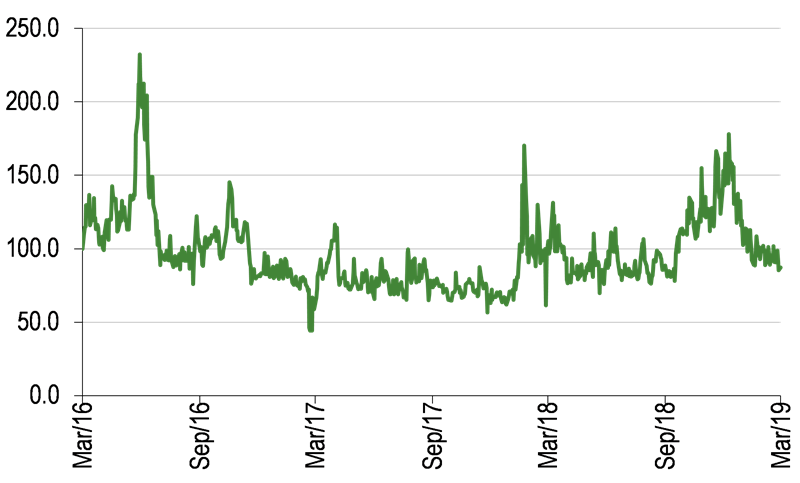
UK equity market performance and volatility are illustrated in the next two charts, showing the Q418 market dip and spike in volatility followed by a recovery and reduced volatility in the current year, despite continuing macro uncertainties.
|
Exhibit 7: FTSE All-Share Index (total return) |
Exhibit 8: FTSE 100 Implied Volatility Index |
|
|
|
Source: Refinitiv |
Source: Refinitiv |
|
Exhibit 7: FTSE All-Share Index (total return) |
|
|
Source: Refinitiv |
|
Exhibit 8: FTSE 100 Implied Volatility Index |
|
|
Source: Refinitiv |
As a measure of retail investor confidence and appetite for investment, we show the level of UK retail equity fund sales, as reported by the Investment Association. The annual series shows that 2018 as a whole saw much reduced but still positive net flows, while the more volatile monthly series on the right shows a move into negative flows in the four months to end January this year.
On this front, Share has seen some recovery in its own volumes more recently, suggesting the recovery in equity market level has fed through to a greater willingness to invest and trade.
|
Exhibit 9: Annual retail equity fund net sales |
Exhibit 10: Recent monthly equity fund sales |
|
|
|
Source: Investment Association |
|
Exhibit 9: Annual retail equity fund net sales |
|
|
Source: Investment Association |
|
Exhibit 10: Recent monthly equity fund sales |
|
|
Source: Investment Association |
Prospectively, Share’s near-term revenue progression will be dependent on market trends and further evolution of investor confidence. Leaving these macro-influenced factors aside, the level of client retention on newly acquired accounts may be a material factor, while the investment in technology should be positive for both individual client retention and recruitment and securing partnership deals. Otherwise, interest income should continue to benefit from higher rates and customer balances through the current year with a smaller increase likely in the following year. (See estimate revisions set out in the next section and financial summary on page 8.)
The FCA published its final report on the investment platforms market study recently. This indicated it wishes to make switching between platforms simpler, including the ability to transfer in specie and flexibility in moving between fund unit classes to facilitate this, and it believes a ban on exit fees would be appropriate to reduce consumer harm. From Share’s perspective, this has a minimal impact given the relatively low exit charge of £25 per account levied by Share, while there could be a positive effect from easing the transfer process from other platforms. On this front the ongoing impact of MiFID II mandated disclosure of costs could encourage migration to Share’s flat fee structure.
The next section provides a summary of estimate changes and the financial position.
Financials
Changes in the key lines from our estimate for 2019 and new numbers for 2020 are shown below. The overall change in revenue assumption is small (+3%) but because the group was previously expected to record only a marginal operating profit (before investment income, which is expected to be relatively stable), the impact on pre-tax profit is significant (+19%). Further detail from our forecasts is included in Exhibit 14.
Exhibit 11: Estimate revisions
Revenue (£m) |
PBT* (£m) |
EPS* (p) |
Dividend (p) |
||||||||||
Old |
New |
% chg |
Old |
New |
% chg |
Old |
New |
% chg |
Old |
New |
% chg |
||
2018 |
20.5 |
21.0 |
3% |
0.8 |
0.7 |
-7% |
0.44 |
0.45 |
2% |
0.55 |
0.55 |
0% |
|
2019e |
21.6 |
22.3 |
3% |
1.1 |
1.3 |
19% |
0.63 |
0.75 |
19% |
0.70 |
0.70 |
0% |
|
2020e |
- |
23.0 |
N/A |
- |
1.5 |
N/A |
- |
0.86 |
N/A |
- |
0.75 |
N/A |
|
Source: Edison Investment Research. Note: *PBT and EPS are normalised, excluding exceptional items and share-based payments. For 2018 “old” figures are estimated and “new” actual.
Share ended the year with cash of £9.0m and no debt. This compared with cash of £10.5m in 2017. The primary source of the outflow was investment of £1.4m in intangible and tangible assets (primarily related to IT expenditure but also including the purchase of the Beaufort Securities accounts). We expect such spending to be lower at between £0.6m and £0.7m for 2019 and 2020. From a regulatory capital perspective, the group’s capital requirement has been reduced from £5m for 2018 to £3.9m for 2019 (reflecting improved profitability). It holds 3.8x the required level of capital providing sufficient headroom to accommodate the opportunities in its acquisition/ partnership pipeline, for example.
Valuation
We have updated a comparative table used in our previous notes comparing a number of measures for Share, Hargreaves Lansdown and now AJ Bell (replacing Alliance Trust Savings, which has been taken over by Interactive Investor). We have set the surplus capital adjustment to allow for 2x coverage (Share’s target level). This shows Share trading at an adjusted value of 1.4x revenue compared with 17.9x and 13.8x for Hargreaves Lansdown and AJ Bell, respectively. Similarly, for value as a percentage of AUA, Share is significantly lower at 0.6% versus 9.8% and 2.8%, respectively.
Exhibit 12: Peer comparison
£m unless stated |
Share |
Hargreaves Lansdown |
AJ Bell |
Market capital |
36 |
8,443 |
1,266 |
Surplus capital (at 2x requirement) |
7 |
(1) |
26 |
Adjusted value |
29 |
8,444 |
1,240 |
Revenue |
21 |
473 |
90 |
Assets under administration (AUA) |
4,900 |
85,900 |
44,200 |
Accounts (number of active clients for HL) |
271,000 |
1,136,000 |
204,483 |
Adjusted value/revenue (x) |
1.4 |
17.9 |
13.8 |
Adjusted value/AUA (%) |
0.6 |
9.8 |
2.8 |
Descriptive metrics |
|||
Revenue/average AUA (bps) |
44 |
52 |
21 |
Market/stated value per account |
133 |
7,432 |
6,191 |
AUA per account (£) |
18,081 |
75,616 |
216,155 |
Revenue per account (£) |
81 |
425 |
495 |
Adjusted value per account (£) |
107 |
7,433 |
6,066 |
Source: Edison Investment Research, companies’ disclosure. Note: Share AUA and revenue FY18, Hargreaves Lansdown, H119 and AJ Bell, FY18 and Q119 update. Priced on 27 March.
We have also updated our DCF valuation using assumptions that include intermediate growth (2021–23) of c 20% to capture operational gearing (lower than previously as profitability has already improved), long-term growth of 4%, a discount rate of 10% and a terminal multiple of 10x. Allowing for changes to our FY19 assumptions, our central value (see sensitivity in Exhibit 13) increases from 31p to 32p.
Exhibit 13: Discounted cash flow valuation sensitivity (pence per share)
Discount rate |
|||||
Long-term growth |
8% |
9% |
10% |
11% |
12% |
2% |
33.6 |
31.7 |
30.1 |
28.6 |
27.3 |
3% |
34.7 |
32.8 |
31.0 |
29.4 |
28.0 |
4% |
35.9 |
33.8 |
32.0 |
30.3 |
28.8 |
5% |
37.2 |
35.0 |
33.0 |
31.2 |
29.6 |
Source: Edison Investment Research
Exhibit 14: Financial summary
£000 |
2014 |
2015 |
2016 |
2017 |
2018 |
2019e |
2020e |
|
Year end 31 December |
||||||||
PROFIT & LOSS |
||||||||
Account fees |
6,610 |
6,400 |
6,784 |
7,200 |
7,800 |
8,346 |
8,638 |
|
Dealing Commissions |
6,610 |
6,400 |
7,040 |
10,600 |
10,900 |
10,737 |
11,059 |
|
Interest and other income |
1,800 |
1,250 |
786 |
926 |
2,339 |
3,214 |
3,349 |
|
Revenue |
|
15,042 |
14,050 |
14,610 |
18,726 |
21,039 |
22,297 |
23,046 |
Administrative expenses (exc amortisation and depreciation) |
(14,579) |
(14,812) |
(15,727) |
(19,169) |
(20,536) |
(20,620) |
(21,180) |
|
EBITDA |
|
463 |
(762) |
(1,117) |
(443) |
503 |
1,677 |
1,866 |
Depreciation |
|
(104) |
(111) |
(121) |
(127) |
(120) |
(140) |
(140) |
Amortisation |
(11) |
(21) |
(108) |
(223) |
(698) |
(1,170) |
(1,200) |
|
Operating profit (pre exceptional) |
|
348 |
(894) |
(1,346) |
(793) |
(315) |
367 |
526 |
Exceptionals |
0 |
0 |
0 |
900 |
0 |
0 |
0 |
|
Other |
60 |
1,479 |
2,119 |
51 |
0 |
0 |
0 |
|
Investment revenues |
308 |
276 |
248 |
225 |
293 |
265 |
265 |
|
Profit Before Tax (FRS 3) |
|
716 |
861 |
1,021 |
383 |
(22) |
632 |
791 |
Profit Before Tax (norm) |
|
1,615 |
584 |
(46) |
351 |
707 |
1,287 |
1,485 |
Tax |
(109) |
(196) |
(284) |
(73) |
(47) |
(120) |
(150) |
|
Profit After Tax (FRS 3) |
|
607 |
665 |
737 |
310 |
(69) |
512 |
641 |
Profit After Tax (norm) |
|
1,416 |
555 |
4 |
383 |
626 |
1,043 |
1,203 |
Average Number of Shares Outstanding (m) - exc treasury |
143.5 |
139.2 |
139.3 |
139.4 |
139.8 |
139.8 |
139.8 |
|
EPS - normalised (p) |
|
0.99 |
0.40 |
0.00 |
0.27 |
0.45 |
0.75 |
0.86 |
EPS - FRS3 (p) |
|
0.42 |
0.48 |
0.53 |
0.22 |
(0.05) |
0.37 |
0.46 |
Dividend per share (p) |
0.62 |
0.74 |
0.25 |
0.40 |
0.55 |
0.70 |
0.75 |
|
EBITDA Margin (%) |
3.1% |
(5.4%) |
(7.6%) |
(2.4%) |
2.4% |
7.5% |
8.1% |
|
Normalised operating margin (%) |
8.3% |
2.2% |
(2.0%) |
0.7% |
2.0% |
4.6% |
5.3% |
|
BALANCE SHEET |
||||||||
Fixed Assets (mainly Investments) |
|
9,405 |
8,083 |
8,341 |
9,986 |
12,516 |
11,906 |
11,116 |
Current Assets |
|
21,316 |
19,716 |
23,883 |
35,300 |
26,064 |
28,704 |
30,408 |
Total Assets |
|
30,721 |
27,799 |
32,224 |
45,286 |
38,580 |
40,610 |
41,524 |
Current Liabilities |
|
(8,450) |
(7,681) |
(13,384) |
(25,942) |
(17,671) |
(19,398) |
(20,050) |
Long term Liabilities |
(1,594) |
(1,418) |
(1,096) |
(1,155) |
(1,442) |
(1,442) |
(1,442) |
|
Net Assets |
|
20,677 |
18,700 |
17,744 |
18,189 |
19,467 |
19,770 |
20,032 |
CASH FLOW |
||||||||
Operating Cash Flow |
|
199 |
(2,104) |
492 |
1,147 |
415 |
1,584 |
2,093 |
Net cash from investing activities |
(434) |
1,990 |
483 |
(1,293) |
(1,075) |
(435) |
(285) |
|
Net cash from (used in) financing |
(736) |
(878) |
(1,217) |
(735) |
(886) |
(769) |
(979) |
|
Net Cash Flow |
|
(971) |
(992) |
(242) |
(881) |
(1,546) |
380 |
829 |
Opening net (debt)/cash |
|
13,626 |
12,655 |
11,663 |
11,421 |
10,540 |
8,994 |
9,374 |
Closing net (debt)/cash |
|
12,655 |
11,663 |
11,421 |
10,540 |
8,994 |
9,374 |
10,203 |
Source: Company accounts, Edison Investment Research
|
|
Research: Healthcare
Oncology Venture (OV) has ramped-up R&D with multiple trials moving forward. Its Phase II study of LiPlaCis in metastatic breast cancer (mBC) remains ongoing as it awaits FDA approval of the IDE/IND application, which it expects in H119. In March, OV included the first patient in its expanded LiPlaCis Phase II study investigating prostate cancer. Additionally, its 2X-121 Phase II study in mBC is ongoing and OV plans to initiate its second 2X-121 Phase II trial in ovarian cancer in the near future.