Last close As at 06/08/2026
GBP3.50
— 0.00 (0.00%)
Market capitalisation
—
Research: Investment Companies
Martin Currie Global Portfolio Trust (MNP) has a new lead manager, Zehrid Osmani, formerly a senior portfolio manager and head of European equities research at BlackRock. He describes the trust as ‘the same vehicle with a new engine’, and is very excited about the prospects in his new role. Having introduced new elements to Martin Currie’s investment process, the manager is confident that the trust’s performance can improve, which he hopes will become apparent over the next 24 months. Osmani recognises that the AIC Global sector is a competitive peer group, so he understands that MNP’s performance needs to stand out from the crowd. The trust has a zero discount mechanism and a progressive dividend policy, and currently offers a yield of 1.8%.
Martin Currie Global Portfolio Trust |
Established vehicle with new engine for growth |
Investment trusts |
7 January 2019 |
Share price/discount performance
Three-year performance vs index
Gearing
Analysts
|
|||||||||||||||||||||||||||||||||||||||||||||||||||||||||||||||||||||||||||||||||||||||||||||
Martin Currie Global Portfolio Trust (MNP) has a new lead manager, Zehrid Osmani, formerly a senior portfolio manager and head of European equities research at BlackRock. He describes the trust as ‘the same vehicle with a new engine’, and is very excited about the prospects in his new role. Having introduced new elements to Martin Currie’s investment process, the manager is confident that the trust’s performance can improve, which he hopes will become apparent over the next 24 months. Osmani recognises that the AIC Global sector is a competitive peer group, so he understands that MNP’s performance needs to stand out from the crowd. The trust has a zero discount mechanism and a progressive dividend policy, and currently offers a yield of 1.8%.
12 months ending |
Share price |
NAV |
FTSE World |
FTSE All-Share |
31/12/14 |
11.1 |
9.3 |
11.3 |
1.2 |
31/12/15 |
2.2 |
3.5 |
4.3 |
1.0 |
31/12/16 |
28.7 |
27.1 |
29.6 |
16.8 |
31/12/17 |
11.2 |
12.0 |
13.3 |
13.1 |
31/12/18 |
(3.5) |
(2.8) |
(3.1) |
(9.5) |
Source: Thomson Datastream. Note: All % on a total return basis in pounds sterling.
Investment strategy: Focus on intrinsic value
Osmani and his team seek companies with high and sustainable returns on invested capital (ROIC) that are trading at a discount to their long-term intrinsic values. He has an unconstrained investment approach, with zero exposure to sectors that he believes are unable to deliver long-term value to shareholders. At the heart of the process is in-depth proprietary research and the calculation of valuation targets. MNP is currently ungeared, which has proved beneficial during the stock market weakness in 2018. However, the board and the manager will consider using gearing when they believe it is appropriate.
Market outlook: Volatility bringing opportunities?
Investors enjoyed a particularly benign stock market environment in 2017, but 2018 saw a return to more normal levels of volatility, due to macro concerns – such as the US/China trade dispute, rising US interest rates and Brexit – and their potential impacts on economic growth. So far, corporate earnings have remained relatively robust, so stock market weakness has led to more reasonable company valuations. This may provide an opportunity for investors seeking long-term equity exposure.
Valuation: Regularly trading close to NAV
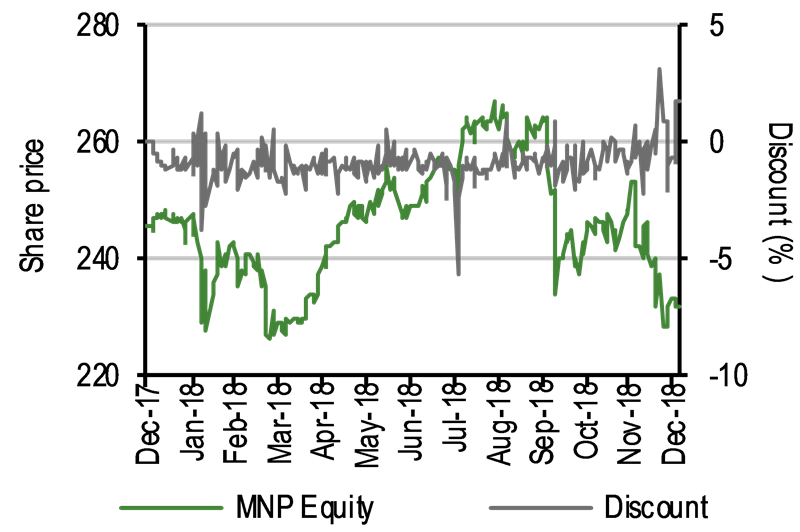
MNP’s shares are currently trading at a 1.7% share price premium to cum-income NAV. This compares to average discounts over the last one, three and five years in a range of 0.6% to 0.9%. The board employs a zero discount policy, ensuring that the trust’s shares regularly trade close to NAV; so far in FY19, 8.1% of its end-FY18 share base has been repurchased (c 7.5m shares at a cost of c £18.5m).
Exhibit 1: Trust at a glance
Investment objective and fund background |
Recent developments |
||||||||||||||||||||||||||||||||||||||||||||||||||||||||||||||||||||||
Martin Currie Global Portfolio Trust’s objective is to achieve long-term capital growth in excess of the capital return of the benchmark FTSE World Index by investing in a diversified portfolio of international quoted investments. The benchmark was changed on 1 June 2011 from the FTSE All-Share Index to the FTSE World Index when the trust adopted a more global focus. |
■ 29 November 2018: Announcement of 0.9p third interim dividend for FY19 (flat year-on-year). ■ 1 October 2018: Zehrid Osmani assumed the role of lead manager. ■ 24 September 2018: Six-month report to 31 July 2018. NAV TR +7.0% versus benchmark TR +6.1%. Share price TR +4.3%. Announcement of 0.9p second interim dividend for FY19 (flat year-on-year). |
||||||||||||||||||||||||||||||||||||||||||||||||||||||||||||||||||||||
Forthcoming |
Capital structure |
Fund details |
|||||||||||||||||||||||||||||||||||||||||||||||||||||||||||||||||||||
AGM |
June 2019 |
Ongoing charges |
0.62% (as at H119) |
Group |
Martin Currie Investment Mgmt (UK) |
||||||||||||||||||||||||||||||||||||||||||||||||||||||||||||||||||
Final results |
April 2019 |
Net cash |
0.7% |
Manager |
Zehrid Osmani |
||||||||||||||||||||||||||||||||||||||||||||||||||||||||||||||||||
Year end |
31 January |
Annual mgmt fee |
0.4% |
Address |
Saltire Court, 20 Castle Terrace, Edinburgh EH1 2ES |
||||||||||||||||||||||||||||||||||||||||||||||||||||||||||||||||||
Dividend paid |
Jul, Oct, Jan, Apr |
Performance fee |
See page 7 |
||||||||||||||||||||||||||||||||||||||||||||||||||||||||||||||||||||
Launch date |
March 1999 |
Trust life |
Indefinite |
Phone |
+44 (0)131 229 5252 |
||||||||||||||||||||||||||||||||||||||||||||||||||||||||||||||||||
Continuation vote |
None |
Loan facilities |
None |
Website |
|||||||||||||||||||||||||||||||||||||||||||||||||||||||||||||||||||
Dividend policy and history (financial years) |
Share buyback policy and history (financial years) |
||||||||||||||||||||||||||||||||||||||||||||||||||||||||||||||||||||||
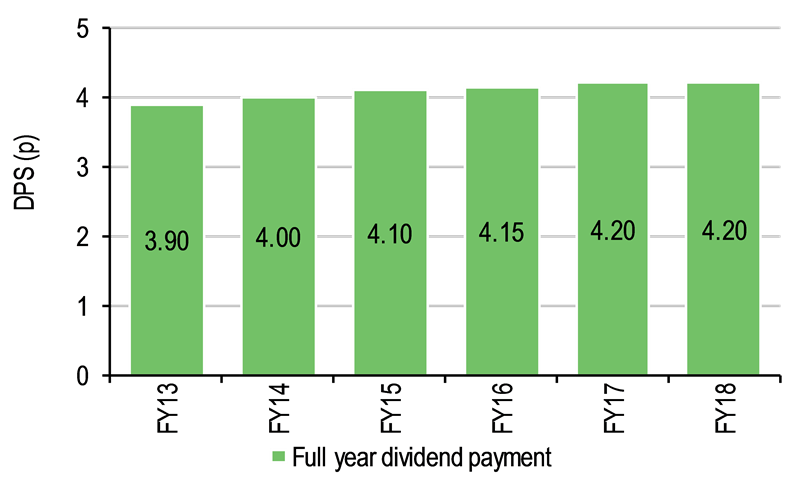
MNP moved to paying quarterly dividends from FY14 (previously semi-annual). Dividends are paid in July, October, January and April. The board is committed to a progressive dividend policy over the longer term. |
Renewed annually, the trust has authority to purchase up to 14.99%, and allot up to 10% of issued share capital. |
||||||||||||||||||||||||||||||||||||||||||||||||||||||||||||||||||||||
|
|
||||||||||||||||||||||||||||||||||||||||||||||||||||||||||||||||||||||
Shareholder base (as at 30 November 2018) |
Portfolio exposure by geography (as at 30 November 2018) |
||||||||||||||||||||||||||||||||||||||||||||||||||||||||||||||||||||||
|
|
||||||||||||||||||||||||||||||||||||||||||||||||||||||||||||||||||||||
Top 10 holdings (as at 30 November 2018) |
|||||||||||||||||||||||||||||||||||||||||||||||||||||||||||||||||||||||
|
|||||||||||||||||||||||||||||||||||||||||||||||||||||||||||||||||||||||
Source: Martin Currie Global Portfolio Trust, Edison Investment Research, Bloomberg, Morningstar. Note: *N/A where not in end-November 2017 top 10.
Recent developments: New manager, sharper process
MNP has a new lead manager; Zehrid Osmani became co-manager on 20 June 2018 (in advance of the retirement of Tom Walker, MNP’s manager since 2000) before moving to the role of lead on 1 October. He is head of Martin Currie’s seven-strong, global long-term unconstrained (GLTU) investment team, and has initiated a series of improvements to the stock selection process. The manager has 21 years of investment experience covering European equities – most recently, 10 years at BlackRock, where he was integral in improving investment performance and developing the research process, which was subsequently successfully rolled out from the European to the other regional teams. His investment philosophy is to have a long-term, high-conviction approach, with low portfolio turnover. While Osmani’s background is in European equities, he is excited about the prospect of researching a broader range of investment opportunities, and the unconstrained approach ensures that the manager does not need to make calls on the direction of the stock market. Osmani says that there is no ‘secret sauce’ in the process; it is straightforward, and aims to deliver above-market total returns on a regular basis. All GLTU investment professionals now have individual sector research responsibility rather than covering the whole market; the manager says that this structure allows broader and deeper research coverage to uncover the best ideas across the globe. He believes this approach will lead to a significant improvement in the trust’s investment performance. There is no change to the core philosophy, which is based on the assumption that proprietary research can identify long-term, value-creating companies that are currently undervalued due to investor overreliance on short-term outcomes. The belief is that, over time, a company’s intrinsic value will be realised. Proprietary screens are used to reduce the investment universe of c 2,800 companies with market caps above $3bn to around c 500 firms that are consistently generating a return on invested capital (ROIC) above their weighted average cost of capital (WACC). These companies are subject to a sustainability checklist, which reduces the number of firms deemed worthy of further fundamental analysis to a pipeline of c 90 stocks. Elements included in the checklist are: industry analysis; a company’s growth drivers, returns and financial strength; its corporate ethos and environmental, social and governance (ESG) track record; and, most importantly, according to the manager, a company’s valuation. Full fundamental analysis includes an investigation of a company’s industry dynamics, its specific risks, and how its inclusion would affect MNP’s overall portfolio. Osmani acknowledges that Martin Currie has a lot of ESG expertise and a history of company engagement, but has ambitions to develop this element of the process even further.
The manager believes that the GLTU team’s proprietary fundamental research will be the key to better investment performance for MNP. In terms of portfolio construction, there is a systematic scoring of the stocks held to ensure conviction levels are expressed; those companies with low scores are subject to further investigation. Osmani says that it is important to realise early when a position is not working, and there is no room in the portfolio for low-conviction stocks. Companies that are under further investigation are put into a ‘hospital unit’ and may be sold, with the capital reinvested into higher-conviction positions, whose size reflects the level of conviction. Each holding has a clear risk and return profile, and a target price.
Osmani has set up a proprietary database to analyse the portfolio.
■
The database shows exposure to three ‘mega themes’ over the next decade: demographic change, the future of technology, and resource scarcity. There are sub-themes within each category to enable the manager and his team to see not only the size of MNP’s exposure, but also where it has no exposure, such as electric vehicles, an area that has multi-decade growth potential, so is considered worthy of further analysis.
■
It assesses MNP’s geographic exposure by revenue, rather than where a company is listed. The manager says that it is important to ascertain the exposure by economic value and highlights the trust’s underweight positioning in emerging markets, which may point to an opportunity to increase the weighting given stock price weakness in these regions.
■
Portfolio companies are plotted on a scatter diagram, which measures earnings growth versus ROIC. MNP’s positions are categorised between companies with high growth and return, more mature firms with high cash flow, steady value creators, and future disruptors. The trust has no exposure to the ‘danger zone’ (low-growth/low-return companies) or to long-term value destroying (ROIC<WACC) stocks.
The manager and his team take a long-term (five-year) approach when valuing a company. They use both a historical perspective and a scenario analysis to reflect the evolution of a company’s returns. Target prices are calculated using a blend of factors: 50% based on discounted cash flow valuation; 25% on excess ROIC versus WACC; and 25% on year five EV/sales, EV/EBITDA and P/E multiples (so 75% is based on a company’s intrinsic value).
Fund profile: Quality, large-cap bias
MNP was launched in March 1999, and aims to generate long-term capital growth in excess of the capital return of the FTSE World index, with lower than average volatility. On 30 June 2018, Zehrid Osmani was appointed as co-portfolio manager alongside Tom Walker; following a three-month transition period he became sole manager on 1 October 2018. Osmani joined Martin Currie in May 2018 (he was formerly a senior portfolio manager and head of European equities research at BlackRock) and is head of its global long-term unconstrained (GLTU) team. MNP holds a diversified portfolio of high-quality, primarily large-cap global equities. It is unconstrained in terms of geography or sector exposure. Gearing of up to 20% of net assets is permitted (but not employed since 2008).
The fund manager: Zehrid Osmani
The manager’s view: Any pullback could provide opportunities
Discussing the macro environment, Osmani comments that Brexit has implications for both UK and European growth, and the US/China trade war is also having a negative impact on global economic activity. He says there has been a long period since the global financial crisis where the economy has been supportive, so at some stage – maybe in the next two to three years – there is likely to be a recession. The manager stresses that the key question is what the shape of the downturn will be – deep and prolonged, or shallow and short (his base case). If he is correct in his assumption, Osmani says that a stock market pullback should provide a great buying opportunity for long-term investors to gain exposure to the next growth cycle. In the near term, the manager argues that the global stock market could be supported if there is a resolution to the US/China trade dispute, and points out that the Chinese authorities are taking steps to ensure there is no hard economic landing in the country. Osmani says that ahead of the next US election campaign, President Trump will require a robust domestic economy and stock market if he has a chance of being re-elected, so his policies will need to be supportive for growth and asset prices. The manager also notes that at the current advanced stage of the economic cycle, merger and acquisition activity tends to accelerate, which could provide further support to the global stock market.
Asset allocation
Investment process: Focus on high and sustainable ROIC
Manager Osmani and the other six members of Martin Currie’s GLTU team (average industry experience of 14 years) are able to draw on the expertise of 49 regional specialists, who together meet more than 1,100 companies each year. The GLTU team’s philosophy is that companies with high and sustainable ROIC generate above-average total returns over the long term. Osmani asserts that focusing only on a company’s earnings does not give the full picture, as it does not reflect how capital is invested. The manager says that high ROIC businesses are sustainable over the long term (which can be underappreciated by investors), require less capital to sustain growth (ensuring more available cash) and deserve higher valuation multiples. Martin Currie places great emphasis on a company’s corporate governance track record, believing that good practice is critical to the sustainability of a business model. Osmani is working to increase MNP’s portfolio concentration to 25-40 positions (41 at end-November 2018), and the trust already has a high active share (currently 91.9%). This is a measure of how a fund differs from its benchmark, with 0% representing full index replication, and 100% showing no commonality. Reflecting the high-quality nature of MNP’s investments, the portfolio’s aggregate P/E is higher than the FTSE World index, it has higher earnings and dividend growth, a higher return on equity and stronger balance sheets.
Current portfolio positioning
Over the last 12 months to end-November, MNP has increased exposure to companies listed in Europe (+8.4pp) and reduced its exposure to the key North American region (-8.0pp), where the trust retains an underweight position (Exhibit 2), and cutting Japan to zero.
Exhibit 2: Portfolio geographic exposure vs FTSE World index (% unless stated)
Portfolio end- |
Portfolio end- |
Change |
Index |
Active weight |
Trust weight/ |
|
North America |
48.2 |
56.3 |
(8.0) |
60.9 |
(12.7) |
0.8 |
Europe (inc UK) |
34.3 |
25.9 |
8.4 |
20.4 |
13.9 |
1.7 |
Emerging markets |
7.0 |
7.5 |
(0.4) |
4.2 |
2.8 |
1.7 |
Asia Pacific ex-Japan |
6.7 |
4.4 |
2.3 |
5.6 |
1.1 |
1.2 |
Israel |
3.6 |
1.9 |
1.7 |
0.2 |
3.4 |
18.1 |
Japan |
0.0 |
4.0 |
(4.0) |
8.7 |
(8.7) |
0.0 |
Total |
100.0 |
100.0 |
100.0 |
Source: Martin Currie Global Portfolio Trust, Edison Investment Research. Note: Adjusted for cash.
In terms of sector exposure, over the last 12 months, the largest increase was in industrials (+11.8pp), MNP’s major overweight position. The largest decrease was in financials (-8.3pp), where the manager favours insurance rather than bank stocks, due to more attractive growth and ROE profiles. The trust has no exposure to the telecom, oil & gas and utilities sectors, as the manager believes they have little ability to create value for long-term investors.
Exhibit 3: Portfolio sector exposure vs FTSE World index (% unless stated)
Portfolio end- |
Portfolio end- |
Change |
Index |
Active weight |
Trust weight/ |
|
Industrials |
25.0 |
13.2 |
11.8 |
12.9 |
12.1 |
1.9 |
Technology |
17.0 |
15.3 |
1.8 |
14.8 |
2.2 |
1.1 |
Consumer goods |
14.1 |
10.3 |
3.8 |
11.3 |
2.8 |
1.2 |
Financials |
13.1 |
21.4 |
(8.3) |
21.1 |
(8.0) |
0.6 |
Healthcare |
12.6 |
12.4 |
0.2 |
12.1 |
0.5 |
1.0 |
Consumer services |
12.1 |
12.7 |
(0.6) |
11.5 |
0.6 |
1.1 |
Basic materials |
6.0 |
3.1 |
3.0 |
4.3 |
1.7 |
1.4 |
Telecommunications |
0.0 |
5.3 |
(5.3) |
2.8 |
(2.8) |
0.0 |
Oil & gas |
0.0 |
4.5 |
(4.5) |
6.0 |
(6.0) |
0.0 |
Utilities |
0.0 |
1.8 |
(1.8) |
3.1 |
(3.1) |
0.0 |
Total |
100.0 |
100.0 |
100.0 |
Source: Martin Currie Global Portfolio Trust, Edison Investment Research. Note: Adjusted for cash.
Osmani has made several new purchases for MNP’s portfolio, including Align Technology, Red Hat and Spirax-Sarco. The manager says that Align Technology, which manufactures dental products, has a strong growth profile (forecast top-line growth of 28% pa and profit growth of 44% pa over the next five years), and an improving ROIC. Osmani had high conviction in the potential upside at US software company Red Hat, and the timing of the purchase was fortunate ahead of a 54% premium cash bid from International Business Machines (IBM). Osmani forecasts 17% pa top-line and 27% pa EBIT growth over the next five years for Red Hat, and it has an ROIC above 40%, which is improving rapidly due to the firm’s low capital intensity. Spirax-Sarco is a British engineering company focused on energy efficiency products. Once again, Osmani believes that this firm has an attractive growth profile and an improving ROIC.
Recent disposals in the portfolio, where Osmani did not have high conviction, include: British American Tobacco; US fashion retailer, L Brands; Facebook, due to regulatory concerns; and ProSeibenSat.1 Media, which was put in the ‘hospital unit’ following a capital markets day.
Performance: Potential for improvement
While MNP’s performance has trailed that of its benchmark over the majority of periods shown in Exhibit 5, over three, five and 10 years, it has generated NAV total returns between 9.4% and 11.7% pa and share price total returns between 9.4% and 12.4% pa. The trust has outperformed the FTSE All-Share index over one, three and five years, illustrating the potential benefits of having a global, rather than a purely domestic focus. Following the appointment of Osmani as new lead manager, the board is confident that MNP’s investment performance can be revitalised.
|
Exhibit 4: Investment trust performance to 31 December 2018 |
|||||||||
Price, NAV and benchmark total return performance, one-year rebased |
Price, NAV and benchmark total return performance (%) |
||||||||
|
|
||||||||
|
Source: Thomson Datastream, Edison Investment Research. Note: Three-, five- and 10-year performance figures annualised. Benchmark changed from FTSE All-Share to FTSE World index on 1 June 2011. |
|||||||||
|
Exhibit 5: Share price and NAV total return performance, relative to indices (%) |
|||||||||
|
One month |
Three months |
Six months |
One year |
Three years |
Five years |
10 years |
||
Price relative to FTSE World |
1.0 |
0.2 |
0.0 |
(0.5) |
(3.0) |
(5.2) |
8.5 |
||
NAV relative to FTSE World |
0.5 |
(0.5) |
(0.4) |
0.3 |
(2.8) |
(5.2) |
1.9 |
||
Price relative to FTSE All-Share |
(2.4) |
(0.6) |
6.3 |
6.6 |
15.5 |
28.3 |
34.9 |
||
NAV relative to FTSE All-Share |
(2.9) |
(1.2) |
5.9 |
7.4 |
15.8 |
28.3 |
26.8 |
||
|
Source: Thomson Datastream, Edison Investment Research. Note: Data to end-December 2018. Geometric calculation. |
|||||||||
|
Exhibit 6: NAV total return performance relative to benchmark over three years |
|||||||||
|
|||||||||
|
Source: Thomson Datastream, Edison Investment Research |
|||||||||
Discount: Zero discount policy
The board has employed a zero discount policy since July 2013, aiming to ensure that MNP’s shares trade close to NAV (in normal market conditions). Renewed annually, the trust has authority to repurchase up to 14.99% of its shares and allot up to 10% of its issued share capital in order to manage a discount or premium. So far in FY19, MNP has repurchased 8.1% of its end-FY18 share base (c 7.5m shares at a cost of c £18.5m). The trust is currently trading at a 1.7% share price premium to cum-income NAV, which compares to a range of a 3.1% premium to a 5.7% discount over the last 12 months. Over the last one, three and five years, MNP’s average discounts are 0.9%, 0.7% and 0.6% respectively, illustrating the effectiveness of the discount control policy.
|
Exhibit 7: Share price premium/discount to NAV (including income) over three years (%) |
|
|
Source: Thomson Datastream, Edison Investment Research |
Capital structure and fees
MNP is a conventional investment trust with one class of share. There are currently 84.9m ordinary shares in issue. Gearing of up to 20% of net assets is permitted, but has not been employed since 2008; at end-November 2018, MNP had a net cash position of 0.7%.
The trust recently revised its fee structure; from 1 February 2018, the annual management fee is 0.4% of NAV (reduced from 0.5%), and its performance fee has been updated. If MNP’s cumulative NAV outperformance versus the capital return of the FTSE World index over the period to 31 January 2020 is greater than 1%, a performance fee of 12.5% of the cumulative outperformance is payable (capped at 1% of net assets), regardless of whether the NAV has risen or fallen over the period. For subsequent periods, the performance period runs from 1 February following the last financial year-end when a performance fee was paid to the end of the current financial year. In FY18, MNP’s ongoing charges were 0.68%, which was 6bp lower than a year earlier, and 7bp below the board’s 0.75% target. In H119, ongoing charges were 0.62% (6bp lower year-on-year, but this excludes a 17bp performance fee accrual – none was accrued in H118).
Dividend policy and record
MNP pays quarterly dividends, in July, October, January and April. Annual distributions have increased or been maintained every year since the trust was launched in 1999, compounding at 6.4% pa over the whole period. In FY18, the 4.2p dividend was in line with FY17, and was 0.9x covered by revenue. So far in FY19, three interim dividends of 0.9p have been paid/declared (flat year-on-year). MNP’s current dividend yield of 1.8% ranks favourably compared with the majority of its peers (Exhibit 8).
Peer group comparison
Exhibit 8 shows the 10 trusts in the AIC Global sector that have more than 30% North American exposure and less than 30% invested in the UK. MNP’s NAV total return is above average over one year, and below over the other periods shown (the rankings over most periods shown have improved since our last published note in June 2018). The manager comments that the trust has lower total return volatility than the average of its peers, and has not enjoyed the benefits of gearing in periods of rising stock markets, which have characterised the majority of the last decade. MNP’s zero discount policy ensures that its shares regularly trade close to NAV. The trust’s ongoing charge is in line with the average, and it is the only trust in the selected peer group to charge a performance fee. MNP has an above-average dividend yield that is 40bp higher than the mean.
Exhibit 8: Selected peer group as at 4 January 2019*
% unless stated |
Market |
NAV TR |
NAV TR |
NAV TR |
NAV TR |
Discount |
Ongoing |
Perf. |
Net |
Dividend |
Martin Currie Global Portfolio |
196.9 |
(5.8) |
36.2 |
54.6 |
193.3 |
2.2 |
0.6 |
Yes |
100 |
1.8 |
Alliance Trust |
2,324.3 |
(7.5) |
37.2 |
57.1 |
164.5 |
(5.0) |
0.6 |
No |
106 |
1.9 |
Bankers |
971.0 |
(8.6) |
35.9 |
53.8 |
185.1 |
(0.4) |
0.4 |
No |
103 |
2.5 |
BMO Global Smaller Cos |
755.3 |
(8.3) |
31.8 |
55.5 |
298.1 |
0.7 |
0.6 |
No |
105 |
1.2 |
Brunner |
301.0 |
(11.6) |
27.5 |
36.3 |
152.0 |
(7.2) |
0.7 |
No |
106 |
2.6 |
Edinburgh Worldwide |
414.4 |
(2.2) |
48.7 |
71.2 |
312.6 |
(2.9) |
0.8 |
No |
110 |
0.5 |
F&C Investment Trust |
3,503.1 |
(4.5) |
39.3 |
64.6 |
192.3 |
2.1 |
0.5 |
No |
108 |
1.7 |
Mid Wynd Int’l Inv Trust |
181.4 |
(6.4) |
37.1 |
67.0 |
229.4 |
4.4 |
0.7 |
No |
100 |
1.2 |
Monks |
1,628.2 |
(8.4) |
49.7 |
64.2 |
199.7 |
5.8 |
0.5 |
No |
106 |
0.2 |
Scottish Mortgage |
6,697.1 |
(1.7) |
63.5 |
119.5 |
466.3 |
4.6 |
0.4 |
No |
108 |
0.7 |
Average (10 trusts) |
1,697.3 |
(6.5) |
40.7 |
64.4 |
239.3 |
0.4 |
0.6 |
105 |
1.4 |
|
MNP rank in peer group |
9 |
4 |
7 |
8 |
6 |
4 |
5 |
9 |
4 |
Source: Morningstar, Edison Investment Research. Note: *Performance data to 3 January 2019 based on ex-par NAV. TR = total return. Net gearing is total assets less cash and equivalents as a percentage of net assets (100 = ungeared).
The board
MNP’s board is made up of five independent, non-executive directors. The chairman is Neil Gaskell, who joined the board in November 2011 and assumed his current role in May 2012. Mike Balfour is the senior independent director and was appointed to the board in January 2010. The other three directors are: Gillian Watson (appointed in April 2013), Marian Glen and Gary Le Sueur (both appointed in December 2016).
|
|
Research: Investment Companies
Fidelity Special Values (FSV) aims to achieve long-term capital growth from a special situations portfolio of primarily UK equities. The manager has a contrarian approach, looking for unloved stocks and opportunities created by share price volatility and market uncertainty. Although market volatility has been unhelpful to shorter-term performance, FSV’s NAV total return has outperformed its benchmark FTSE All-Share index over three, five and 10 years. While seeing broadly negative sentiment towards UK equities, FSV’s manager is increasingly positive on the UK stock market outlook, irrespective of the outcome of Brexit negotiations, and has been adding to portfolio holdings by increasing FSV’s net gearing.