Focus on tertiary recovery of oil from life-expired fields
ELK is targeting a niche area in oil production that targets the tertiary recovery of oil. The technology facilitates the acquisition of mature or life-expired oil fields, for which there are few alternative buyers. As these oil fields have already been defined, development can be very systematic, without the need for extensive further exploration.
Significant value add from Grieve and future projects
ELK expects to commence production from the Grieve CO2 EOR project, where it is in a JV with DNR, in late 2017. ELK is in the final stages of raising debt finance to fund completion of the project. An equity raising is expected to follow. ELK also recently acquired assets in the DJ Basin in Nebraska, for a second CO2 EOR project. ELK has also identified a number of mature oil fields in the vicinity of Grieve that can likely be developed as satellite developments and benefit from the substantial infrastructure, power, water, CO2 supply already developed as part of the Grieve project.
We have carried out NPV10 valuations (Exhibit 10) for ELK’s share of Grieve for three different development scenarios that relate to different recovery efficiencies, oil recovery and production profiles. We have applied a book value for the early-stage DJ assets. Our valuation takes into account an assumed US$15-20m equity raising over a range of share prices and issued shares.
Under our base case, Case 1, we value ELK in a range of A$0.13-0.21/share. In Case 2, where a higher recovery efficiency is assumed, the range is A$0.18-0.29/share. For Case 3, where a greater quantity of CO2 is injected, the valuation range is A$0.20-0.33/share.
Debt/equity mix for project completion, rapid payback
The Grieve CO2 EOR project is 75% complete. ELK is advanced in negotiations for a US$55m debt package to fund project completion as part of a fixed-price turnkey commitment from its JV partner DNR. An associated equity raising is assumed. DNR has developed c 25 CO2 EOR projects in the US, c 20% of the US total. Average DNR CY 2015 output was 41,602 BOPD with >164mmbbl oil reserves developed. DNR is operator of the Grieve project, which, in our opinion, is very bankable.
Grieve cash flow is expected to be very strong due to favourable CO2 supply arrangements with DNR and low sustaining capital requirements. Using Edison’s oil price forecasts, we estimate ELK’s Grieve-related debt could be repaid in less than four years from the start of production.
Significant sensitivities are oil price and recovery efficiency
ELK earnings, cash flow and metrics related to the number of issued shares are sensitive to:
■
oil prices: operating revenue and royalty costs are oil price related. The production strategy may also be influenced, eg the viability of additional CO2 purchases to increase oil recovery;
■
exchange rates: revenue and costs are US dollar based. ELK’s accounts are A$ based;
■
recovery efficiency: defined as the CO2 required, in mcf, to recover 1bbl of oil. Recovery efficiency has the potential to vary – up or down – from that expected;
■
CO2 cost: CO2 purchase can be a major cost item. ELK has advantageous CO2 supply arrangements for its share of the Grieve project;
■
CO2 availability: needs to be constantly and reliably available. Can be sourced as a by-product of natural gas production or from industrial processes such as ethanol production;
■
transport and refining: availability of oil pipelines for transport and local refinery capacity; and
■
issued shares and dilution: sensitive to the share price and extent of equity issues.
Specialist EOR company with global ambitions
ELK is the only ASX-listed enhanced oil recovery (EOR) company. It is currently developing CO2 EOR projects in the US. Once the cash flow-generating platform of its US activities is established, ELK may seek global opportunities to apply its expertise in EOR technology.
Scalable and repeatable redevelopment of mature projects
ELK is focused on EOR techniques using CO2 injection to achieve tertiary recovery of oil from existing projects where primary and secondary recovery has already been achieved. EOR techniques can lift oil recovery by 10-20% of a field’s original oil in place (OOIP). The technique requires the ready availability of CO2, as an oil industry by-product or from industrial sources.
EOR projects are developed on an existing conventional oil extraction footprint. Additional exploration is small, with most of the oil development already well defined. In the most suitable CO2 project candidates, many of the existing historical production wells can be used either as oil production wells or converted into CO2 injection wells at relatively low capital costs. While upfront capital is required for an EOR project, operating costs can be low and sustaining capital minimal.
The process is readily scalable and repeatable. Projects are redevelopments of existing projects rather than projects that are dependent on lengthy exploration. While ELK’s existing activities are in the US, the technology can be applied to areas outside the US where applications of this technology are limited. These areas include Australia, Indonesia and Malaysia.
Strategy for growth and value creation
ELK believes there is a strong market opportunity for pursuing growth in EOR globally. Its interest in Grieve provides a platform for cost-effectively acquiring mature projects, suitable for EOR, which may be marginal in the current low oil price environment. With minimal exploration required and potential low acquisition costs, these projects have resources that are ready to be developed.
In 2014, ELK acquired the Singleton oil field in Nebraska and followed through in 2015 with the acquisition, from Devon Energy, of properties located immediately adjacent and contiguous to the Singleton oil field. They are located in the north-east part of the prolific DJ Basin. These will be developed as an EOR project in line with the strategy to grow the EOR business.
ELK has been focused on EOR for 10 years, with a track record of CO2 EOR field screening, selection and development, plus experience of water, chemical and thermal flood techniques.
At Grieve, ELK is in a JV with DNR, which is a recognised leader in CO2 EOR field redevelopment and operations. ELK is working closely with DNR at Grieve.
The MD and CEO of ELK, Brad Lingo, is a former MD and CEO of Drillsearch Energy (DLS), where he oversaw an eightfold increase in the share price, a 15-fold increase in market capitalisation, production from 12 new fields and 29 new conventional discoveries. He is also a former CEO of Sunshine Gas and has also worked for Tenneco Energy and El Paso Corporation.
The COO, David Evans, has 29 years of global oil and gas experience, including EOR projects. The CFO, Alexander Hunter, has particular expertise in mergers and acquisitions and capital raisings. He has over 10 years’ experience in the resources sector.
The president of Elk Petroleum USA, Scott Hornafius, has spent 16 years in various technical and management roles with Mobil in the US, Papua New Guinea and the UK. He founded MegaEnergy in 2000 and developed a 100,000-acre position over the Marcellus shale gas play in Appalachian Basin, where asset divestments and farm-out agreements realised US$100m.
Enhanced oil recovery (EOR)
EOR is a tertiary recovery method to target the substantial residual oil remaining in the reservoir after the primary and secondary recovery phases of the field.
Incremental recoveries of 10-20% using EOR
EOR can achieve incremental recoveries of between 10% and 20% of OOIP depending on the characteristics of each individual reservoir (Exhibit 1). EOR currently accounts for c 3% of global crude oil production and is dominated by production from the US. This is expected to grow to around 9% by 2030.
By way of comparison, the primary and secondary phases of oil extraction recover only 20-40% of OOIP. This compares with 80-90% recoveries in gas reservoirs.
Exhibit 1: Typical oil recovery in the various extraction phases
|

|
|
|
Mechanisms for oil recovery: EOR is the tertiary phase
During the various phases of oil recovery, there are several mechanisms:
■
Primary recovery: the natural energy stored in the reservoir is used as a drive mechanism for production.
■
Secondary recovery: energy is added to the reservoir by injecting fluids such as water or gas to help support the reservoir as production takes place.
■
Tertiary recovery: the EOR technique is a process in which the physical and chemical properties of the reservoir fluids are changed. This enhances the recovery of hydrocarbons from the reservoir.
EOR methods: Several alternatives for tertiary recovery
There are three distinct EOR methods used in the industry:
■
Gas injection: this is the oldest EOR method and uses gases such as natural gas, nitrogen or carbon dioxide (CO2). These gases expand in a reservoir to push additional oil to a production wellbore, and dissolve in the oil to lower its viscosity and improve its flow rate. Gas injection accounts for nearly 60% of EOR production in the US, with CO2 the most commonly used gas.
■
Thermal recovery: this involves the introduction of heat such as the injection of steam to lower the viscosity of heavy viscous oil to improve its ability to flow through the reservoir. Thermal techniques account for more than 40% of US EOR production, primarily in California.
■
Chemical flood: this involves the use of polymers to increase the effectiveness of waterfloods, or the use of detergent-like surfactants to help lower the surface tension that often prevents oil droplets from moving through a reservoir. Chemical techniques account for about 1% of US EOR production and have been hampered by their relatively high cost and, in some cases, by the unpredictability of their effectiveness.
Proven technology, more than 120 CO2 EOR projects in the US
CO2 EOR is a proven technology that has been used for more than 40 years in the US, and now accounts for almost 60% of EOR production there. The technique was originally developed in the Permian Basin in Texas and into New Mexico, where activity grew rapidly in the 1970s and1980s due to the presence of suitable reservoirs and a readily available supply of CO2.
There are more than 120 successful CO2 EOR projects in the US, across multiple basins. They account for approximately 6% of US oil production. In statistics published by the Oil and Gas Journal (April 7, 2014), only 7 CO2 EOR projects in the US (approximately 5% of projects) have had disappointing results. We understand these were all in West Texas and hosted in fractured carbonate reservoirs, which allowed the CO2 to escape. All the CO2 EOR projects in Wyoming, which are hosted in sandstone, have been successful.
Operating mechanics of CO2 EOR
During a CO2 flood, CO2 is injected into the reservoir where, under the correct conditions, it will mix with the residual oil to become a single phase, ie, it becomes miscible. This allows the CO2 to displace the oil from the rock. As the CO2 dissolves in the oil, it swells the oil and reduces its viscosity. This improves the efficiency of the displacement process. The oil forms an oil bank, which is then swept towards the producing wells. Once recovered at surface, the produced fluids are separated, with the CO2 separated from the produced gas stream, recompressed and reinjected.
For maximum process effectiveness, it is important that the reservoir pressure is maintained above the minimum pressure at which the CO2 will remain miscible with the oil. This pressure is known as the minimum miscibility pressure (MMP). For this reason, reservoirs selected for CO2 EOR tend to be deeper than 900m, as the temperature and pressure at depth foster CO2 miscibility.
Exhibit 2: The EOR process
|

|
|
|
Grieve, ELK’s main project, is being developed with EOR technology using CO2 flood injection. The project is located 80km west of Casper, Wyoming in the US and within the Rocky Mountains (Exhibit 3). This area has a proven EOR production fairway with ready access to a CO2 supply. It is seen as a key growth area for the technology.
Exhibit 3: Location of Grieve project
|

|
|
|
Ownership and indicative terms of LOI
The ownership of the Grieve CO2 EOR Project JV was restructured in December 2015. ELK and its JV partner DNR entered into a non-binding letter of intent (LOI) (deadline extended to 31 May, 2016) outlining the basis for project completion, including funding and revised beneficial interests in oil reserves, resources and cash flows. Under the restructuring, certain prior claims including legal claims and prior JV funding provisions have been released through ELK funding the completion of the project. After formal agreements relating to the project restructuring have been signed, debt relating to ELK’s share of JV costs incurred (A$20.9m at 31 December 2015), will be eliminated. Subject to the execution of definitive agreements between ELK and DNR, indicative terms are:
■
Working interest: ELK is to increase its working interest from 35% to 49%. DNR is to remain operator with a 51% working interest.
■
Cash flow entitlements: ELK will receive a net cash flow share greater than its working interest for the first 2mmbbl production, then revert to its working interest share. For the first 1mmbbl and next 1mmbbl, it will receive 75% and 65% of net operating cash flow respectively.
■
Funding of completion cost: ELK is to solely fund a fixed amount of US$55m, which is the estimated cost for the completion of the Grieve project.
■
Turnkey commitment for project completion: DNR is to complete the development of the Grieve project and commence oil production by 1 September 2017. The completion date provides time for the JV to implement the restructure and for ELK to secure the US$55m of funding. DNR is to provide a fixed-price turnkey commitment at a development cost that will not exceed US$55m. DNR is to cover cost overruns, if applicable.
■
CO2 provision: DNR is to provide up to 59 billion cubic feet (bcf) of CO2 required for first oil production at no additional cost to ELK. Arrangements have been made such that DNR will supply Grieve’s CO2 requirements for the remaining life of the project on favourable terms.
■
Grieve pipeline haulage: all oil production will be shipped via ELK’s 100%-owned and operated Grieve oil pipeline. ELK will charge the Grieve JV a US$3.00/bbl haulage charge and will be effectively reimbursed for its share of oil transported after subtraction of a 6.8% royalty.
ELK has received preliminary binding offers and expressions of interest from various sources, principally forms of senior and mezzanine debt, for more than U$50m to fund the completion of the Grieve project. ELK also anticipates raising additional equity.
Grieve project development
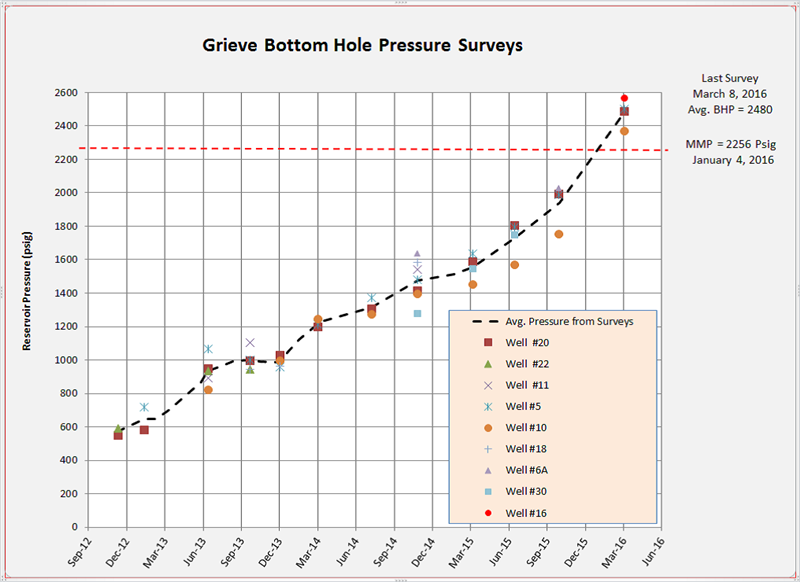
The reservoir pressure had been depleted to under 600psi by historical production. Work has continued on the redevelopment of the field, with the necessity to repressurise the reservoir with CO2 injection supplemented by water injection. By April 2016, field pressure through CO2 and water injection reached the MMP of 2,256 PSI with field pressure reaching over 2,480 PSI.
Approximately 70% of capital expenditure has already been spent. Work completed includes:
■
new injection and production wells;
■
in-field CO2/water injection and oil production flow lines;
■
power supply from local grid installed;
■
site works and production manifold;
■
three-mile CO2 supply line; and
■
crude oil export pipeline upgrade.
Outstanding items, at a completion cost of US$55m, are:
■
completion of the oil processing and CO2 recompression facilities (approximately US$37m) using a standard DNR/Jacobs design. Construction is scheduled to commence in mid 2016;
■
in-field flowlines (US$2.7m);
■
well workovers (US$5.7m); and
■
lease operating expenses (US$9.6m).
Sourcing and pricing of CO2
CO2 is frequently sourced from existing natural fields with high CO2 contents (as for Grieve) or from man-made sources such as natural gas processing, ammonia, ethanol, fertiliser and power plants. In 2012, 62mt of CO2 was supplied to US operations with 15% from industrial sources.
The market price of CO2 is linked to the oil price at 1.3-2.5% of the WTI price. Hence, the CO2 component of costs would vary from US$2/bbl to US$11/bbl, depending on the CO2 flood efficiency.
Individual supply deals can be negotiated. DNR is supplying CO2 to Grieve at no cost to ELK during the pre-production ‘capital’ phase and at a reduced cost for the remaining life of the project.
Oil production using CO2 EOR stores more CO2 than is produced. For the Grieve project, approximately 59bcf CO2 is required for first production. Thereafter, the CO2 is recycled but some top-up is required. Once tertiary oil recovery is complete, the CO2 remains underground. Currently, CO2 EOR is believed to be the only profitable carbon capture and storage process that does not require a subsidy. If the carbon cost is priced, the economics of CO2 EOR are enhanced.
Grieve crude oil export pipeline
There is an existing c 55km oil pipeline from the Grieve project to Casper. This is 100% owned and operated by ELK. Use of the pipeline is currently suspended. Remedial works costing around US$2.5m are required, which includes the reconnection of the pipeline to the local oil haulage network. Commissioning works are scheduled for the first half of CY17.
The pipeline will enable Grieve production to be directly shipped to the Casper refinery. ELK is involved with ongoing discussions with prospective third parties, both other shippers and potential pipeline purchasers, with a view to generating haulage revenue from other oil producers (which may be currently trucking) or the sale of the pipeline.
The restructuring of the Grieve JV increased ELK’s share of the project’s 2P oil reserves by 51% and its share of 3P reserves and resources by 49%. The reserves shown in Exhibit 4 are after accounting for federal and state royalties.
Exhibit 4: ELK share of Grieve oil reserves and resources after JV restructure
|
Reserves |
Resources* |
|
2P |
3P |
3C |
Grieve (mmbbl) |
5,251 |
6,900 |
7,110 |
Source: Elk Petroleum. Note: *Grieve contingent resources 3C values represent 2P reserves plus incremental resources captured from additional CO2.
In addition to production from existing reserves and resources, there is potential for the acquisition of satellite resources within a working radius (approximately 15-20km) of the Grieve processing facilities. These may be current or former resources where only primary production has taken place.
Reservoir characteristics and gas injection
ELK believes the Grieve reservoir has suitable properties for EOR. It exhibits homogeneous qualities and has good permeability of 220md, which is expected to allow for good sweep efficiency. In addition the oil in Grieve is a light 37° API, which is beneficial as CO2 will dissolve more readily in oil that contains a significant proportion of lighter hydrocarbons. The MMP at Grieve is estimated to be 2,256psi. In early April 2016, ELK reported that MMP had been achieved.
CO2 injection commenced in March 2013 and approximately 30bcf CO2 has been injected to date at a rate of 50-60mmcfd. CO2 injection was supplemented by water injection to reach the MMP. ELK has been monitoring the subsequent pressure increase in the reservoir with pressure surveys. Repressurisation of the field is ahead of schedule. It should reach the 3000-3,100psi required for the reservoir to flow in 2017, with first oil scheduled for September 2017 (Exhibit 5).
Exhibit 5: Projected pressure to first oil
|
|
|
|
Production optimisation: Multi-layer simulation model
ELK has developed a multi-layer dynamic reservoir simulation model that identifies oil location and how gas, water and oil contacts have changed over time. There have been around 30 simulations of reservoir behaviour to optimise the sweep of oil relative to costs to maximise the project NPV.
Compared to a model of primary production, an EOR model has access to a much more detailed database about the field with regard to the performance of individual reservoirs, and allows optimisation of the location of injector and producer wells. The pattern and spacing of the injector and producer wells can influence the efficiency of a flood.
The configurations of existing and new wells at Grieve and their function are shown in Exhibit 6.
Production control system: Flexibility, can be dynamic
All the wells in the field have been worked over and tied back to the central manifold. Each well can be operated remotely from the production control room. The operator has the flexibility to change from CO2 or a water injection well to a production well or vice versa. If a well configuration is not fully sweeping, adjacent wells can be rapidly converted to injectors. The objective is to obtain the desired flow rate and maintain efficiency of CO2 use. The well control system can be very dynamic.
The production control system also has the capability to respond to changes in oil prices by adjusting the production strategy.
The CO2 is supplied from a dedicated CO2 pipeline supply pipeline network that traverses the State of Wyoming. The CO2 from this pipeline is in a very clean form containing very little impurities or water. As CO2 is recycled through the Grieve oil field, the CO2 is continually recycled and reconditioned to maintain this low level of impurity. This ensures that the CO2 maintains its effective sweeping characteristics and minimises the scope for corrosion of equipment.
Exhibit 6: Well configurations at Grieve
|

|
|
|
Stratigraphical trap: Efficient concentrated injection front
At Grieve, a 15-degree regional dip to the north-east created the oil trapping structure over a small geographical area. When CO2 is injected into this structure, it creates a very efficient injection front within the reservoir. This is more efficient than in a gentle sloping structure where the energy of the CO2 is widely distributed.
Capital and operating cost characteristics of EOR projects
EOR projects generally have relatively high upfront capital costs, low sustaining capital and moderate operating costs. For ELK specifically, it has a major capital cost advantage because of its preferential CO2 supply arrangements and the fact that most of the processing plant has already been built. Its capital cost is restricted to the US$55m turnkey contract for completing the plant.
■
Initial capital costs: the initial costs of establishing an EOR project can be significant. Major capital expenditure is required for:
•
the cost of the purchased CO2 to get to the flood state; and
•
the capital cost of the plant for separation, recapture and reinjection.
■
Sustaining capital costs: these are generally very low because:
•
there is very little forward capital requirement and no new facilities to build;
•
well workover expenses are frequently treated as a lease operating expense; and
•
no new wells are required.
■
Operating costs: the main cost drivers are CO2 recycling costs and CO2 purchase costs:
•
the recycling of CO2 back into the reservoir while maintaining gas pressure in a closed system. The main recycling cost is electricity for compression. Operating costs are a function of both volume and time. The actual flow rate is low. Assuming the reservoir performs well, the annual cost for recycling tends to be fairly fixed with limited variability;
•
over time, the CO2 purchase cost declines with the pressure maintained at a steady state; and
•
other operating costs include water injection, crude processing and water handling, workovers, maintenance, the direct field operators and supervision overhead.
EOR ‘tertiary recovery’ projects have quite different characteristics from conventional ‘primary and secondary recovery’ projects. They have some of the characteristics of a manufacturing process and can be attractive in a low oil price environment.
■
Oil quantity is known. There is no need for further exploration.
■
Gas/water control requirements are already known.
■
The best production wells have been identified. There is no need to drill additional wells.
■
There is enough existing information for reservoir engineers to model planned production.
■
The specific risks of EOR include differences or variability in recovery efficiency and sweep efficiency against expectations.
The Denver-Julesburg (DJ) Basin
ELK aims to develop its second EOR hub in the DJ Basin, Banner County, Nebraska. The DJ Basin has over 1,000 oil fields in Colorado and Nebraska, with more than 52,000 wells drilled. Most fields are nearing the end of secondary recovery efforts. In the absence of EOR, these fields will be abandoned. ELK’s Singleton and Devon properties are located in the north-east area of the basin.
In 2014, ELK acquired the Singleton Oil Field in Banner County, Nebraska, with the intention of developing a CO2 EOR project.
In late 2015, ELK acquired a 100% working interest in oil properties immediately adjacent and contiguous to the Singleton oil field from Devon Energy (DVN:NYSE). The acquisition included all of DVN’s oil and gas leasehold interests in Banner County, covering 9,738 gross acres (5,987 net acres). It also included two exploration wells, both of which have completed as oil producers – one vertical well, Opis 1P and one horizontal well, Opis 1H.
The acquisition also included all of the oil production, processing facilities, storage and oil truck load-out equipment. ELK’s acquisition cost was US$100,000. ELK estimates the total investment in the acquired properties is well in excess of US$5m. It believes the newly installed production facilities at the Opis 1H production well are well situated to support the Singleton EOR project.
Exhibit 7: ELK oil reserves and resources in DJ Basin (mbbls net of royalties)
|
|
1P reserves |
2P reserves |
|
2C resources |
3C resources |
Singleton |
|
|
|
|
3,000 |
4,000 |
New leases (ex Devon) |
|
54 |
78 |
|
1,512 |
2,510 |
Total |
|
54 |
78 |
|
4,512 |
6,510 |
Development scenario to capitalise on synergies
The Singleton and DVN acquisitions offer substantial synergies for the development of the overall Singleton oil field and associated CO2 EOR project. Total combined reserves and resources are tabulated in Exhibit 7.
Both the Opis wells provide near-term production opportunities. A possible development scenario is as follows:
■
Commencement of conventional oil production from the existing Opis 1H well from the original production interval in the Mississippi Limestone.
■
Recomplete the Opis 1P well in the J3 sand.
■
Repressure the Singleton oil field as the initial phase of the CO2 EOR project in the J1 and J2 sands of the Muddy Foundation. This is the same formation and sands that are being redeveloped at Grieve. Produced water from the Opis 1P and 1H wells will provide the water production necessary for repressuring the Singleton oil field.
■
ELK believes that there is further oil contained in the J3 sands at the acquired Devon properties, to the south of Singleton. The much larger unexploited pool in the J3 sand can provide additional initial production while the CO2 flooding phase at Singleton is progressing.
Our base valuation case (Case 1) is derived from ELK’s share of the development and recovery of oil from Grieve 2P reserves (12.2mmbl).
We have also valued two alternative scenarios for oil recovery from Grieve 3P probable and possible reserves (16.3mmbl) (Case 2) and Grieve 3C contingent resources (16.2mmbl) (Case 3).
Oil recovery scenarios and CO2 purchased for injection are tabulated in Exhibit 8.
Exhibit 8: Oil recovery scenarios for Grieve
Case |
Type |
mmbbl |
CO2 purchased (bcf) |
CO2 recycled (bcf) |
1 |
Pressler 2P probable reserves |
12.2 |
82 |
335.4 |
2 |
Pressler 3P probable and possible |
16.3 |
74.3 |
316.2 |
3 |
Pressler 3C contingent resources |
16.2 |
92.6 |
324.6 |
A key factor that influences each valuation is the recovery efficiency. This determines the quantity of oil recovered, the volume of CO2 that needs to be purchased and injected to achieve that recovery, and the oil production profile. Recovery efficiency is defined as the CO2 required, in mcf, to recover one barrel of oil.
Grieve is expected to have a recovery efficiency of 7-9mcf/bbl. By way of comparison, a recovery efficiency of around 5mcf/bbl is considered to be very efficient. In contrast, a recovery efficiency of 15mcf/bbl is considered to be inefficient. Midrange is 10mcf/bbl.
■
Case 1 – 2P reserve: this is the base scenario.
■
Case 2 – 3P probable and possible reserves: in this scenario, reservoir characteristics are assumed to be more favourable and a higher recovery efficiency is achieved. A lower quantity of CO2 achieves a higher oil recovery.
■
Case 3 – 3C contingent resources: the recovery efficiency is the same as for the 2P reserve scenario. At our assumed oil prices, it is economic to inject a greater quantity of CO2 to recover more oil. A decision would probably be made to adopt this strategy.
When scheduling oil production in an EOR system, one of the objectives is to manage production so as to maximise the NPV. This can involve managing CO2 purchases and injection depending on the recovery efficiency being achieved, overall costs and oil prices. Some flexibility is possible.
■
The production profile is brought forward in both Case 2 and Case 3, relative to Case 1, bringing forward oil revenue.
■
The total quantity of oil recovered in both Case 2 and 3 is also higher, meaning an absolute higher level of production than in Case 1.
The physical characteristics of the reservoir may be different from those assumed or may exhibit some variability. CO2 purchase requirements could vary from those assumed in Exhibit 8.
We model the cash flows from the Grieve project for each case to derive an NPV10 valuation. Wyoming oil prices generally trade at a 7% discount to WTI. We use Edison’s forecasts for WTI oil prices and then apply this discount for our earnings and cash flow forecasts and valuations.
Exhibit 9: Edison WTI oil price forecasts
|
2016 |
2017 |
2018 |
2019 |
2020 |
2021 |
2022 |
2023 |
Oil price (US$/bbl) |
40 |
50 |
63 |
77 |
79 |
81 |
83 |
85 |
Source: Edison Investment Research
Our valuations (Exhibit 10) assume zero net debt following the signing of formal agreements related to project restructuring and the notional impact of a possible future equity raising (we assume US$20m) to supplement subsequent debt financing for the project. For the purpose of our valuations, we factor in a range of possible share issue prices to determine potential increases in the number of issued shares. These valuations are sensitive to recovery efficiencies, which may vary, up or down.
Exhibit 10: ELK valuations under various Grieve and notional capital raising scenarios
|
Case 1 |
|
|
|
|
|
Case 2 |
|
|
|
|
|
Case 3 |
|
|
|
|
Grieve NPV (US$m) |
65.7 |
|
|
|
|
|
100.8 |
|
|
|
|
|
116.4 |
|
|
|
|
Grieve NPV (A$m) |
87.6 |
|
|
|
|
|
134.4 |
|
|
|
|
|
155.2 |
|
|
|
|
Singleton (book value) (A$m) |
3.3 |
|
|
|
|
|
3.3 |
|
|
|
|
|
3.3 |
|
|
|
|
Subtotal |
90.9 |
|
|
|
|
|
137.7 |
|
|
|
|
|
158.5 |
|
|
|
|
Net debt before raising (A$m) |
0.0 |
|
|
|
|
|
0.0 |
|
|
|
|
|
0.0 |
|
|
|
|
Capital raising (US$$m) |
20.0 |
|
|
|
|
|
20.0 |
|
|
|
|
|
20.0 |
|
|
|
|
Capital raising (A$m) |
26.7 |
|
|
|
|
|
26.7 |
|
|
|
|
|
26.7 |
|
|
|
|
Net debt/(cash) after issue (A$m) |
(26.7) |
|
|
|
|
|
(26.7) |
|
|
|
|
|
(26.7) |
|
|
|
|
ELK valuation (A$m) |
117.6 |
|
|
|
|
|
164.4 |
|
|
|
|
|
185.2 |
|
|
|
|
Issue share price (A$m) |
0.050 |
0.075 |
0.100 |
0.125 |
0.150 |
|
0.050 |
0.075 |
0.100 |
0.125 |
0.150 |
|
0.050 |
0.075 |
0.100 |
0.125 |
0.150 |
Shares issued (m) |
533.3 |
355.6 |
266.7 |
213.3 |
177.8 |
|
533.3 |
355.6 |
266.7 |
213.3 |
177.8 |
|
533.3 |
355.6 |
266.7 |
213.3 |
177.8 |
Current plus new shares (m) |
917.5 |
739.7 |
650.8 |
597.5 |
561.9 |
|
917.5 |
739.7 |
650.8 |
597.5 |
561.9 |
|
917.5 |
739.7 |
650.8 |
597.5 |
561.9 |
ELK valuation (A$/share) |
0.13 |
0.16 |
0.18 |
0.20 |
0.21 |
|
0.18 |
0.22 |
0.25 |
0.28 |
0.29 |
|
0.20 |
0.25 |
0.28 |
0.31 |
0.33 |
Current issued shares (m) |
384.1 |
|
|
|
|
|
|
|
|
|
|
|
|
|
|
|
|
A$/US$ |
0.75 |
|
|
|
|
|
|
|
|
|
|
|
|
|
|
|
|
Source: Edison Investment Research
ELK’s objective is to negotiate US$55m debt funding to complete the Grieve project. In the event of a lower or higher level of debt funding, we have carried out a sensitivity analysis (Exhibit 11) for various combinations of debt and equity for Case 1 at a notional share price of A$0.075.
ELK may also elect to raise higher levels of equity. Our sensitivity analysis is extended to include a range of possible equity raisings at the same notional share price of A$0.075.
Exhibit 11: Sensitivity of Case 1 ELK valuations to changes in total funds raised at different debt/equity ratios
Constant share price A$0.075 |
Total debt plus equity raised US$70m |
|
Total debt plus equity raised US$75m |
|
Total debt plus equity raised US$80m |
Debt facility negotiated (US$) |
65.0 |
60.0 |
55.0 |
50.0 |
45.0 |
|
65.0 |
60.0 |
55.0 |
50.0 |
45.0 |
|
65.0 |
60.0 |
55.0 |
50.0 |
45.0 |
Equity funds raised (US$) |
5.0 |
10.0 |
15.0 |
20.0 |
25.0 |
|
10.0 |
15.0 |
20.0 |
25.0 |
30.0 |
|
15.0 |
20.0 |
25.0 |
30.0 |
35.0 |
Total (US$) |
70.0 |
70.0 |
70.0 |
70.0 |
70.0 |
|
75.0 |
75.0 |
75.0 |
75.0 |
75.0 |
|
80.0 |
80.0 |
80.0 |
80.0 |
80.0 |
Grieve NPV (US$m) |
65.7 |
65.7 |
65.7 |
65.7 |
65.7 |
|
65.7 |
65.7 |
65.7 |
65.7 |
65.7 |
|
65.7 |
65.7 |
65.7 |
65.7 |
65.7 |
Grieve NPV (A$m) |
87.6 |
87.6 |
87.6 |
87.6 |
87.6 |
|
87.6 |
87.6 |
87.6 |
87.6 |
87.6 |
|
87.6 |
87.6 |
87.6 |
87.6 |
87.6 |
Singleton (book value) (A$m) |
3.3 |
3.3 |
3.3 |
3.3 |
3.3 |
|
3.3 |
3.3 |
3.3 |
3.3 |
3.3 |
|
3.3 |
3.3 |
3.3 |
3.3 |
3.3 |
Subtotal |
90.9 |
90.9 |
90.9 |
90.9 |
90.9 |
|
90.9 |
90.9 |
90.9 |
90.9 |
90.9 |
|
90.9 |
90.9 |
90.9 |
90.9 |
90.9 |
Net debt before raising (A$m) |
0.0 |
0.0 |
0.0 |
0.0 |
0.0 |
|
0.0 |
0.0 |
0.0 |
0.0 |
0.0 |
|
0.0 |
0.0 |
0.0 |
0.0 |
0.0 |
Capital raising (US$$m) |
5.0 |
10.0 |
15.0 |
20.0 |
25.0 |
|
10.0 |
15.0 |
20.0 |
25.0 |
30.0 |
|
15.0 |
20.0 |
25.0 |
30.0 |
35.0 |
Capital raising (A$m) |
6.7 |
13.3 |
20.0 |
26.7 |
33.3 |
|
13.3 |
20.0 |
26.7 |
33.3 |
40.0 |
|
20.0 |
26.7 |
33.3 |
40.0 |
46.7 |
Net debt/(cash) after issue (A$m) |
(6.7) |
(13.3) |
(20.0) |
(26.7) |
(33.3) |
|
(13.3) |
(20.0) |
(26.7) |
(33.3) |
(40.0) |
|
(20.0) |
(26.7) |
(33.3) |
(40.0) |
(46.7) |
ELK valuation (A$m) |
97.6 |
104.2 |
110.9 |
117.6 |
124.2 |
|
104.2 |
110.9 |
117.6 |
124.2 |
130.9 |
|
110.9 |
117.6 |
124.2 |
130.9 |
137.6 |
Issue share price (A$m) |
0.075 |
0.075 |
0.075 |
0.075 |
0.075 |
|
0.075 |
0.075 |
0.075 |
0.075 |
0.075 |
|
0.075 |
0.075 |
0.075 |
0.075 |
0.075 |
Shares issued (m) |
88.9 |
177.8 |
266.7 |
355.6 |
444.4 |
|
177.8 |
266.7 |
355.6 |
444.4 |
533.3 |
|
266.7 |
355.6 |
444.4 |
533.3 |
622.2 |
Current plus new shares (m) |
473.0 |
561.9 |
650.8 |
739.7 |
828.6 |
|
561.9 |
650.8 |
739.7 |
828.6 |
917.5 |
|
650.8 |
739.7 |
828.6 |
917.5 |
1,006.4 |
ELK valuation (A$/share) |
0.21 |
0.19 |
0.17 |
0.16 |
0.15 |
|
0.19 |
0.17 |
0.16 |
0.15 |
0.14 |
|
0.17 |
0.16 |
0.15 |
0.14 |
0.14 |
Current issued shares (m) |
384.1 |
|
|
|
|
|
|
|
|
|
|
|
|
|
|
|
|
A$/US$ |
0.75 |
|
|
|
|
|
|
|
|
|
|
|
|
|
|
|
|
Source: Edison Investment Research
Our earnings forecasts and cash flow and balance sheet projections are tabulated in Exhibit 12.
ELK does not have a current source of operating earnings. The Grieve CO2 EOR project is planned to start production in late 2017. The project is a JV between ELK and DNR. ELK will also derive oil haulage tariffs from the Grieve-Casper oil pipeline, which it owns. ELK is also focused on a second CO2 EOR project (which includes the Singleton project) in the DJ Basin, Nebraska.
ELK will not have a regular cash flow stream until the Grieve project commences production. Recent funds have been raised in equity issues.
On 11 January 2016, ELK issued 39.999m shares at A$0.063/share, raising a total of A$2.5m. This is being mainly applied to continued exploration and feasibility study expenditure for the company’s assets and general working capital.
On 1 April 2016, ELK completed a A$1m placement of 13.3m shares at A$0.075/share. Funds are being mainly applied to fund initial capital expenditures associated with the Grieve project JV restructuring. The intention is to maintain the Grieve project development schedule on the basis of imminent completion of definitive agreements for the JV restructure and the securing of financing.
ELK’s JV partner at Grieve, DNR, has worked to maintain a sound financial position despite lower oil prices. We believe DNR will be able its fund its share of costs to develop and operate Grieve. Cash flow from its operations was positive during CY15, including Q415, with DNR accomplishing a small reduction in debt. Most of its debt comprises senior subordinated notes with no near-term maturities. DNR achieved significant year-on-year capital and operating expenditure cuts in CY15. Its focus continues to be on reducing costs, increasing efficiencies and maximising cash flow.
At 31 December 2015, ELK had a cash balance of A$0.2m and total debt of A$24.8m. This included A$20.9m debt related to Elk Petroleum’s share of JV costs incurred at the Grieve project, which will be eliminated on the signing of formal agreements relating to the project restructuring. Since this balance date, funds have been replenished by equity raisings as above.
On 18 April 2016, all lenders under the A$3.6m Convertible Loan Facility converted the full principal balance and accrued interest into ordinary shares. The total outstanding balance of A$4.07m was converted to 107,145,743 new shares resulting in a total of 384,149,643 shares outstanding. We estimate ELK will have no debt once the agreement is signed and before drawdown of the anticipated debt financing (see below) to complete the project.
ELK has entered into letters of intent to provide funding of US$55m for capital expenditure to complete the Grieve project, as part of the project restructuring and an increase in ELK’s economic interest. ELK is in advanced negotiations with potential debt providers. We envisage funds will be drawn down as required to complete the project under the fixed price turnkey commitment.
In addition to US$55m of debt funding, we assume ELK will raise additional equity of US$15-20m for general and working capital purposes at Grieve and for the company’s other projects, particularly Singleton. In line with our valuations, we have assumed a notional capital raising of US$20m, equivalent to A$26.7m at US$0.75/A$. We assume this raising takes place in FY17.
For the purpose of our earnings model, we have similarly assumed the shares are issued at A$0.075/share, the same price as ELK’s last issue on 1 April 2016. In the financial summary (Exhibit 12), issued shares are calculated from the notional A$26.7m capital raising.
These assumptions are subject to variation. The achievement of further milestones such as the completion of debt financing could lead to a higher share price, reducing the number of shares issued. Alternatively, the company could choose to have a larger equity raising. We have provided a reasonable scenario to accompany our earnings forecasts. A range of outcomes is possible.
Exhibit 12: Financial summary
|
|
A$'000s |
2014 |
2015 |
2016e |
2017e |
2018e |
2019e |
Year end June |
|
IFRS |
IFRS |
IFRS |
IFRS |
IFRS |
IFRS |
PROFIT & LOSS |
|
|
|
|
|
|
|
Revenue |
|
|
327 |
38 |
38 |
38 |
22,522 |
58,471 |
Cost of sales |
|
(803) |
(264) |
(300) |
(300) |
(6,713) |
(12,906) |
Gross profit |
|
|
(476) |
(226) |
(262) |
(262) |
15,809 |
45,566 |
General & admin |
|
(3,639) |
(2,901) |
(3,680) |
(3,500) |
(3,500) |
(3,500) |
EBITDA |
|
|
(4,115) |
(3,127) |
(3,942) |
(3,762) |
12,309 |
42,066 |
Depreciation |
|
(1,050) |
(243) |
(169) |
(170) |
(7,242) |
(15,309) |
EBIT (before amort. and except.) |
(5,165) |
(3,370) |
(4,112) |
(3,932) |
5,068 |
26,756 |
Intangible amortisation |
0 |
0 |
0 |
0 |
0 |
0 |
Exceptionals |
|
(2,060) |
0 |
(1,200) |
0 |
0 |
0 |
Other |
|
|
0 |
0 |
0 |
0 |
0 |
0 |
EBIT |
|
|
(7,225) |
(3,370) |
(5,311) |
(3,932) |
5,068 |
26,756 |
Net interest |
|
(122) |
(276) |
(742) |
10 |
(3,628) |
(5,299) |
Profit before tax (norm) |
|
(5,287) |
(3,646) |
(4,854) |
(3,923) |
1,439 |
21,457 |
Profit before tax (FRS 3) |
|
(7,347) |
(3,646) |
(6,053) |
(3,923) |
1,439 |
21,457 |
Tax |
|
|
0 |
0 |
0 |
0 |
170 |
(253) |
Profit after tax (norm) |
|
(5,287) |
(3,646) |
(4,854) |
(3,923) |
1,610 |
21,204 |
Profit after tax (FRS 3) |
|
(7,347) |
(3,646) |
(6,053) |
(3,923) |
1,610 |
21,204 |
|
|
|
|
|
|
|
|
|
Average number of shares outstanding (m) |
180.2 |
196.7 |
379.7 |
735.3 |
735.3 |
735.3 |
EPS - normalised (c) |
|
(2.9) |
(1.9) |
(1.3) |
(0.5) |
0.2 |
2.9 |
EPS - normalised and fully diluted (c) |
(2.9) |
(1.9) |
(1.3) |
(0.5) |
0.2 |
2.9 |
EPS - (IFRS) (c) |
|
(4.1) |
(1.9) |
(1.6) |
(0.5) |
0.2 |
2.9 |
Dividend per share (c) |
|
0.0 |
0.0 |
0.0 |
0.0 |
0.0 |
0.0 |
|
|
|
|
|
|
|
|
|
Gross Margin (%) |
|
N/A |
N/A |
N/A |
N/A |
70.2 |
77.9 |
EBITDA Margin (%) |
|
N/A |
N/A |
N/A |
N/A |
54.7 |
71.9 |
Operating Margin (before GW and except.) (%) |
N/A |
N/A |
N/A |
N/A |
22.5 |
45.8 |
|
|
|
|
|
|
|
|
|
BALANCE SHEET |
|
|
|
|
|
|
|
Fixed Assets |
|
|
20,176 |
28,979 |
29,481 |
82,707 |
102,876 |
87,566 |
Intangible assets |
|
20,128 |
28,953 |
29,035 |
29,035 |
29,035 |
29,035 |
Tangible assets |
|
48 |
26 |
446 |
53,673 |
73,841 |
58,532 |
Investments |
|
0 |
0 |
0 |
0 |
0 |
0 |
Current Assets |
|
3,261 |
2,549 |
1,844 |
982 |
3,523 |
7,803 |
Stocks |
|
|
9 |
0 |
0 |
0 |
903 |
2,330 |
Debtors |
|
|
35 |
168 |
168 |
168 |
1,806 |
4,660 |
Cash |
|
|
403 |
1,567 |
862 |
0 |
0 |
0 |
Other |
|
|
2,814 |
813 |
813 |
813 |
813 |
813 |
Current Liabilities |
|
(5,216) |
(11,548) |
(4,377) |
(4,377) |
(2,107) |
(5,436) |
Creditors |
|
|
(2,900) |
(7,962) |
(4,377) |
(4,377) |
(2,107) |
(5,436) |
Short term borrowings |
|
(2,316) |
(3,585) |
0 |
0 |
0 |
0 |
Long Term Liabilities |
|
(17,385) |
(22,147) |
(3,216) |
(32,836) |
(56,206) |
(20,644) |
Long term borrowings |
|
(12,589) |
(18,931) |
0 |
(29,620) |
(52,989) |
(17,427) |
Other long term liabilities |
(4,797) |
(3,216) |
(3,216) |
(3,216) |
(3,216) |
(3,216) |
Net Assets |
|
|
835 |
(2,167) |
23,732 |
46,476 |
48,086 |
69,289 |
|
|
|
|
|
|
|
|
|
CASH FLOW |
|
|
|
|
|
|
|
|
Operating Cash Flow |
|
(3,712) |
(3,337) |
(4,684) |
(3,753) |
4,041 |
35,562 |
Net interest |
|
0 |
0 |
0 |
0 |
0 |
0 |
Tax |
|
|
0 |
0 |
0 |
0 |
0 |
0 |
Capex |
|
|
(863) |
2,560 |
(671) |
(53,396) |
(27,410) |
0 |
Acquisitions/disposals |
|
0 |
0 |
0 |
0 |
0 |
0 |
Equity issued |
|
2,660 |
742 |
8,236 |
26,667 |
0 |
0 |
Dividends |
|
|
0 |
0 |
0 |
0 |
0 |
0 |
Net Cash Flow |
|
(1,916) |
(36) |
2,880 |
(30,482) |
(23,369) |
35,562 |
Opening net debt/(cash) |
|
4,216 |
14,501 |
20,949 |
(862) |
29,620 |
52,989 |
HP finance leases initiated |
0 |
0 |
0 |
0 |
0 |
0 |
Other |
|
|
(8,370) |
(6,412) |
18,931 |
0 |
0 |
0 |
Closing net debt/(cash) |
|
14,501 |
20,949 |
(862) |
29,620 |
52,989 |
17,427 |
Source: Elk Petroleum, Edison Investment Research
Contact details |
Revenue by geography |
Elk Petroleum
Level 1, Suite 101
10 Bridge Street
Sydney, NSW, 2000
Australia
+61 2 9093 5400
www.elkpet.com |
N/A |
Contact details |
Elk Petroleum
Level 1, Suite 101
10 Bridge Street
Sydney, NSW, 2000
Australia
+61 2 9093 5400
www.elkpet.com |
Revenue by geography |
N/A |
Management team |
|
Managing Director & CEO: Brad Lingo |
Chief Operating Officer: David Evans |
Brad has over 25 years’ experience in all phases of the oil and gas business including business development, new ventures, exploration, development and production as well as acquisitions, equity capital raising and debt financing. He is a former MD and CEO of Drillsearch Energy and CEO of Sunshine Gas. |
David has 29 years’ upstream global oil and gas development, production and exploration experience, with significant exposure to brownfield developments and EOR projects. He was previously executive GM-operations at Drillsearch Energy. He is a development geologist with a strong operations background. |
Chief Financial Officer: Alexander Hunter |
President – Elk Petroleum USA: Scott Hornafius |
Alex has over 10 years’ experience in resources sector M&A and corporate finance and 10 years’ prior experience in construction project management. As GM-BD at Drillsearch, he led various corporate takeovers, asset acquisitions and divestments. He has strong financial, analytical and management skills. |
Scott has over 29 years’ exploration, technical, management and funding experience in oil and gas including 16 years with Mobil in the US, PNG and the UK before founding MegaEnergy, which developed a 100,000 acre Marcellus shale position, sold for $100m. He is a founding director of Canning Petroleum. |
Management team |
Managing Director & CEO: Brad Lingo |
Brad has over 25 years’ experience in all phases of the oil and gas business including business development, new ventures, exploration, development and production as well as acquisitions, equity capital raising and debt financing. He is a former MD and CEO of Drillsearch Energy and CEO of Sunshine Gas. |
Chief Operating Officer: David Evans |
David has 29 years’ upstream global oil and gas development, production and exploration experience, with significant exposure to brownfield developments and EOR projects. He was previously executive GM-operations at Drillsearch Energy. He is a development geologist with a strong operations background. |
Chief Financial Officer: Alexander Hunter |
Alex has over 10 years’ experience in resources sector M&A and corporate finance and 10 years’ prior experience in construction project management. As GM-BD at Drillsearch, he led various corporate takeovers, asset acquisitions and divestments. He has strong financial, analytical and management skills. |
President – Elk Petroleum USA: Scott Hornafius |
Scott has over 29 years’ exploration, technical, management and funding experience in oil and gas including 16 years with Mobil in the US, PNG and the UK before founding MegaEnergy, which developed a 100,000 acre Marcellus shale position, sold for $100m. He is a founding director of Canning Petroleum. |
Principal shareholders |
(%) |
Robert Healy |
25.2 |
Begley Superannuation |
11.5 |
Republic Investment Management Pte. Ltd |
10.9 |
HSBC (including Republic Investment Management) |
9.9 |
Board and management |
7.0 |
|
Companies named in this report |
Denbury Resources Inc (DNR:NYSE) , Devon Energy (DVN:NYSE) |
|
Edison, the investment intelligence firm, is the future of investor interaction with corporates. Our team of over 100 analysts and investment professionals work with leading companies, fund managers and investment banks worldwide to support their capital markets activity. We provide services to more than 400 retained corporate and investor clients from our offices in London, New York, Frankfurt, Sydney and Wellington. Edison is authorised and regulated by the Financial Conduct Authority. Edison Investment Research (NZ) Limited (Edison NZ) is the New Zealand subsidiary of Edison. Edison NZ is registered on the New Zealand Financial Service Providers Register (FSP number 247505) and is registered to provide wholesale and/or generic financial adviser services only. Edison Investment Research Inc (Edison US) is the US subsidiary of Edison and is regulated by the Securities and Exchange Commission. Edison Investment Research Limited (Edison Aus) [46085869] is the Australian subsidiary of Edison and is not regulated by the Australian Securities and Investment Commission. Edison Germany is a branch entity of Edison Investment Research Limited [4794244]. www.edisongroup.com DISCLAIMER
Copyright 2016 Edison Investment Research Limited. All rights reserved. This report has been commissioned by Elk Petroleum and prepared and issued by Edison for publication globally. All information used in the publication of this report has been compiled from publicly available sources that are believed to be reliable, however we do not guarantee the accuracy or completeness of this report. Opinions contained in this report represent those of the research department of Edison at the time of publication. The securities described in the Investment Research may not be eligible for sale in all jurisdictions or to certain categories of investors. This research is issued in Australia by Edison Aus and any access to it, is intended only for "wholesale clients" within the meaning of the Australian Corporations Act. The Investment Research is distributed in the United States by Edison US to major US institutional investors only. Edison US is registered as an investment adviser with the Securities and Exchange Commission. Edison US relies upon the "publishers' exclusion" from the definition of investment adviser under Section 202(a)(11) of the Investment Advisers Act of 1940 and corresponding state securities laws. As such, Edison does not offer or provide personalised advice. We publish information about companies in which we believe our readers may be interested and this information reflects our sincere opinions. The information that we provide or that is derived from our website is not intended to be, and should not be construed in any manner whatsoever as, personalised advice. Also, our website and the information provided by us should not be construed by any subscriber or prospective subscriber as Edison’s solicitation to effect, or attempt to effect, any transaction in a security. The research in this document is intended for New Zealand resident professional financial advisers or brokers (for use in their roles as financial advisers or brokers) and habitual investors who are “wholesale clients” for the purpose of the Financial Advisers Act 2008 (FAA) (as described in sections 5(c) (1)(a), (b) and (c) of the FAA). This is not a solicitation or inducement to buy, sell, subscribe, or underwrite any securities mentioned or in the topic of this document. This document is provided for information purposes only and should not be construed as an offer or solicitation for investment in any securities mentioned or in the topic of this document. A marketing communication under FCA Rules, this document has not been prepared in accordance with the legal requirements designed to promote the independence of investment research and is not subject to any prohibition on dealing ahead of the dissemination of investment research. Edison has a restrictive policy relating to personal dealing. Edison Group does not conduct any investment business and, accordingly, does not itself hold any positions in the securities mentioned in this report. However, the respective directors, officers, employees and contractors of Edison may have a position in any or related securities mentioned in this report. Edison or its affiliates may perform services or solicit business from any of the companies mentioned in this report. The value of securities mentioned in this report can fall as well as rise and are subject to large and sudden swings. In addition it may be difficult or not possible to buy, sell or obtain accurate information about the value of securities mentioned in this report. Past performance is not necessarily a guide to future performance. Forward-looking information or statements in this report contain information that is based on assumptions, forecasts of future results, estimates of amounts not yet determinable, and therefore involve known and unknown risks, uncertainties and other factors which may cause the actual results, performance or achievements of their subject matter to be materially different from current expectations. For the purpose of the FAA, the content of this report is of a general nature, is intended as a source of general information only and is not intended to constitute a recommendation or opinion in relation to acquiring or disposing (including refraining from acquiring or disposing) of securities. The distribution of this document is not a “personalised service” and, to the extent that it contains any financial advice, is intended only as a “class service” provided by Edison within the meaning of the FAA (ie without taking into account the particular financial situation or goals of any person). As such, it should not be relied upon in making an investment decision. To the maximum extent permitted by law, Edison, its affiliates and contractors, and their respective directors, officers and employees will not be liable for any loss or damage arising as a result of reliance being placed on any of the information contained in this report and do not guarantee the returns on investments in the products discussed in this publication. FTSE International Limited (“FTSE”) © FTSE 2016. “FTSE®” is a trade mark of the London Stock Exchange Group companies and is used by FTSE International Limited under license. All rights in the FTSE indices and/or FTSE ratings vest in FTSE and/or its licensors. Neither FTSE nor its licensors accept any liability for any errors or omissions in the FTSE indices and/or FTSE ratings or underlying data. No further distribution of FTSE Data is permitted without FTSE’s express written consent. |
Frankfurt +49 (0)69 78 8076 960 Schumannstrasse 34b 60325 Frankfurt Germany |
London +44 (0)20 3077 5700 280 High Holborn London, WC1V 7EE United Kingdom |
New York +1 646 653 7026 245 Park Avenue, 39th Floor 10167, New York US |
Sydney +61 (0)2 9258 1161 Level 25, Aurora Place 88 Phillip St, Sydney NSW 2000, Australia |
Wellington +64 (0)48 948 555 Level 15, 171 Featherston St Wellington 6011 New Zealand |
Frankfurt +49 (0)69 78 8076 960 Schumannstrasse 34b 60325 Frankfurt Germany |
London +44 (0)20 3077 5700 280 High Holborn London, WC1V 7EE United Kingdom |
New York +1 646 653 7026 245 Park Avenue, 39th Floor 10167, New York US |
Sydney +61 (0)2 9258 1161 Level 25, Aurora Place 88 Phillip St, Sydney NSW 2000, Australia |
Wellington +64 (0)48 948 555 Level 15, 171 Featherston St Wellington 6011 New Zealand |
|


