Faroe has successfully established a 98mmboe reserve base through an exploration-led organic growth strategy. Norwegian exploration tax incentives, combined with recent success at Iris/Hades, underpin finding costs of c $1/boe (post-tax) and have delivered a portfolio of development projects with point-forward IRRs ranging from 21% to 41% at $70/bbl. With a RENAV of 185.2p/share, we believe that the market is not fully valuing the risked value of Faroe’s upcoming seven-well E&A programme that targets net un-risked prospective resource of 144mmboe, or is not fully taking into consideration the positive cash flow impact of tax depreciation carry-forwards/consolidation in Norway. Based on current debt availability, we believe Faroe is fully funded for current development commitments at an oil price down to $40/bbl.
Written by
Faroe Petroleum |
DNO - Norway Jose |
Initiation |
Oil & gas |
1 October 2018 |
Share price performance
Business description
Next events
Analysts
Faroe Petroleum is a research client of Edison Investment Research Limited |
|||||||||||||||||||||||||||||||||||||||||||||||||
Faroe has successfully established a 98mmboe reserve base through an exploration-led organic growth strategy. Norwegian exploration tax incentives, combined with recent success at Iris/Hades, underpin finding costs of c $1/boe (post-tax) and have delivered a portfolio of development projects with point-forward IRRs ranging from 21% to 41% at $70/bbl. With a RENAV of 185.2p/share, we believe that the market is not fully valuing the risked value of Faroe’s upcoming seven-well E&A programme that targets net un-risked prospective resource of 144mmboe, or is not fully taking into consideration the positive cash flow impact of tax depreciation carry-forwards/consolidation in Norway. Based on current debt availability, we believe Faroe is fully funded for current development commitments at an oil price down to $40/bbl.
Year end |
Revenue |
PBT* |
Cash from |
Net debt/ |
Capex |
12/16 |
94.8 |
(61.6) |
55.4 |
(60.9) |
(79.4) |
12/17 |
152.9 |
(21.0) |
133.9 |
(43.3) |
(144.2) |
12/18e |
236.3 |
62.3 |
173.6 |
(43.8) |
(225.7) |
12/19e |
225.0 |
37.7 |
173.7 |
44.7 |
(263.8) |
Note: *PBT and EPS are normalised, excluding amortisation of acquired intangibles, exceptional items and share-based payments.
Active H218 and 2019 exploration programme
Faroe’s active exploration and appraisal campaign in 2018 and 2019 continues its strategy of creating value through the drill bit. The first well, Iris/Hades, delivered significant success, adding a Faroe-estimated net 2C resources of 42mmboe to the company and rated as one of the largest discoveries worldwide in 2018. The remaining seven firm wells in the programme will target total net un-risked resources of 144mmboe (including 15mmboe in Agar Plantain in the UK continental shelf (UKCS). The bulk of the E&A programme is focused around the three key hub areas of Ula, Brasse and Njord, allowing Faroe to monetise any discoveries through subsea tie-backs to existing infrastructure.
Prudent financial management – funded at $40/bbl
Taking into consideration committed exploration spend, maintenance capex and planned development spend, we believe that existing funds and liquidity are more than sufficient, even at an oil price down to $40/bbl. Faroe’s requirement for further capital, whether through equity, asset sales or farm-out, is therefore limited to the development of material new exploration discoveries.
Valuation: RENAV 185.2p/share
Our RENAV of 185.2p/share is based on a long-term oil price of $70/bbl and 10% WACC, which rises to 215.0p/share assuming an 8% WACC. Key investment risks include service cost inflation, potential for underestimation of decommissioning liabilities and asset integrity.
Investment summary
Norwegian-focused, exploration-led integrated E&P
Faroe Petroleum has built a material diverse portfolio of exploration, appraisal, development and production assets in Norway, UK and Ireland. Production guidance for FY18 stands at 12–14kboed and an end-2017 2P reserve base of 98mmboe. Norway dominates both current production at 77% and 2P reserves at 98% of the group total. Reserves growth has been largely organic, with Faroe demonstrating a strong track record of value creation through the drill-bit; historical average finding costs stand at c $1/boe. Incentivised by attractive exploration fiscal terms in Norway, Faroe is to spend £80m per year (approximately $110m) on exploration and appraisal in 2018 and 2019 across a portfolio of drill-ready prospective resource targeting 144mmboe un-risked.
Organic growth potential undervalued
Our base case valuation stands at a RENAV of 185.2p/share based on a 10% weighted average cost of capital (WACC) and $70/bbl long-term oil price (both key sensitivities). Using a more broad-brush approach and applying generic historical Norwegian M&A multiples for Faroe’s 2P reserves and adjusting for financial items would equate to a valuation of 162p/share. We feel that the market is failing to value Faroe’s organic growth potential beyond existing discoveries, in particular a drill-ready exploration and appraisal portfolio targeting 144mmboe of un-risked prospective resource over the course of H218 and 2019. Net exploration costs are low, given Norway’s 78% tax rebate and commercial success rates of c 31% (Faroe 35%), which reflect the maturity of the Norwegian continental shelf (NCS). In the event of discovery, infrastructure is readily available close to planned prospects and tie-back host tariff structures are state-regulated, driving a relatively low minimum economic threshold for commerciality. Based on Faroe’s current development portfolio, we calculate development project IRRs ranging from 21% to 41%. Project IRRs are currently benefiting from significant cost deflation in the service sector; although, if commodity prices stay close to current levels, an element of cost inflation is inevitable.
Financials: Funded development portfolio
Funding of future exploration in Norway is through existing cash resources and a rolling NOK1bn exploration debt facility, while appraisal and development of contingent resource is to be funded through the company’s undrawn $250m RBL and a further $100m accordion facility. We expect Faroe’s borrowing base to grow as contingent resource is progressed to reserves and its RBL potentially re-determined based on a higher commodity price deck. In addition, the NCS offers a liquid asset market, with Faroe having both acquired and divested assets in recent years, offering a monetisation route in the event that management wishes to diversify development risk. Recent M&A transactions include DNO’s purchase of an additional 15.37% in Faroe at $5.2/boe 2P (at 125p per Faroe share), which compares to historical transactions for NCS producing assets at $11.8/boe 2P.
Risks and sensitivities: Cost of capital and commodity price
Key valuation sensitivities for Faroe include underlying commodity prices and WACC. In our base case, we assume a $70/bbl long-term (2022) Brent crude price and a 10% WACC, but we provide sensitivities to these assumptions within the valuation section of this note. Key risks include potential underestimation of decommissioning costs for UKCS and NCS assets, service sector cost inflation and asset integrity. We assume decommissioning costs in line with operator estimates where available and note that the Norwegian petroleum safety authority (PSA) is rigorous in prescription and enforcement of oil and gas safety regulation limiting the risk of tail events such as material hydrocarbon releases.
Valuation
We value Faroe’s asset base using a conventional risked net asset value (NAV) approach, utilising a discounted cash-flow-based valuation for producing assets and risked valuation for proven undeveloped reserves, contingent and prospective resource. Key assumptions in our valuation include estimates of asset development costs, operational costs and abandonment costs in addition to realised commodity prices and cost of capital. We use publicly available sources for key assumptions, including company guidance, analysis of analogous field developments and government data.
We use a standardised approach to discount rate across our E&P coverage; in general, we use a 12.5% to reflect the life of company WACC for an E&P and incorporate asset level dilution (farm-out) for un-funded exploration and development. In the case of Faroe, we believe that the company’s relatively low cost capital structure (post-tax), exploration tax credits and undrawn $250m reserve base lending (RBL) facility provide visibility on development project funding, limiting the requirement for further equity capital. In our base case, we assume a 10% WACC for Faroe, which we believe to be conservative relative to the company’s post-tax cost of debt, which ranges from 2% to 4%. We provide a sensitivity analysis for both higher and lower WACC assumptions.
Exhibit 7 below shows a breakdown of our base case valuation by asset class. Key components include production from Faroe’s Norwegian asset base, risked development value in Norway and the tax consolidation benefit of utilising historical tax losses, depreciation balances and pooling of depreciation schedules in Norway. We note material variation in analyst valuations of the benefit of Faroe tax consolidation in Norway; we include the benefit of an accelerated depreciation schedule from the consolidation of standalone assets, £21m of corporate tax balances, £58.9m of special tax balances, £107.6m of carried-forward unutilised depreciations, and 180m NOK of unused uplift at year-end 2017.
|
Exhibit 7: Base case valuation waterfall |
|
|
Source: Edison Investment Research |
Based on our analysis, and our underlying commodity price and WACC assumptions, the market is fully valuing Faroe’s production assets but undervaluing risked development or prospective resource. Given historical basin-wide success rates, Faroe’s drill-ready prospects and the post-tax cost of exploration in Norway, we feel that the market should be placing at least some option value on the company’s exploration portfolio.
Below we look at key sensitivities to our base case valuation and alternative valuation ranges based on a spread of oil price, WACC and historical Norwegian 2P transaction multiples. We apply a multiple of $11.3/boe for 2P reserves in production, $5.5/bbl for 2P reserves under development based on historical NCS transaction values and adjust for financial items in arriving at a valuation of 162p/share (133p/share to 190p/share +/-20%).
|
Exhibit 8: Spider graph with key valuation sensitivities |
Exhibit 9: Alternative valuation ranges |
|
|
|
Source: Edison Investment Research |
|
Exhibit 8: Spider graph with key valuation sensitivities |
|
|
Source: Edison Investment Research |
|
Exhibit 9: Alternative valuation ranges |
|
|
Source: Edison Investment Research |
A full breakdown of our asset values that make up our base case RENAV are provided below including key sensitivities and underlying commodity price assumptions. As can be seen, key components include the tax shield of unutilised tax depreciations in Norway and the benefit of tax consolidation, Faroe’s key Norwegian production hubs at Njord, Ula and Brage, as well as development projects Iris/Hades and Brasse.
Exhibit 10: Detailed valuation breakdown by asset
Number of shares: 372.9m |
Recoverable |
Net |
Value per share |
|||||
Asset |
Country |
Diluted WI |
CoS |
Gross |
Net |
NPV/boe |
Risked |
Risked* |
% |
% |
mmboe |
mmboe |
$/boe |
$m |
p/share |
||
Net debt/cash FY17 |
105.0 |
20.5 |
||||||
Fenja sale proceeds |
68.0 |
13.3 |
||||||
Overheads (3 years NPV10) |
(23.5) |
(4.6) |
||||||
Norway tax consolidation benefit |
260.1 |
50.7 |
||||||
Decomm liability (assets under abandonment) |
(10.0) |
(2.0) |
||||||
Committed exploration post-tax |
(36.3) |
(7.1) |
||||||
Production |
||||||||
Tambar |
Norway |
45% |
100% |
28.0 |
12.6 |
6.5 |
81.8 |
15.9 |
Njord, Hyme, Bauge and Fenja |
Norway |
8% |
100% |
334.7 |
25.1 |
3.3 |
82.8 |
16.2 |
Oda |
Norway |
15% |
100% |
47.0 |
7.0 |
6.2 |
43.9 |
8.6 |
Brage |
Norway |
14% |
100% |
22.9 |
3.3 |
(0.0) |
(0.1) |
(0.0) |
Ula |
Norway |
20% |
100% |
48.6 |
9.7 |
2.5 |
24.4 |
4.8 |
Ringhorne East |
Norway |
8% |
100% |
27.1 |
2.1 |
5.1 |
10.8 |
2.1 |
Trym |
Norway |
50% |
100% |
7.3 |
3.7 |
0.6 |
2.2 |
0.4 |
Ketch Schooner |
UK |
60% |
100% |
1.2 |
0.7 |
(36.2) |
(25.6) |
(5.0) |
Blane |
UK |
45% |
100% |
5.5 |
2.4 |
28.5 |
69.2 |
13.5 |
Orca |
UK |
3% |
100% |
0.1 |
0.0 |
(88.6) |
(0.4) |
(0.1) |
East Foinaven |
UK |
10% |
100% |
0.9 |
0.1 |
(27.0) |
(2.4) |
(0.5) |
Core NAV |
66.8 |
649.7 |
126.7 |
|||||
Development |
||||||||
Brasse |
Norway |
50% |
80% |
69.2 |
34.6 |
3.3 |
92.1 |
18.0 |
Iris/Hades |
Norway |
20% |
70% |
146.5 |
29.3 |
1.2 |
24.9 |
4.8 |
Fogelberg |
Norway |
15% |
75% |
59.4 |
8.9 |
2.4 |
15.8 |
3.1 |
Contingent/development NAV |
72.8 |
132.8 |
25.9 |
|||||
Exploration |
||||||||
Agar/Plantain |
UK |
25% |
28% |
79.0 |
19.8 |
3.8 |
20.9 |
4.1 |
Rungne |
Norway |
40% |
32% |
90.0 |
36.0 |
2.7 |
30.2 |
5.9 |
Brasse East |
Norway |
50% |
27% |
13.0 |
6.5 |
2.7 |
4.7 |
0.9 |
Pabow |
Norway |
20% |
16% |
135.0 |
27.0 |
2.4 |
10.3 |
2.0 |
Cassidy |
Norway |
15% |
27% |
80.0 |
12.0 |
2.7 |
8.6 |
1.7 |
Bergknapp |
Norway |
30% |
24% |
45.0 |
13.5 |
2.4 |
7.8 |
1.5 |
Gomez/SE Tor** |
Norway |
85% |
30% |
107.5 |
91.4 |
2.4 |
65.1 |
12.7 |
Canela** |
Norway |
40% |
24% |
95.0 |
38.0 |
2.2 |
19.7 |
3.8 |
Risked exploration |
244.1 |
167.2 |
32.6 |
|||||
RENAV |
949.6 |
185.2 |
||||||
Source: Edison Investment Research. Note: *US$/£1.37, **Gomez/SE Tor and Canela are planned for 2019 and hence added to our valuation; however, these are not firm wells.
As can be seen in Exhibit 11, key valuation sensitivities are our underlying long-term oil price assumption as well as WACC. The table below provides further quantification of these specific sensitivities.
Exhibit 11: Valuation sensitivity to WACC and LT Brent price assumption
WACC % / LT Brent $/bbl |
50 |
60 |
70 |
80 |
90 |
6% |
182.3 |
216.8 |
251.0 |
284.9 |
318.9 |
8% |
154.3 |
184.8 |
215.0 |
245.0 |
274.9 |
10% |
131.3 |
158.3 |
185.2 |
211.9 |
238.5 |
12% |
112.1 |
136.3 |
160.4 |
184.2 |
208.0 |
Source: Edison Investment Research
Our base-case commodity price assumptions relevant to Faroe Petroleum are provided in the table below. Our short-term oil price assumptions are based on EIA projections for 2018 and 2019.
Exhibit 12: Edison’s valuation pricing
Commodity benchmarks |
2018 |
2019 |
2020 |
2021 |
2022 |
Brent ($/bbl) |
72.84 |
73.68 |
71.07 |
70.57 |
70 |
European gas price ($/mcf) |
7.5 |
7.69 |
7.88 |
8.08 |
8.28 |
NBP (p/therm) |
56.87 |
54.65 |
56.02 |
57.42 |
58.85 |
Source: Edison Investment Research. Note: US$/£0.73 (due to the recent volatility in exchange rates and for the sake of consistency, we assume the FX based on the average of the past six months before the end of each quarter).
Risks and sensitivities
Faroe is subject to several sector-specific and company-specific risks. We highlight the key risks below.
Sector risks
Generic sector risks include:
■
commodity price volatility;
■
geological risk and uncertainty and reservoir performance uncertainty. Assets such as Iris/Hades have a high level of uncertainty with regard to recoverable volumes and hence value;
■
recent studies on project execution in the upstream oil and gas sector suggest that up to 60% of projects incur delays and capex overruns versus FID expectations;
■
small-/mid-cap availability of funding: Faroe Petroleum has access to debt on favourable terms and undrawn debt capacity; and
■
volatility in service sector availability and pricing.
Company-specific risks
■
Geographical concentration: Faroe is 100% exposed to the UK and Norway and associated petroleum fiscal terms. UK fiscal terms have been volatile over the last decade.
■
Abandonment liability: Faroe provides for its estimate of present value of future decommissioning costs on the company balance sheet. At December 2017, this value sat at £262m, but is subject to movements determined by expected economic field life, inflation rate, discount rates and decommissioning cost estimates. We include decommissioning costs for production and development assets in our asset valuations and include an incremental expense for non-producing assets to be retired in our NAV.
■
Operational risks: Faroe’s operations are focused on the offshore UKCS and NCS. Production and development risks are typically higher in an offshore environment in comparison to onshore, but we note both the NCS and UKCS are mature operation areas with established operational practices and regulations that help minimise health, safety and environmental risks.
■
Infrastructure access: Faroe’s hydrocarbon discoveries can be reliant on third-party infrastructure for commercialisation. In this regard, Norway has an established regime that ensures a competitive, transparent and non-discriminatory process when regulating third-party access.
Tax-efficient exploration on the NCS
In 2005, Norway introduced a groundbreaking new tax initiative, where it started to directly compensate oil and gas companies for exploration activity. Since this time, the Norwegian government has provided a rebate in the following year equal to 78% of the capex spent in the previous year on exploration drilling. Exploration wells effectively became 78% cheaper to drill overnight and resulted in an immediate increase in exploration activity that has continued to today. In recent years, lower activity in the mature Norwegian North Sea has been partly offset by increased activity in the more frontier Norwegian Sea and Barents. The prize on offer is the potential for more material discoveries with exploration running but at the cost of limited infrastructure access and higher well costs.
|
Exhibit 13: Exploration well count |
|
|
Source: NPD, Edison Investment Research |
Post-discovery, the Norwegian fiscal regime allows for capital allowances resulting from almost all E&P investment activities, in addition to uplift (an additional tax shelter), to be deductible against tax. Norwegian E&P companies are taxed at 78% on profits; hence, this is a substantial boost for companies that can offset investments in developments and operations against profits from production.
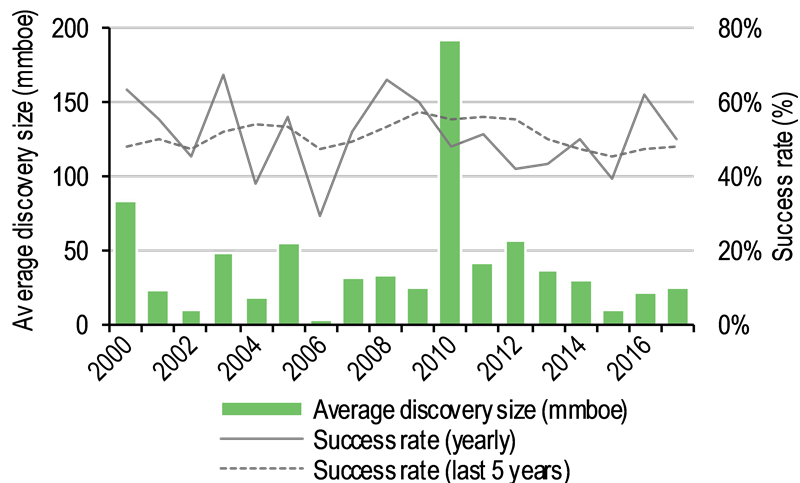
In addition to relatively low post-tax exploration costs, the maturity of the NCS and data coverage provide for relatively high exploration success rates, but against a fall in mean discovery size as basin creaming curves evolve. The average technical success rate over the past 10 years was c 52%, but with mean discovery sizes falling below 35mmboe (excluding John Sverdrup) commercial success rates average c 31%. Increasing infrastructure density and the recent rise in commodity prices ensure that the minimum threshold for commerciality continues to fall.
|
Exhibit 14: NCS technical success rate and average discovery size, 2000–2017 |
Exhibit 15: Technical and commercial success rates |
|
|
|
Source: NPD, Edison Investment Research |
|
Exhibit 16: NCS discoveries size, 2008–2017. Johan Sverdrup of about 2,500mmboe falls outside the figure |
Exhibit 17: NCS expected remaining oil and gas resources (31 December 2017) |
|
|
|
Source: NPD, Edison Investment Research *Including Johan Sverdrup |
Source: NPD, Edison Investment Research |
|
Exhibit 14: NCS technical success rate and average discovery size, 2000–2017 |
|
|
Source: NPD, Edison Investment Research |
|
Exhibit 16: NCS discoveries size, 2008–2017. Johan Sverdrup of about 2,500mmboe falls outside the figure |
|
|
Source: NPD, Edison Investment Research *Including Johan Sverdrup |
|
Exhibit 15: Technical and commercial success rates |
|
|
Source: NPD, Edison Investment Research |
|
Exhibit 17: NCS expected remaining oil and gas resources (31 December 2017) |
|
|
Source: NPD, Edison Investment Research |
Taking into consideration data post-Johan Sverdrup, (2011–2017), and applying historical average actual data for chance of technical success (48%), mean discovery size (31mmboe) and average post-tax exploration well cost of $12.3m (gross cost $55.9m), this would imply that a technical finding cost of c 0.83$/boe should be achievable. Assuming the same mean volume for a commercial success, at a historical success rate of 31%, this would imply a finding cost of $1.3/boe. This is broadly in line with Faroe’s historical finding cost for commercial discoveries of c $1/boe.
|
Exhibit 18: Exploration wells spudded by area, 2008-2017 |
Exhibit 19: Average exploration well drilling cost per well by area, 2008-17 |
|
|
|
Source: NPD, Edison Investment Research |
|
Exhibit 18: Exploration wells spudded by area, 2008-2017 |
|
|
Source: NPD, Edison Investment Research |
|
Exhibit 19: Average exploration well drilling cost per well by area, 2008-17 |
|
|
Source: NPD, Edison Investment Research |
We look at historical technical finding costs (post-tax) across the three major NCS offshore areas in Exhibit 20. Technical finding costs in the Barents are low, due to a combination of relatively high historical technical success rates and the discovery of Johan Castberg (c 500mmboe), which positively skews mean discovery size. However, while we do not have historical data on commercial success rates by offshore area, we would expect commercial success rates to be relatively low compared to the North Sea in the Barents, due to the lack of available infrastructure and the need for discoveries to justify standalone development.
|
Exhibit 20: NCS technical finding costs (2011 to 2017)* |
|
|
Source: NPD, Edison Investment Research. Note: *finding costs calculated post-tax exploration tax credit. |
Seven further E&A wells in H218 and 2019
Faroe commenced an E&A drilling programme in late 2017 and to date has achieved significant successes with the Iris/Hades discoveries and the appraisal of nearby Fogelberg. Iris/Hades discovered gas condensate across two separate reservoirs estimated to hold combined gross 2C resources of 210mmboe. Meanwhile, the appraisal of Fogelberg has resulted in a preliminary gross resource range estimate of 40–90mmboe and the company is now preparing to carry out development planning studies for a subsea tie-back to Åsgard B in H2 2018. Six further exploration wells, together with an appraisal well in Iris/Hades, are committed for H2 2018 and H1 2019, with further targets being matured for potential addition to the current programme.
Exhibit 21: Faroe exploration and appraisal calendar
2018 |
2019 |
|||||||
Prospect |
Q1 |
Q2 |
Q3 |
Q4 |
Q1 |
Q2 |
Q3 |
Q4 |
Iris/Hades |
||||||||
Fogelberg |
||||||||
Agar/Plantain* |
||||||||
Rungne* |
||||||||
Brasse East* |
||||||||
Pabow* |
||||||||
Cassidy* |
||||||||
Iris/Hades (appraisal)* |
||||||||
Bergknapp* |
||||||||
Gomez** |
||||||||
Canela** |
||||||||
Source: Faroe Petroleum, Edison Investment Research. Note: *firm exploration; **planned exploration.
Iris and Hades: 2018 discoveries
Iris and Hades, originally known as Aerosmith and Zappa, sit across the PL644 and PL644B licences in the Halten Terrace area of the Norwegian Sea and to the north of Njord. Faroe holds a 20% WI in the licences, which are operated by OMV (30%) and partnered by Equinor (40%) and Spirit (10%). The prospects were identified in PL644 by Faroe and the JV subsequently applied for and was awarded PL644B as an extension in APA 2015. The Iris/Hades exploration well, 6506/11-10, targeted the Cretaceous Lange in Hades and the underlying Jurassic Garn in Iris and completed drilling in April 2018. The reservoirs are high pressure/high temperature (HPHT) and gas condensate was encountered in both prospects with pressure data indicating separate accumulations. The Garn reservoir in Iris is 218m thick and of moderate-to-excellent quality, while the Lange sandstones in Hades are of moderate-to-good quality. OMV assigns a combined gross resource of 48-245mmboe to Iris/Hades, of which c 25% is condensate. At this point in time, we assume a mid-case volume based on figures released by the NPD/OMV at 147mmboe for Iris-Hades in our valuation. However we note that Faroe Petroleum is internally holding a higher resource range of 63mmboe (1C), 210mmboe 2C and 322mmboe. An appraisal well is planned for H1 2019 to confirm the 2C estimates and will target the crest of the structure to the south of the discovery well. Key to the success of the well will be the extent to which the good quality Garn reservoir is distributed across the structure.
We believe there are three possible development scenarios for Iris/Hades. These include:
■
Tieback to Asgard: a low production plateau solution with low up-front capex that utilises multiple subsea tiebacks to Asgard, taking advantage of available gas processing capacity.
■
Standalone development: likely a large fixed or floating platform that is directly connected to the Polerled wet gas pipeline. This will be a high upfront capex cost solution but with high plateau production rate.
■
Asgard interconnector to Polarled: a development solution that will utilise/expand gas processing capacity at Asgard. Iris/Hades subsea wells would be tied back to Asgard and the platform modified in order to receive/process higher volumes of wet gas. Partly processed gas would then be exported via an interconnector to the Polarled wet gas pipeline. We see this as a solution that may allow a high plateau production but at lower cost than a standalone development.
Given the uncertainty with regard to development solution for Iris/Hades ahead of further appraisal, we conservatively assume a tie-back to Asgard similar to Fogelberg in our base case valuation. We limit plateau production to 25kboed gross from 2024, which is substantially lower than the 100kboed gross Faroe management thinks may be achievable under a standalone/interconnector development case. We will reassess valuation of Iris/Hades post-appraisal.
Fogelberg
Fogelberg is also an HPHT discovery that sits in the Halten Terrace area and to the east of Iris/Hades. Faroe holds 15%WI in the PL433 licence, operated by Spirit Energy. The discovery well, 6506/9-2 S, was drilled in 2010 and encountered gas condensate in the Jurassic Garn and Ile reservoirs. The well was drilled high on the structure and did not observe a fluid contact, so the original volumetric range was quite wide at 19–116mmboe. An appraisal well with a sidetrack was drilled, and a DST carried out in 2018, with a view to narrowing this range in reserve estimates and to provide additional information for development planning. The appraisal well, 6506/9-4S, was drilled downdip of the original well and established better reservoir quality reservoir and a deeper gas water contact than previously modelled. The well was subsequently sidetracked as 6506/9-4A and successfully tested at a maximum constrained and stable rate of 21mmscfd and 547bpd condensate (ie 4,047boepd), with no depletion seen over the 24-hour flow period. Faroe has estimated a preliminary resource range of 40–90mmboe on the basis of the new well data; however, this will be updated once the data has been incorporated into the reservoir model. The company is preparing to start development planning studies in H218 on tying Fogelberg back to Åsgard B, 18km to the south. Capacity has been booked in the Asgard transport system (ATS) for 2021–2023.
|
Exhibit 22: Iris/Hades and Fogelberg |
Exhibit 23: Rungne and Brasse East |
|
|
|
Source: Faroe Petroleum |
|
Exhibit 22: Iris/Hades and Fogelberg |
|
|
Source: Faroe Petroleum |
|
Exhibit 23: Rungne and Brasse East |
|
|
Source: Faroe Petroleum |
Rungne and Brasse East: Targeting additional resources for Brasse
Rungne (40%WI) and Brasse East (50%WI) are both operated by Faroe and will be drilled back to back from September 2018, with the potential to add further resources to the existing net 2P reserves of 30.7mmboe (NPD 34.6mmboe) in the planned Brasse development, also operated by the company and one of the largest finds on the NCS in 2016 and 2017. The region is a prolific hydrocarbon-producing area: the majority of the fields and discoveries in the area produce from the Brent Group reservoirs and the exploration success rate has been 67% over the past decade. Rungne is located 35km to the NW of Brasse, close to the Oseberg, Veslefrikk and Huldra fields, which have produced over 3bnboe between them. The prospect is analogous to the Oseberg field, where the reservoir is thick with high net to gross sands and good permeability and is estimated to hold c 70–100mmboe gross recoverable resources. Faroe has identified an AVO anomaly that conforms to the mapped structure and is considered to have a high chance of success. Brasse East is targeting gross 13mmboe, but if successful will also de-risk the Brasse Extension, which would likely then be brought forward for drilling in 2019.
Agar/Plantain: Return to UKCS
Agar Plantain is an exploration and appraisal well located in the UK sector of the North Sea and is Faroe’s first well in UK waters since 2013. The company farmed into a 25% interest on the sole risk drilling activity and a 12.5% interest in the P1763 licence in August 2018, 10 days before the well was spudded by operator Azinor Catalyst. The Plantain exploration well will target Eocene Frigg sands, which were proven by the Agar discovery well, 9/14a-15A, in 2014 and by the 24/9-12S Frosk oil discovery made by AkerBP in Norway in January 2018. Faroe identified that the seismic anomaly present in Frosk continued on to Plantain and Agar. The prospect is also considered to be an analogue of the Catcher field and Cairn Energy, which holds a 20%WI in Catcher, has also farmed into Agar/Plantain. Plantain will be followed by a contingent sidetrack to appraise Agar. Agar and Plantain are estimated to hold combined mid-case prospective resources of 60mmboe, with an upside of 98mmboe.The gross well cost is estimated by Faroe to be US$15m. Agar/Plantain will require further appraisal if the well is successful and benefits from multiple potential development options, including via the Beryl Bravo platform (12km), and the Alvheim FPSO (14km).
Pabow
The Pabow prospect sits in the Stord basin, and close to the producing Skirne, Jotun and Ringhorne fields. The PL 870 licence was awarded in February 2017 and Pabow is planned to be drilled in late 2018. The Equinor operated well (Faroe 20%WI), will target gross gas resources of 70 – 200 mmboe in the Lower Jurassic Statfjord and will test both a proven source and migration model and an unproven deeper gas source rock that would rely on fluid migration through fractures to accumulate in the sandstone reservoirs.
Cassidy and Bergknapp confirmed for 2019
Faroe has confirmed that it will drill exploration wells on the Cassidy and Bergknapp (formerly Yoshi) prospects in 2019; however, additional new prospectivity is under consideration to be drilled during the year, including an exploration/appraisal well in the Gomez prospect and SE Tor chalk oil discovery, and an exploration well in the Canela Prospect.
Cassidy
Cassidy is 8km north of, and on trend with, Oda and is expected to be drilled back-to-back with the Oda production wells in Q119. Faroe holds a 15% WI in the Spirit-operated prospect. The well will target the Upper Jurassic Ula reservoir in the southern compartment of a salt dome structure and there is flexibility built into the drilling programme to allow appraisal sidetracks, if required. The company estimates gross prospective resources of c 50–110 mmboe, and in the case of success Cassidy could be developed via a subsea tie-back to Ula via Oda (6km away).
Bergknapp
Faroe holds a 30%WI in the Bergknapp prospect, which will be drilled in 2019. Bergknapp sits immediately to the south of the Smørbukk South Field and is also close to the Maria development, so can be tied back to nearby infrastructure in the event of success. The Wintershall operated well will target gross resources of 30–60 mmboe in several Early to Middle Jurassic reservoirs, similar to those producing in Smørbukk South.
Management
John Bentley, non-executive chairman
John Bentley has 40 years’ experience in the natural resources sector. He served in a number of senior management positions in the Gencor Group in South Africa, the US, UK and Brazil. In 1996, he was instrumental in floating Energy Africa on the Johannesburg stock exchange and was chief executive for the following five years. More recently, he has served on the board of Caracal Energy and currently serves on the boards of Wentworth Resources, Africa Energy Corporation and Phoenix Global Resources. John, who holds a degree in Metallurgy from Brunel University, was appointed to the board in September 2007.
Graham Stewart, CEO
Graham was instrumental in founding the company in 1998, where he has been chief executive since December 2002. He holds an honours degree in Offshore Engineering from Heriot-Watt University and an MBA from Edinburgh University and has over 20 years' experience in oil and gas technical and commercial affairs. He was previously finance and commercial director at Dana Petroleum and commercial director of the Petroleum Science and Technology Institute. Graham also serves on the board of Alopex Gold as a non-executive director.
Jonathan Cooper, CFO
Jon is a chartered accountant by training having qualified with KPMG before joining Dresdner Kleinwort Benson (later Wasserstein) in their oil & gas corporate finance and advisory team. Jon is a Fellow of the ICAEW and also has a PhD in Mechanical Engineering from the University of Leeds. In 2006, he was appointed as an executive director of Gulf Keystone Petroleum, followed by Sterling Energy in 2008, where he was finance director. He subsequently joined Lamprell as chief financial officer in 2011. Jon was appointed to the board of directors in July 2013.
Helge Hammer, COO
Helge joined the company in 2006, where he is chief operating officer. Prior to joining Faroe Petroleum, he was asset manager and deputy managing director at Paladin Resources. He holds a degree in Petroleum Engineering from NTH University of Trondheim and in Economics from Institut Francais du Petrol in Paris. In addition, he worked for Shell for 13 years as a reservoir engineer, team leader and business manager in Norway, Oman, Australia and the Netherlands.
Financials
In this section, we look at Faroe’s debt capacity and cash generation, which provide visibility on funding for maintenance capex, development capex and exploration expense. It is important to note that capital expense provides a shelter against taxable profits and 78% of exploration expense is refunded a year after costs are incurred – we discuss the positive impact of tax consolidation earlier in this note. Based on our analysis, Faroe is fully covered for its published exploration, maintenance and development capital programme from existing sources of cash and debt at our base case commodity price assumptions, as well as when stress testing down to $50/bbl Brent. Further equity, divestment or farm-out would only be required in the event of further material discoveries.
Debt capacity
Senior unsecured bond – on 21 November 2017, Faroe issued a $100m senior unsecured bond in the Nordic market with a fixed coupon of 8% with maturity in 28 April 2023. Faroe’s bond currently trades at a 3% premium to par, reflecting the company’s strong perceived credit rating.
Exploration Financing Facility (EFF) – Faroe has a committed NOK1bn (c £90.3m) and accordion facility of NOK0.5bn to fund exploration. Interest is charged at NIBOR plus 1.3% and is secured against annual Norwegian tax rebates under which 78% of allowable expenditure is repaid 12m after the end of the tax year.
Reserve base lending (RBL) – Faroe has access to a US$250m RBL facility, which is due to amortise over loan life to end-2023. Interest is charged on utilisation based on LIBOR, NIBOR or EUROBOR rates, depending on currency of drawdown plus a margin ranging from 3% to 4%. As of December 2017, the facility is undrawn.
As discussed earlier in this report, Faroe has sufficient funding to meet projected capital requirements for producing and development projects at oil prices down to $40/bbl long term. We see potential for RBL capacity to increase as resource for development projects is transferred to reserves, Fenja 1P reserves are included on PDO approval, and development projects are included on a 2P basis once on-stream. The company’s post-tax cost of debt is low, given a 40–50% effective tax shield. Faroe’s undrawn debt capacity and low cost of debt are key drivers of the company’s low cost of capital.
Leverage ratios over our forecast period are low at sub 1x net debt/EBITDA, which is well below normal operating companies for listed E&P companies. In addition, production hedging provides protection to the downside and supports RBL availability (RBL remains undrawn as at June 2018). Faroe typically uses put options, which provide investors with full exposure to the upside. Put protection is in place for 23% of oil production (pre-tax) at $57/bbl in 2018 and at $60/bbl for 10% of oil production in 2019. Gas price protection of 42% of production is in place at 42.5p/therm. We note that at current commodity prices these hedges are out of the money, which will lead to non-cash mark to market hedge losses, but investors retain full commodity price exposure to the upside.
|
Exhibit 24: Net debt and net debt relative to EBITDA |
Exhibit 25: Operating cash flow, capex and net cash |
|
|
|
Source: Edison Investment Research |
|
Exhibit 24: Net debt and net debt relative to EBITDA |
|
|
Source: Edison Investment Research |
|
Exhibit 25: Operating cash flow, capex and net cash |
|
|
Source: Edison Investment Research |
Exhibit 26: Financial summary
£m |
2016 |
2017 |
2018e |
2019e |
2020e |
||||
Dec |
IFRS |
IFRS |
IFRS |
IFRS |
IFRS |
||||
PROFIT & LOSS |
|||||||||
Revenue |
|
|
95 |
153 |
236 |
225 |
270 |
||
Cost of Sales |
(100) |
(146) |
(122) |
(127) |
(161) |
||||
Gross Profit |
(5) |
7 |
114 |
98 |
108 |
||||
EBITDA |
|
|
(34) |
44 |
121 |
131 |
176 |
||
Operating Profit (before amort. and except.) |
(57) |
(2) |
81 |
57 |
67 |
||||
Intangible Amortisation |
0 |
0 |
0 |
0 |
0 |
||||
Exceptionals |
0 |
7 |
25 |
0 |
0 |
||||
Other |
0 |
0 |
0 |
0 |
0 |
||||
Operating Profit |
(57) |
(2) |
106 |
57 |
67 |
||||
Net Interest |
(5) |
(12) |
(19) |
(20) |
(21) |
||||
Profit Before Tax (norm) |
(62) |
(21) |
62 |
38 |
46 |
||||
Profit Before Tax (FRS 3) |
(62) |
(14) |
87 |
38 |
46 |
||||
Tax |
29 |
2 |
28 |
18 |
13 |
||||
Profit After Tax (norm) |
(33) |
(19) |
90 |
56 |
59 |
||||
Profit After Tax (FRS 3) |
(33) |
(11) |
114 |
56 |
59 |
||||
Average Number of Shares Outstanding (m) |
311.6 |
366.0 |
371.2 |
372.9 |
372.9 |
||||
EPS - normalised (p) |
|
(10.6) |
(5.1) |
24.2 |
14.9 |
15.8 |
|||
EPS - normalised and fully diluted (p) |
(10.6) |
(5.1) |
24.2 |
14.9 |
15.8 |
||||
EPS - (IFRS) (p) |
|
(10.6) |
(3.1) |
30.8 |
14.9 |
15.8 |
|||
Dividend per share (p) |
0.0 |
0.0 |
0.0 |
0.0 |
0.0 |
||||
Gross Margin (%) |
-5.1 |
4.9 |
48.3 |
43.7 |
40.1 |
||||
EBITDA Margin (%) |
-35.4 |
28.5 |
61.8 |
58.3 |
65.3 |
||||
Operating Margin (before GW and except.) (%) |
-60.0 |
-1.0 |
44.7 |
25.4 |
24.8 |
||||
BALANCE SHEET |
|||||||||
Fixed Assets |
|
395 |
395 |
581 |
738 |
897 |
|||
Intangible Assets |
107 |
69 |
105 |
153 |
201 |
||||
Tangible Assets |
157 |
201 |
327 |
436 |
547 |
||||
Investments |
130 |
125 |
149 |
149 |
149 |
||||
Current Assets |
|
212 |
348 |
289 |
201 |
140 |
|||
Stocks |
10 |
11 |
3 |
2 |
2 |
||||
Debtors |
105 |
138 |
138 |
138 |
138 |
||||
Cash |
97 |
149 |
149 |
61 |
0 |
||||
Other |
0 |
51 |
0 |
0 |
0 |
||||
Current Liabilities |
|
(91) |
(158) |
(158) |
(158) |
(158) |
|||
Creditors |
(55) |
(125) |
(125) |
(125) |
(125) |
||||
Short term borrowings |
(36) |
(33) |
(33) |
(33) |
(33) |
||||
Long Term Liabilities |
|
(269) |
(359) |
(372) |
(385) |
(424) |
|||
Debt |
0 |
(73) |
(72) |
(72) |
(97) |
||||
Provisions |
(269) |
(255) |
(267) |
(281) |
(295) |
||||
Other long term liabilities |
0 |
(32) |
(32) |
(32) |
(32) |
||||
Net Assets |
|
|
247 |
226 |
340 |
396 |
455 |
||
CASH FLOW |
|||||||||
Operating Cash Flow |
|
55 |
134 |
174 |
174 |
214 |
|||
Interest received |
1 |
1 |
1 |
1 |
1 |
||||
Tax |
0 |
0 |
0 |
0 |
0 |
||||
Capex |
(79) |
(144) |
(226) |
(264) |
(300) |
||||
Acquisitions/disposals |
0 |
0 |
51 |
0 |
0 |
||||
Equity financing |
63 |
0 |
0 |
0 |
0 |
||||
Dividends |
0 |
0 |
0 |
0 |
0 |
||||
Other |
(30) |
(8) |
0 |
0 |
0 |
||||
Net Cash Flow |
9 |
(18) |
0 |
(89) |
(85) |
||||
Opening net debt/(cash) |
(36) |
(61) |
(43) |
(44) |
44 |
||||
HP finance leases initiated |
0 |
0 |
0 |
0 |
0 |
||||
Other |
(0) |
(0) |
0 |
0 |
0 |
||||
Closing net debt/(cash) |
|
(61) |
(43) |
(44) |
45 |
130 |
|||
Source: Faroe Petroleum, Edison Investment Research
|
|||||||||||||||||||||||||||||||||||||||||||||||||||||
|
|
Research: Financials
The timing and size of transactions falling into the second half of FY18 has meant that Numis has achieved a record level of revenue but not reached our earlier estimate for FY18. The decision to undertake a significant investment in additional senior staff has also affected earnings, but is set to underpin the franchise and could help generate positive earnings surprises in future years. The deal pipeline is described as very strong so, subject to market conditions, we look for a rebound in earnings for FY19.
