Last close As at 05/08/2026
GBP0.83
▲ −1.60 (−1.90%)
Market capitalisation
GBP412m
Research: Real Estate
Custodian REIT (CREI) continued to grow its asset base, income earnings, and NAV per share in H118, with a well-controlled cost base. NAV and share price total returns were 4.2% and 5.3%, respectively. We have adjusted our estimates, primarily for property acquisitions and equity issuance since the first quarter, with a positive full year impact on forecast FY19 EPRA EPS (+6.0%) and DPS (+0.8%). Management’s focus is on secure income, to deliver the earnings to cover a sustainable long-term growth in dividends and generate less volatile returns. We believe the 9% premium to FY18e NAV is justified by the conservative gearing and one of the highest dividend yields in the sector.
Written by
Custodian REIT |
Diversified income focus |
Interim results |
Real estate |
5 December 2017 |
Share price performance
Business description
Analysts
|
|||||||||||||||||||||||||||||||||||||||||||||||||||
Custodian REIT (CREI) continued to grow its asset base, income earnings, and NAV per share in H118, with a well-controlled cost base. NAV and share price total returns were 4.2% and 5.3%, respectively. We have adjusted our estimates, primarily for property acquisitions and equity issuance since the first quarter, with a positive full year impact on forecast FY19 EPRA EPS (+6.0%) and DPS (+0.8%). Management’s focus is on secure income, to deliver the earnings to cover a sustainable long-term growth in dividends and generate less volatile returns. We believe the 9% premium to FY18e NAV is justified by the conservative gearing and one of the highest dividend yields in the sector.
Year end |
Net rental income (£m) |
EPRA EPS* (p) |
EPRA |
DPS |
P/NAV |
Yield |
03/16 |
18.0 |
6.80 |
102 |
6.25 |
1.14 |
5.4 |
03/17 |
25.7 |
6.59 |
104 |
6.35 |
1.11 |
5.5 |
03/18e |
32.1 |
6.81 |
106 |
6.45 |
1.09 |
5.6 |
03/19e |
35.4 |
7.30 |
109 |
6.55 |
1.06 |
5.6 |
Note: *EPRA EPS excludes revaluation gains/losses and other exceptional items.
H118 results: Income and NAV growth
H118 EPRA earnings of £12.0m or EPS of 3.4p compared with 3.0p per share in H117 and DPS paid in the period under review of 3.2p. IFRS earnings of £13.2m or EPS of 3.8p (H117: 3.0p) included net gains on investment properties of £1.3m. After dividends paid, NAV per share increased 1.1p to 104.9p compared with end-FY17, representing a 4.2% NAV total return in the six-month period. The portfolio value increased c 13% from end-FY17 to £474.3m, including 12 acquisitions for an aggregate consideration of £56.1m at an average 6.8% net initial yield. Three non-core assets were sold for an aggregate £6.1m, generating a gain of c £1m.
Income focused strategy
CREI has built a balanced portfolio of regional UK commercial real estate, diversified by sector, location, tenant and lease term. It is focused on lot sizes of less than £10m, where CREI believes it has a competitive advantage. It has low exposure to offices, a relatively high exposure to industrial, alternative sectors, and increasingly retail warehousing, plus its portfolio is institutional quality in all but lot size. Management focus is on maintaining high levels of occupancy and growing income through rental growth and accretive acquisitions. Dividends paid since IPO in March 2014 represent c 75% of the total return.
Valuation: Yield premium supports P/NAV
CREI’s 5.6% prospective yield, with dividends fully covered by earnings, places it towards the top of a broad universe of property investment companies and REITs. This provides support for the P/NAV ratio, which at 1.09x is also above average. The manager’s ability to source accretive acquisitions, the opportunities to actively manage the existing portfolio, and the prospect of continuing rental growth all suggest upside in income returns with further potential for capital growth.
Company description: Diversified income focus
Custodian REIT is a Main Market listed REIT focused on UK commercial property outside of London with a target lot size of sub-£10m. It is income focused, with the potential for capital growth and is committed to paying a high, sustainable, covered dividend while maintaining a conservative level of gearing. It is managed by Custodian Capital, a property management and investment business, regulated by the FCA. Custodian Capital is a subsidiary of Mattioli Woods, a specialist wealth management and employee benefits consultant, with £7.8bn of assets under management or advice as at May 2017. CREI listed in March 2014 and originates from syndicated funds, managed on behalf of Mattioli Woods clients by Custodian Capital over a 12-year period. These funds provided a seed portfolio of £95m to which the IPO proceeds added £55m. Subsequent placings have seen the market capitalisation increase to the current c £426m.
|
Exhibit 1: Portfolio sector split by income as at 1 November 2017 |
Exhibit 2: Portfolio regional split by income as at 1 November 2017 |
|
|
|
Source: Custodian REIT Factsheet November 2017 |
|
Exhibit 1: Portfolio sector split by income as at 1 November 2017 |
|
|
Source: Custodian REIT Factsheet November 2017 |
|
Exhibit 2: Portfolio regional split by income as at 1 November 2017 |
|
|
Source: Custodian REIT Factsheet November 2017 |
Including properties acquired since end-H118, the diversified portfolio comprises 144 properties, let to more than 275 different tenants, and spread across the UK with a value that is approaching £500m. It includes investments in all of the main commercial sectors: office, retail, industrial and distribution, as well as a range of alternatives, including leisure, car showrooms, trade counters and day nurseries.
Despite targeting smaller lot sizes where competition for assets can be lower, especially competition from larger investors, CREI seeks quality properties, which it describes as institutional grade, that it expects to maintain above average occupancy and income levels over the longer term.
Highlights of the FY18 interim results
We briefly review the highlights of the FY18 interim results below as many of the key numbers have previously been reported in the company’s monthly Factsheets. The period saw continued growth in the income generating asset base, substantially funded by ongoing equity issuance at a premium to NAV, with a conservative level of gearing maintained. 12 properties were acquired during H118 at an average net initial yield of c 6.8%, well above funding costs. Meanwhile, the changes to the management fee structure announced in June enhance the opportunity to benefit from scale economies. Ongoing charges during the period were c 1.2%, similar to FY17. Occupational demand remains healthy, supporting rental growth and low vacancy rates across the portfolio.
Exhibit 3: H118 financial summary and comparison
£000s unless otherwise stated |
H118 |
H117 |
FY17 |
Net rental income |
15,667 |
11,416 |
25,741 |
Administrative expenses |
(2,100) |
(1,726) |
(3,643) |
Operating profit before revaluations |
13,567 |
9,690 |
22,098 |
Revaluation of investment properties |
3,747 |
3,502 |
9,016 |
Costs of acquisitions |
(3,452) |
(3,759) |
(6,103) |
Profit on disposal |
979 |
128 |
1,599 |
Operating profit |
14,841 |
9,561 |
26,610 |
Net Interest |
(1,610) |
(1,266) |
(2,405) |
Profit before tax |
13,231 |
8,295 |
24,205 |
Taxation |
0 |
0 |
0 |
Profit after tax |
13,231 |
8,295 |
24,205 |
EPRA earnings |
11,957 |
8,424 |
19,693 |
IFRS EPS (p) |
3.8 |
3.0 |
8.1 |
EPRA EPS (p) |
3.4 |
3.0 |
6.6 |
DPS (declared) (p) |
3.225 |
3.175 |
6.350 |
IFRA & EPRA NAV per share (p) |
104.9 |
101.7 |
103.8 |
NAV total return |
4.2% |
3.3% |
8.5% |
Net LTV |
19.7% |
21.0% |
14.4% |
Source: Custodian REIT data
The financial highlights of H118 were:
■
IFRS earnings of £13.2m or 3.8p per share were 60% higher than the level reported in the prior year period and included £3.7m of gross revaluation gains and £1.0m of gains on disposal of three non-core properties in the half, substantially offset by the costs related to property acquisitions in the period.
■
On an EPRA basis, excluding revaluation and disposal gains and acquisition costs, earnings were £12.0m or 3.4p per share, 42% higher than in H117 and 6% above the level of H217.
■
Two quarterly dividends of 3.2p in aggregate were paid during the period and a dividend of 1.6125p was declared in respect of the quarter ending 30 September for payment on 30 November.
■
NAV per share (both IFRS and EPRA) was 104.9p as at 30 September, an increase of 1.1p or just over 1% from end-FY17.
■
The growth in NAV per share taken together with dividends per share generated a 4.2% NAV total return during the six-month period.
■
£56.1m was invested in 12 acquisitions during the period, before £3.4m in acquisition costs. Three non-core assets were sold with an aggregate consideration of £6.1m, c 20% above book value.
■
To satisfy continued investor demand and part-fund continuing acquisitions, a total of 21.8m new shares were issued under the block listing facility, generating proceeds of £24.8m before expenses of £0.3m. The average issue price of 113.6p represents an 11% premium to the weighted average dividend adjusted NAV.
■
Gross balance sheet debt was £98.5m at 30 September 2017, and taking into account unrestricted cash and equivalent balances and unamortised debt issuance costs the net loan to value ratio (LTV) was 19.7%.
CREI remains focused on maintaining and enhancing cash flow from the portfolio to support its objectives to pay fully covered dividends and secure sustainable growth. It believes that rental growth in regional markets will be a key driver of the company's performance, which it seeks to enhance through the deployment of new debt and equity and continued asset management of the portfolio.
Occupational demand remains healthy, supporting rental growth and occupancy across the portfolio. The manager sees no signs of an oversupply of property in the occupational market and observes that with a continued low level of development it is tightness of supply rather than excessive demand that is driving rental growth. Rental levels in many regional markets, it is argued, remain too low to bring forward material new development, which is a positive indicator for continued rental growth and should better insulate the market from potential shocks compared with previous rental growth cycles. In this environment, CREI sees continuing opportunities to invest. Competition for assets remains strong, requiring a disciplined approach to acquisitions, but with the interim results CREI said that it had agreed terms on £18.9m of properties and was considering an active pipeline of new acquisition opportunities as vendors prepare to conclude sales prior to the end of 2017. It has subsequently announced the acquisition of a retail asset in Worcester for a consideration of £5.54m.
Although the commercial property market is cyclical, the company believes that its strategy of securing sustainable income will support future dividends through any medium-term market volatility and deliver capital growth for shareholders over the long term despite the potential for cyclical impacts on NAV along the way.
In the following section we provide an update on the portfolio and operational performance.
Portfolio update: Growing in smaller lot sizes
Excluding the recent acquisitions, the portfolio was valued at £474.3m at the end of September 2017, consisting of 141 properties, let to 206 tenants, accounting for 255 individual tenancies. Income-based occupancy was 96.7% at 30 September with a weighted average unexpired lease term to first break (WAULT) of 5.75 years. The annualised rent potential was £35.4m. Since the period end, CREI has added a further three properties for an aggregate consideration of c £19.2m before acquisition costs, taking to the total portfolio size to close to £500m and adding c £1.4m in annualised rental income.
The 12 assets added to the portfolio in H118 are listed in Exhibit 4, along with the three assets that have been added since the period end. The aggregate H118 consideration of £56.1m, before costs of acquisition and adjusted for rent-free top-ups, represents an average net initial yield of c 6.8%.
Exhibit 4: Transaction activity year-to-date
PURCHASES |
|||||
Location |
Date |
Type |
Value (£m) |
Annual rent (£m) |
Net initial yield |
Gloucester |
02-May |
Retail warehouse |
4.7 |
0.37 |
7.41% |
York |
12-May |
Other |
3.9 |
0.24 |
5.75% |
Galashiels |
15-May |
Retail warehouse |
3.1 |
0.28 |
8.24% |
Plymouth |
15-May |
Retail warehouse |
7.5 |
0.54 |
6.74% |
Langley Mill |
12-Jun |
Industrial |
2.2 |
0.14 |
6.29% |
Eurocentral Scotland |
15-Jun |
Industrial |
4.8 |
0.35 |
6.91% |
Sheldon, Birmingham |
19-Jun |
Retail warehouse |
5.1 |
0.36 |
6.64% |
Total Q118 |
31.3 |
2.28 |
6.85% |
||
Stockport |
18-Jul |
Other |
8.8 |
0.66 |
6.99% |
Ashton-under-Lyne |
26-Jul |
Retail warehouse |
6.6 |
0.42 |
6.00% |
Salisbury |
28-Jul |
Other |
2.8 |
0.20 |
6.75% |
Plymouth |
07-Sep |
Retail warehouse |
5.5 |
0.40 |
6.79% |
Livingston |
03-Oct |
Industrial |
2.6 |
0.21 |
7.50% |
Total Q218 |
26.3 |
1.89 |
6.72% |
||
Total H118 |
57.6* |
4.17 |
6.79% |
||
Burton-Upon-Trent |
05-Oct |
Retail warehouse |
8.5 |
0.58 |
6.45% |
Cardiff |
05-Oct |
High street retail |
5.2 |
0.41 |
7.46% |
Worcester |
24-Nov |
High street retail |
5.5 |
0.38 |
6.50% |
Q318 to date |
19.2 |
1.37 |
6.74% |
||
FY18 year to date |
76.8 |
5.54 |
6.78% |
||
SALES |
|||||
Location |
Date |
Type |
Value (£m) |
Gain on disposal (£m) |
Book value |
Colchester |
18-Sep |
Retail |
4.25 |
0.7 |
3.55 |
Redcar |
18-Sep |
Retail |
0.60 |
0.1 |
0.50 |
Phoenix Park |
18-Sep |
Industrial |
1.20 |
0.2 |
1.00 |
FY18 year to date |
6.05 |
1.0 |
5.05 |
||
Source: Custodian REIT data. Note: The consideration for acquisitions is shown before adjustment for £1.5m in rent-free top-ups. Adjusted for this, the aggregate consideration in H118 was £56.1m.
The like-for-like portfolio valuation increase was c £3.7m (0.9% of the opening value), although this was substantially offset by c £3.4m of costs related to the properties acquired in the period, equivalent to an average 6.2% of the consideration. The strongest underlying gains were seen in industrial and retail warehouse properties. Asset management initiatives generated £1.7m of the £3.7m valuation uplift.
Exhibit 5: Summary of revaluation movement and acquisition costs
Sector |
Period end valuation (£m) |
Gross valuation movement (£m) |
Like for like valuation movement (%) |
Acquisition costs (£m) |
Industrial |
202.1 |
4.6 |
2.3% |
(0.6) |
Retail Warehouse |
80.2 |
1.3 |
1.9% |
(1.8) |
Other |
73.3 |
0.0 |
0.0% |
(1.0) |
High Street retail |
66.2 |
(1.9) |
-2.6% |
0.0 |
Office |
52.5 |
(0.3) |
-0.5% |
0.0 |
Portfolio total |
474.3 |
3.7 |
(3.4) |
Source: Custodian REIT data
The diverse nature of the portfolio, both by asset type and by geography, is shown in Exhibits 1 and 2. Exposure to office properties remains relatively low, reflecting the manager’s view that pricing often underestimates the rate of obsolescence. The strong existing exposure to industrial properties was beneficial during H118 and valuations in retail warehousing, the main area where exposure has been increasing, were also positive. Retail warehouse acquisitions represented £32.6m or 58% of the H118 total and the retail warehouse weight in the overall portfolio increased from 11% to 16%, and has increased further since period end. Retail warehousing vacancy rates are close to historical lows with development activity constrained by restricted planning policy among other factors, while retailers continue to target larger format stores, easy parking, and “click and collect” capability.
Financials
Our revised forecasts are shown in Exhibit 6. The main change is to incorporate the acquisitions and equity raising that has taken place since we last updated our forecasts, to which we have added an additional £10m of “notional” acquisitions from the acquisition pipeline, at a net initial yield of 6.8%, utilising already drawn debt facilities.
Our revenue forecasts previously included the seven Q118 acquisitions (£31.28m in consideration) shown in Exhibit 4. We now include the five additional acquisitions completed in Q218 (c £26.3m aggregate consideration and c £1.9m in annual rental income), the three acquisitions announced since period end (c £19.2m in consideration and c £1.4m in annual rental income), the three disposals discussed above (all made in Q218) and the notional further acquisitions.
We have also adjusted for the 26.34m new shares issued since end-Q118 under the block listing facility, generating proceeds of £30.2m at an average issue price of 114.5p per share.
Exhibit 6: Forecast revisions
Net rental income (£m) |
EPRA EPS (p) |
DPS (p) |
EPRA NAV/share (p) |
|||||||||
Old |
New |
Change (%) |
Old |
New |
Change (%) |
Old |
New |
Change (%) |
Old |
New |
Change (%) |
|
03/18e |
30.6 |
32.1 |
4.7 |
6.95 |
6.81 |
-2.0 |
6.45 |
6.45 |
0.0 |
106 |
106 |
-0.3 |
03/19e |
31.2 |
35.4 |
13.2 |
6.89 |
7.30 |
6.0 |
6.50 |
6.55 |
0.8 |
109 |
109 |
0.0 |
Source: Edison Investment Research
Our forecast net rental income increases by 4.7% in the current year and a larger 13.2% in FY19 as the acquired properties make a full year impact. The rental income increase in the current year (see below) is slightly more than offset by a revision to our forecast for interest costs, largely because the £35m of debt that was drawn in April of this year had a greater impact on average borrowing than we had allowed for in our modelling. Looking ahead, CREI has recently drawn an additional £15m in debt, the cost of which is included within next year’s forecast, although the proceeds are yet to be fully committed to income generating assets. The notional acquisitions assumed avoid a drag from unspent cash on earnings, an unlikely outcome given management’s pipeline of acquisition opportunities under offer.
Our FY19 EPRA EPS forecast increases to 7.30p leading us to raise our DPS expectation to 6.55p per share, a 90% pay-out of EPRA earnings, and growth of 1.6%.
With the interim results, CREI commented that it had c £57m in available funds to deploy on property acquisition opportunities as at 30 September 2017. This consisted of £7m in uncommitted cash and undrawn borrowing facilities of £50m. The £15m debt drawdown in early November represents the second tranche of a £50m 15-year fixed rate facility agreed in April 2017. In addition, CREI has a £35m revolving credit facility (RCF), which remains undrawn. Allowing for subsequent acquisitions and equity issuance, we estimate that c £47m of available funds remain, of which we have allocated just £10m to the notional acquisitions included in our forecasts.
CREI targets a conservative level of gearing and a net LTV of 25%. At 30 September it was 19.7% and the company recently indicated a level of 20.2%, which allows for recent acquisitions and equity issuance. The weighted average maturity of all of CREI’s agreed debt facilities is 10 years, with a 77% fixed rate, and the average cost is 3.1%.
Valuation
For the current financial year, CREI is targeting an aggregate annual DPS of 6.45p, paid in equal quarterly instalments, fully covered by earnings. This represents a dividend yield of 5.6%, covered 104% by our EPRA EPS forecast.
During the three and half years since listing (March 2014), CREI has paid 19.4625p in dividends in aggregate and has increased EPRA NAV per share from 98.2p at listing to 104.9p at 30 September 2017. This represents an aggregate total return of 26.6% over the period, or an annualised total return of 7.0%.
Exhibit 7: NAV total return
Opening NAV per share (p) |
FY15 |
FY16 |
FY17 |
H118 |
FY15 -H118 |
Dividends paid per share (p) |
98.2 |
101.3 |
101.5 |
103.8 |
98.2 |
Closing NAV per share (p) |
3.75 |
6.0875 |
6.425 |
3.2 |
19.4625 |
Total return in period |
101.3 |
101.5 |
103.8 |
104.9 |
104.9 |
7.0% |
6.2% |
8.6% |
4.20% |
26.6% |
Source: Company data
The focus on income is clear, with dividends paid representing 75% of the total return since IPO. Management’s strategy is aimed at sustainably growing fully covered DPS and our forecasts for FY19 look for a 3.1% increase to 6.65p per share, 90% of forecast EPRA EPS. Although the commercial property market as a whole has historically displayed significant volatility in returns, and is likely to do so again in the future, income returns have proven to be considerably more stable than capital values. It is this relative consistency of income returns, backed by high levels of occupancy, that CREI is targeting.
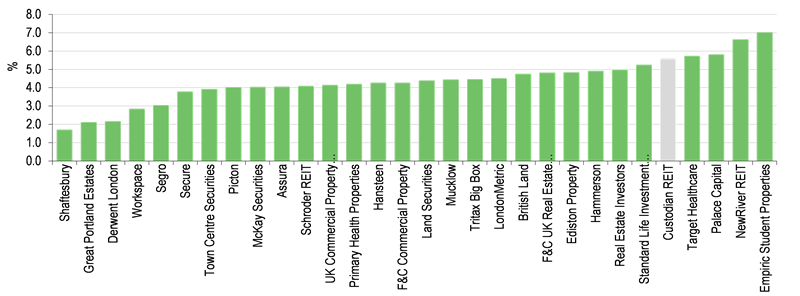
Turning to a comparison of CREI with other listed property vehicles, Exhibits 8 and 9 show prospective dividend yields and historical P/NAV ratios for a broad universe of property investment companies and REITs. This universe is quite diverse, including specialist investors such as the healthcare property REITs and others focused on long duration income streams, as well as a range of companies with more mainstream commercial portfolios and varying degrees of focuses on income and capital growth. There is no significant correlation between this yield and P/NAV data, although it is reasonable to believe that those companies that are expected to offer the most attractive returns over time (a combination of both dividend income and capital returns) are likely to command a higher P/NAV.
CREI’s prospective dividend yield places it towards the top of this broad group, and this provides support to the P/NAV ratio, which at 1.09x is also above average. The manager’s ability to continue to secure accretive asset acquisitions, the opportunities to actively manage the existing portfolio, and the prospect of continuing rental growth all suggest that CREI should be able to continue to grow income returns, with further potential for capital growth.
|
Exhibit 8: Universe by prospective dividend yield |
|
|
Source: Bloomberg, Edison Investment Research. Note: Data as at 4 December 2017. |
|
Exhibit 9: Universe by P/NAV |
|
|
Source: Bloomberg, Edison Investment Research. Note: Data as at 4 December 2017. |
Given the broad diversity of the investment vehicles shown in Exhibits 8 and 9, in the following table we show a sub-set of data for those companies that we think should be considered as the closest comparators to CREI. A similar picture emerges with CREI providing a higher than average yield and commanding a higher than average P/NAV.
Exhibit 10: Peer comparison
Price (p) |
Market cap |
NAVPS (p) |
DPS (p) |
P/NAV (x) |
Yield (%) |
|
EPIC |
114 |
149 |
111.3 |
5.50 |
1.02 |
4.8% |
F&C Commercial Property |
140 |
1,119 |
139.4 |
6.00 |
1.00 |
4.3% |
F&C UK Real Estate Investments |
104 |
249 |
100.1 |
5.00 |
1.03 |
4.8% |
Picton Property Income |
85 |
458 |
85.9 |
3.43 |
0.99 |
4.0% |
Regional REIT |
105 |
112 |
107.3 |
7.85 |
0.98 |
7.5% |
Schroders REIT |
60 |
312 |
65.7 |
2.48 |
0.92 |
4.1% |
Standard Life Investment Property |
91 |
355 |
86.0 |
4.76 |
1.05 |
5.3% |
Tritax Big Box |
143 |
1,953 |
133.3 |
6.40 |
1.08 |
4.5% |
UK Commercial Property Trust |
88 |
1,147 |
90.4 |
3.68 |
0.98 |
4.2% |
Average |
651 |
1.00 |
4.8% |
|||
Custodian REIT |
115 |
430 |
104.9 |
6.45 |
1.10 |
5.6% |
Source: Bloomberg, Edison Investment Research. Note: Data as at 4 December 2017. NAVPS data as last reported by companies.
Exhibit 11: Financial summary
Year end 31 March |
£000s |
2015 |
2016 |
2017 |
2018e |
2019e |
||
IFRS |
IFRS |
IFRS |
IFRS |
IFRS |
||||
PROFIT & LOSS |
||||||||
Gross rental income |
11,228 |
18,561 |
26,980 |
33,170 |
36,850 |
|||
Re-charge income |
342 |
451 |
630 |
673 |
765 |
|||
Total revenue |
|
|
|
11,570 |
19,012 |
27,610 |
33,842 |
37,615 |
Gross property expenses |
(715) |
(1,023) |
(1,869) |
(1,773) |
(2,239) |
|||
Net rental income |
|
|
|
10,855 |
17,989 |
25,741 |
32,069 |
35,376 |
Administrative expenses |
(2,327) |
(2,828) |
(3,643) |
(4,242) |
(4,403) |
|||
Operating Profit before revaluations |
|
|
|
8,528 |
15,161 |
22,098 |
27,828 |
30,973 |
Revaluation of investment properties |
6,083 |
3,031 |
9,016 |
8,247 |
9,500 |
|||
Costs of acquisitions |
(5,844) |
(5,768) |
(6,103) |
(5,347) |
0 |
|||
Profit on disposal |
269 |
56 |
1,599 |
979 |
0 |
|||
Operating Profit |
9,036 |
12,480 |
26,610 |
31,707 |
40,473 |
|||
Net Interest |
(289) |
(1,273) |
(2,405) |
(3,365) |
(3,750) |
|||
Profit Before Tax |
|
|
|
8,747 |
11,207 |
24,205 |
28,342 |
36,723 |
Taxation |
(2) |
0 |
0 |
0 |
0 |
|||
Profit After Tax |
8,745 |
11,207 |
24,205 |
28,342 |
36,723 |
|||
Net revaluation of investment property/costs of acquisition |
(239) |
2,737 |
(2,913) |
(2,900) |
(9,500) |
|||
Gains/(losses) on disposal |
(269) |
(56) |
(1,599) |
(979) |
0 |
|||
Profit After Tax (EPRA) |
8,237 |
13,888 |
19,693 |
24,463 |
27,223 |
|||
Average Number of Shares Outstanding (m) |
146.1 |
204.2 |
298.7 |
359.3 |
372.9 |
|||
IFRS EPS (p) |
|
|
|
5.99 |
5.49 |
8.10 |
7.89 |
9.85 |
EPRA EPS (p) |
|
|
|
5.64 |
6.80 |
6.59 |
6.81 |
7.30 |
Dividend per share (p) |
|
|
|
5.25 |
6.25 |
6.35 |
6.45 |
6.55 |
Pay-out ratio of EPRA EPS |
0.93 |
0.92 |
0.96 |
0.95 |
0.90 |
|||
BALANCE SHEET |
||||||||
Fixed Assets |
|
|
|
207,287 |
318,966 |
415,812 |
507,968 |
517,468 |
Investment properties |
207,287 |
318,966 |
415,812 |
507,968 |
517,468 |
|||
Other non-current assets |
0 |
0 |
0 |
0 |
0 |
|||
Current Assets |
|
|
|
1,921 |
9,973 |
12,996 |
15,473 |
19,549 |
Debtors |
1,072 |
4,518 |
7,189 |
4,711 |
5,099 |
|||
Cash |
849 |
5,455 |
5,807 |
10,761 |
14,449 |
|||
Current Liabilities |
|
|
|
(5,411) |
(8,165) |
(12,572) |
(13,925) |
(14,560) |
Creditors/Deferred income |
(5,411) |
(8,165) |
(12,572) |
(13,925) |
(14,560) |
|||
Short term borrowings |
0 |
0 |
0 |
0 |
0 |
|||
Long Term Liabilities |
|
|
|
(23,811) |
(65,714) |
(64,359) |
(114,153) |
(114,373) |
Long term borrowings |
(23,811) |
(65,143) |
(63,788) |
(113,582) |
(113,802) |
|||
Other long term liabilities |
0 |
(571) |
(571) |
(571) |
(571) |
|||
Net Assets |
|
|
|
179,986 |
255,060 |
351,877 |
395,362 |
408,083 |
NAV/share (p) |
101 |
102 |
104 |
106 |
109 |
|||
EPRA NAV/share (p) |
101 |
102 |
104 |
106 |
109 |
|||
CASH FLOW |
||||||||
Operating Cash Flow |
|
|
|
12,780 |
13,945 |
23,066 |
28,173 |
31,220 |
Net Interest |
(204) |
(1,285) |
(2,200) |
(3,207) |
(3,530) |
|||
Tax |
0 |
0 |
0 |
0 |
0 |
|||
Acquisition/disposal of investment property |
(129,788) |
(113,621) |
(92,126) |
(84,577) |
0 |
|||
Ordinary dividends paid |
(5,546) |
(12,220) |
(18,493) |
(22,870) |
(24,002) |
|||
Debt drawn/(repaid) |
23,811 |
41,700 |
(1,000) |
49,423 |
0 |
|||
Proceeds from shares issued (net of costs) |
99,796 |
76,087 |
91,105 |
38,013 |
0 |
|||
Other cash flow from financing activities |
||||||||
Net Cash Flow |
849 |
4,606 |
352 |
4,954 |
3,688 |
|||
Opening cash |
0 |
849 |
5,455 |
5,807 |
10,761 |
|||
Closing cash |
|
|
|
849 |
5,455 |
5,807 |
10,761 |
14,449 |
Debt |
(23,811) |
(65,143) |
(63,788) |
(113,582) |
(113,802) |
|||
Closing net debt |
|
|
|
(22,962) |
(59,688) |
(57,981) |
(102,821) |
(99,353) |
Net LTV |
11.4% |
19.1% |
14.4% |
20.8% |
19.7% |
Source: Company data, Edison Investment Research
|
|