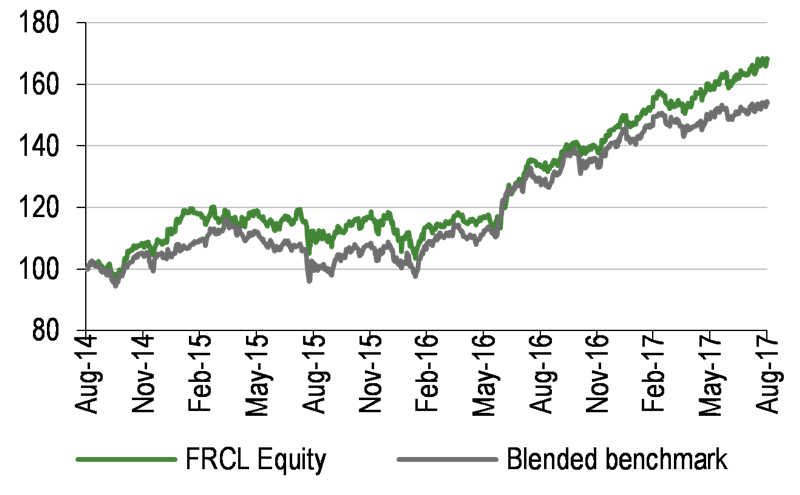
Foreign & Colonial Investment Trust (FRCL) is the world’s oldest investment fund, heading towards its 150th birthday. Since 2014, it has been managed by Paul Niven, aiming to generate long-term growth in capital and income from a very broad portfolio of primarily listed global equities, although c 7.5% is invested in private equity. The manager is benchmark aware, but takes active positions versus the index allocations. FRCL has a progressive dividend policy; the board has proposed another annual dividend increase for FY17, which will be the 47th consecutive year. The trust’s NAV has outperformed its benchmark over one, three and 10 years, while performing broadly in line over five years.
Foreign & Colonial Investment Trust |
Distinguished dividend history |
Investment trusts |
4 September 2017 |
Share price/discount performance
Three-year performance vs index
Gearing
Analysts
|
|||||||||||||||||||||||||||||||||||||||||||||||||||||||||||||||||||||||||||||||||||||||||||||
Foreign & Colonial Investment Trust (FRCL) is the world’s oldest investment fund, heading towards its 150th birthday. Since 2014, it has been managed by Paul Niven, aiming to generate long-term growth in capital and income from a very broad portfolio of primarily listed global equities, although c 7.5% is invested in private equity. The manager is benchmark aware, but takes active positions versus the index allocations. FRCL has a progressive dividend policy; the board has proposed another annual dividend increase for FY17, which will be the 47th consecutive year. The trust’s NAV has outperformed its benchmark over one, three and 10 years, while performing broadly in line over five years.
12 months ending |
Share price |
NAV |
Blended benchmark* (%) |
FTSE All-World (%) |
FTSE All-Share (%) |
FTSE World ex-UK (%) |
31/08/13 |
21.2 |
18.2 |
20.1 |
19.4 |
18.9 |
20.3 |
31/08/14 |
11.3 |
10.8 |
13.3 |
13.3 |
10.3 |
13.6 |
31/08/15 |
12.4 |
6.9 |
1.9 |
1.9 |
(2.3) |
2.9 |
31/08/16 |
18.7 |
22.3 |
26.7 |
26.7 |
11.7 |
27.6 |
31/08/17 |
26.2 |
21.4 |
19.7 |
19.7 |
14.3 |
19.9 |
Source: Thomson Datastream. Note: All % on a total return basis in GBP. *FRCL’s benchmark prior to 1 January 2013 was a composite of 40% FTSE All-Share and 60% FTSE World ex-UK indices and thereafter is the FTSE All-World index.
Investment strategy: Focus on capital and income
Niven structures FRCL’s broad portfolio based on his views about asset allocation, risk and the use of gearing. The fund adopts a variety of strategies using both internal and external managers, along with an allocation to private equity, which means that FRCL has thousands of underlying investments. On a geographic basis, the largest deviations versus the benchmark are overweight exposures to Europe ex-UK and emerging markets, and a meaningful underweight exposure to the US. Gearing of up to 20% of NAV is permitted; it was 7.0% at end-July 2016.
Market outlook: Valuations less attractive
Following a year of above average global equity returns in 2016 (particularly for UK-based investors as a result of sterling weakness), valuations are looking less attractive. On a forward P/E basis, some developed markets such as Europe, the UK and the US are trading at a c 20% premium to their 10-year averages. In such an environment, investors may be attracted to a well-established fund with a very diverse portfolio, including more attractively valued assets, such as Japanese and emerging market equities.
Valuation: Discount narrower than average
FRCL’s current 5.8% share price discount to cum-income NAV is narrower than the averages of the last one, three, five and 10 years (range of 8.1% to 9.4%). There is scope for the discount to narrow further if the manager continues to build on his positive investment track record. Meanwhile, the board actively manages the discount by repurchasing shares when the discount exceeds 7.5% in normal market conditions. FRCL has a distinguished dividend history; FY17 is on course to become the 47th consecutive year of higher annual dividends.
Exhibit 1: Trust at a glance
Investment objective and fund background |
Recent developments |
||||||||||||||||||||||||||||||||||||||||||||||||||||||||||||||||||||||
FRCL’s investment objective is to secure long-term growth in capital and income through investing primarily in an internationally diversified portfolio of listed equities, as well as unlisted securities and private equity, with the use of gearing. FRCL’s benchmark is the FTSE All-World Index. |
■ 27 July 2017: Six-month results ending 30 June 2017. NAV TR +9.1% versus benchmark TR +6.3%. Share price TR +8.7%. ■ 25 July 2017: Appointment of Beatrice Hollond as an independent non-executive director with effect from 1 September 2017. ■ 23 June 2017: Announcement of first interim dividend of 2.5p (+6.4% year-on-year). ■ 7 March 2017: Annual results for the year ended 31 December 2016. NAV TR +23.9% versus benchmark TR +29.6%. Share price TR +23.7%. |
||||||||||||||||||||||||||||||||||||||||||||||||||||||||||||||||||||||
Forthcoming |
Capital structure |
Fund details |
|||||||||||||||||||||||||||||||||||||||||||||||||||||||||||||||||||||
AGM |
April 2018 |
Ongoing charges |
0.79% |
Group |
BMO Global Asset Mgmt (BMO) |
||||||||||||||||||||||||||||||||||||||||||||||||||||||||||||||||||
Final results |
March 2018 |
Net gearing |
7.0% |
Manager |
Paul Niven |
||||||||||||||||||||||||||||||||||||||||||||||||||||||||||||||||||
Year end |
31 December |
Annual mgmt fee |
0.365% |
Address |
Exchange House, Primrose Street |
||||||||||||||||||||||||||||||||||||||||||||||||||||||||||||||||||
Dividend paid |
Feb, May, Aug, Nov |
Performance fee |
None |
||||||||||||||||||||||||||||||||||||||||||||||||||||||||||||||||||||
Launch date |
1868 |
Trust life |
Indefinite |
Phone |
+44 (0)800 136 420 |
||||||||||||||||||||||||||||||||||||||||||||||||||||||||||||||||||
Continuation vote |
None |
Loan facilities |
Various – see page 7 |
Website |
|||||||||||||||||||||||||||||||||||||||||||||||||||||||||||||||||||
Dividend policy and history |
Share buyback policy and history |
||||||||||||||||||||||||||||||||||||||||||||||||||||||||||||||||||||||
FRCL pays dividends quarterly. The 2016 total dividend of 9.85p represents the 46th consecutive annual increase. |
Renewed annually, FRCL has authority to purchase up to 14.99% and allot up to 5% of issued share capital. |
||||||||||||||||||||||||||||||||||||||||||||||||||||||||||||||||||||||
|
|
||||||||||||||||||||||||||||||||||||||||||||||||||||||||||||||||||||||
Shareholder base (as at 31 August 2017) |
Strategy allocation (as at 30 June 2017) |
||||||||||||||||||||||||||||||||||||||||||||||||||||||||||||||||||||||
|
|
||||||||||||||||||||||||||||||||||||||||||||||||||||||||||||||||||||||
Top 10 holdings (as at 31 July 2017) |
|||||||||||||||||||||||||||||||||||||||||||||||||||||||||||||||||||||||
|
|||||||||||||||||||||||||||||||||||||||||||||||||||||||||||||||||||||||
Source: Foreign & Colonial Investment Trust, Edison Investment Research, Bloomberg, Morningstar. Note: *N/A where not in July 2016 top 10. **Formerly known as Google.
Market outlook: Equities less attractive since re-rating
Exhibit 2 (left-hand side) shows the meaningful outperformance of global versus UK equities over the last five years. Over the last several months, UK investors in overseas equities have benefited from sterling weakness. In general, equities have rallied strongly following stock market corrections in early 2016; this re-rating has led to equity valuations looking less attractive. On a forward P/E multiple basis, some developed markets such as Europe, the UK and the US are trading at a c 20% premium to their averages of the last 10 years (Exhibit 2, right-hand side). For investors seeking long-term growth in capital and income, a well-established fund investing in a range of asset classes, including an allocation to regions where valuations are less extended, such as Japan and emerging markets, may be of interest.
|
Exhibit 2: Equity performances and valuations (last five years) |
|||||||||||||||||||||||||||||||||||||||||||
Performance of UK and world indices (£-adjusted) |
Datastream indices forward P/E valuations (x) |
||||||||||||||||||||||||||||||||||||||||||
|
|
||||||||||||||||||||||||||||||||||||||||||
|
Source: Thomson Datastream, Edison Investment Research. Note: Data as at 1 September 2017. |
|||||||||||||||||||||||||||||||||||||||||||
Fund profile: Oldest investment trust in the world
FRCL was launched in 1868, so is approaching its 150th birthday; it is the oldest collective investment fund in the world. The trust has a progressive dividend policy and in FY17 is on track for its 47th consecutive annual dividend increase. FRCL has been managed by Paul Niven since July 2014; he is only the third manager of the trust since 1969. Niven aims to generate long-term growth in capital and income and attractive risk-adjusted returns from a globally diversified portfolio of listed equities, unlisted securities and private equity. Since 1 January 2013, FRCL has been benchmarked against the FTSE All-World index, rather than a composite of the FTSE World ex-UK and FTSE All-Share indices, reflecting a lower weighting to UK equities. There are no specific geographic or sector limits for listed equities. Up to 5% of the portfolio, at the time of acquisition, may be directly invested in unlisted securities, which require specific board approval. No single investment may exceed 10% and a maximum 5% may be in investment funds managed by BMO Global Asset Management, which also requires board approval. Shareholder approval would be required if long-term exposure to private equity were to exceed 20%. Gearing of up to 20% of NAV is permitted; at end-July 2017 net gearing was 7.0%.
The fund manager: Paul Niven
The manager’s view: Reflation trade is over
The manager says that H117 was a good period for risk assets in general, including multiple new stock market highs in both the US and the UK. He suggests that the largest macro surprise was moderating inflation in the US, which led to bond yields falling as interest rate rise expectations lessened. He says that six to eight months ago, the general belief was that the global outlook for 2017 was for higher inflation and higher interest rates. While there has been a synchronised global economic recovery, he believes that the reflation trade in the stock market is over, evidenced by weakness in energy stocks year to date. In the US there are only two out of 11 sectors that are underwater in 2017 and energy is the weakest performing area. However, although the euphoria following President Trump’s election in late 2016 appears to have run its course, stock markets are continuing to move higher in response to better than expected corporate earnings.
Niven comments that generally assets are expensive, including equities, bonds and private equity. He says that there is a lot of ‘dry powder’ (cash awaiting investment) in the private equity space and a lot of bullishness surrounding the asset class. The manager says that several large investment houses have raised a phenomenal amount of capital and so are looking for ‘big-ticket’ investments. He believes that there are better private equity valuations further down the market cap scale, the area where FRCL is targeting its private equity direct investment.
Asset allocation
Investment process: Diversified global portfolio
Niven aims to generate long-term growth in capital and income from a broad portfolio that is diversified by geography and sector. He is benchmark aware, but does not follow the FTSE All-World index allocations. FRCL is constructed with inputs from both BMO’s specialist teams and third-party managers, which undergo regular formal reviews. Historically, private equity exposure was achieved via HarbourVest and Pantheon funds of funds, providing global exposure across sectors and vintage years. However, current and future investments are made directly in primary and secondary funds as well as co-investments. During H117, FRCL continued its more focused and opportunistic investment approach towards private equity investments with £23.8m in new commitments. As existing fund-of-fund investments are run off, there will be significant savings in agency fees; in 2016, FRCL paid £4.6m to HarbourVest and Pantheon. The manager highlights that FRCL’s diversified investment approach not only reduces risks, but generates lower volatility of investment returns versus its peers, which is helped by its private equity exposure.
Current portfolio positioning
Exhibit 3: FRCL strategy allocations (as at 30 June 2017)
Strategy |
Primary manager |
Approach |
% allocated |
Holdings |
Active share (%)** |
Regional |
|||||
US growth |
T. Rowe Price |
Growth |
16.5 |
127 |
71 |
US value |
Barrow, Hanley, Mewhinney & Strauss |
Value |
15.7 |
46 |
77 |
Europe |
BMO Global Asset Management |
Fundamental quality value |
13.3 |
42 |
75 |
UK |
BMO Global Asset Management |
Quality growth |
5.7 |
44 |
52 |
Japan |
BMO Global Asset Management |
Quality GARP* |
8.3 |
50 |
77 |
Emerging markets |
LGM |
Long-term quality |
10.0 |
41 |
95 |
Global |
|||||
Income |
BMO Global Asset Management |
Systematic income GARP* |
10.6 |
66 |
89 |
Smaller companies |
BMO Global Asset Management |
Core quality growth |
3.7 |
82 |
97 |
Multi-manager |
BMO Global Asset Management |
Fund of funds |
7.8 |
23 |
67 |
Private equity |
|||||
Funds |
HarbourVest/Pantheon |
Fund of funds |
6.4 |
16 |
N/A |
Direct |
BMO Global Asset Management |
Direct |
1.0 |
12 |
N/A |
Source: Foreign & Colonial Investment Trust, Edison Investment Research. Note: *GARP is growth at a reasonable price. **Active share is a measure of how a portfolio differs from an index (0% is full index replication and 100% is no overlap with the benchmark).
While the number of holdings in Exhibit 3 totals c 550, given FRCL’s fund and private equity holdings, the number of underlying companies runs into the thousands. The manager notes the lower than average active share in the UK strategy and says that this will increase over time. In terms of geographic exposure, FRCL’s regional weightings are broadly similar to end-2016 (with the exception of 1.0pp higher exposure to emerging markets), with overweight positions in Europe ex-UK, emerging markets, Japan and UK and underweight positions in the North American region, where the manager considers that US equity valuations are relatively unattractive, and the small developed Pacific region, where he finds the large commodity exposure and equity valuations unappealing. The manager says the overweight position in the UK is due to the dominance of multinational companies that generate the majority of their earnings overseas; he is more bearish on the UK economy than the UK stock market, and says that over time the UK allocation will likely decline, as he considers that there are better investment opportunities elsewhere.
Exhibit 4: Geographic weightings (including private equity, % unless stated)
Portfolio end-July 2017 |
Portfolio end- July 2016 |
Change (pp) |
Index weight |
Active weight vs index (pp) |
Trust weight/ index weight (x) |
|
North America |
45.7 |
45.7 |
0.1 |
54.4 |
(8.7) |
0.8 |
Europe ex-UK |
20.1 |
18.9 |
1.3 |
15.4 |
4.7 |
1.3 |
Emerging markets |
12.8 |
12.3 |
0.5 |
9.5 |
3.3 |
1.3 |
Japan |
10.1 |
9.3 |
0.8 |
8.4 |
1.7 |
1.2 |
UK |
7.7 |
8.6 |
(0.9) |
6.2 |
1.5 |
1.2 |
Developed Pacific |
3.2 |
3.3 |
(0.1) |
6.1 |
(2.9) |
0.5 |
Liquidity |
0.4 |
2.0 |
(1.6) |
0.0 |
0.4 |
N/A |
100.0 |
100.0 |
100.0 |
Source: Foreign & Colonial Investment Trust, Edison Investment Research
Performance: Improving nearer-term performance
Absolute returns are shown in Exhibit 5.Over the past 12 months, sterling weakness has enhanced the value of overseas assets for UK-based investors. Over this period, FRCL’s NAV and share price total returns of 21.4% and 26.2% are meaningfully ahead of the benchmark’s 19.7% total return.
|
Exhibit 5: Investment trust performance to 31 August 2017 |
|
Price, NAV and benchmark total return performance, one-year rebased |
Price, NAV and benchmark total return performance (%) |
|
|
|
Source: Thomson Datastream, Edison Investment Research. Note: Three-, five- and 10-year performance figures annualised. |
|
In H117 ending 30 June 2017, FRCL’s NAV and share price total returns of 9.1% and 8.7% respectively were comfortably ahead of the benchmark’s 6.3% total return. Most regional strategies outperformed their respective indices, including emerging markets (+6.2pp, which also generated the highest returns of 18.9%) and the US (+3.1pp). The European strategy returned 12.7%, which was just 0.1pp behind its regional benchmark. From an asset allocation perspective, overall investment performance was boosted by underweight exposure to the US as the dollar declined by c 4% on a trade-weighted basis. The 7.4% exposure to private equity detracted from performance given that assets are valued with a three-month lag and equity markets rallied over the period.
|
Exhibit 6: Share price and NAV total return performance, relative to indices (%) |
|||||||
|
One month |
Three months |
Six months |
One year |
Three years |
Five years |
10 years |
Price relative to blended benchmark |
0.5 |
1.7 |
4.6 |
5.5 |
9.0 |
7.9 |
11.8 |
NAV relative to blended benchmark |
(0.4) |
0.6 |
2.2 |
1.5 |
2.7 |
(1.1) |
2.0 |
Price relative to FTSE All-World |
0.5 |
1.7 |
4.6 |
5.5 |
9.0 |
8.6 |
3.8 |
NAV relative to FTSE All-World |
(0.4) |
0.6 |
2.2 |
1.5 |
2.7 |
(0.5) |
(5.3) |
Price relative to FTSE All-Share |
1.8 |
5.6 |
4.7 |
10.4 |
35.0 |
38.7 |
46.2 |
NAV relative to FTSE All-Share |
0.9 |
4.4 |
2.2 |
6.2 |
27.2 |
27.0 |
33.4 |
Price relative to FTSE World ex-UK |
0.5 |
1.7 |
5.0 |
5.3 |
7.0 |
5.5 |
(0.1) |
NAV relative to FTSE World ex-UK |
(0.4) |
0.6 |
2.5 |
1.3 |
0.9 |
(3.4) |
(8.9) |
|
Source: Thomson Datastream, Edison Investment Research. Note: Data to end-August 2017. Geometric calculation. Benchmark prior to 1 January 2013 was a composite of 40% FTSE All-Share and 60% FTSE World ex-UK indices (now FTSE All-World index). |
|||||||
FRCL’s relative returns are shown in Exhibit 6. Following improved recent performance, the trust’s NAV total return is now ahead of the benchmark over three years and most of the shorter periods shown. It is modestly behind the benchmark over five years and ahead over 10 years. Over one, three, five and 10 years FRCL’s share price total return is higher than its NAV total return, which has resulted in a narrower discount over time. For UK-based investors, it is interesting to highlight its significant outperformance versus the FTSE All-Share index over one, three, five and 10 years.
|
Exhibit 7: NAV total return performance relative to benchmark over five years |
|
|
Source: Thomson Datastream, Edison Investment Research |
Discount: Meaningful narrowing in recent months
FRCL’s current 5.8% share price discount to cum-income NAV is narrower than the 8.1% average of the last 12 months (range of 5.0% to 11.3%, which occurred during a period of uncertainty ahead of the US presidential election). The discount is also narrower than the averages of the last three, five and 10 years of 8.4%, 9.2% and 9.4% respectively.
|
Exhibit 7: Share price premium/discount to NAV (including income) over three years (%) |
|
|
Source: Thomson Datastream, Edison Investment Research |
FRCL’s board actively manages the discount by purchasing shares when the discount exceeds 7.5% in normal market conditions. This policy was changed in May 2015, before which the board targeted a 10.0% discount; it aspires to a discount narrower than 7.5% over time. The manager comments that the rate of share repurchases is much lower than in 2016, but is ongoing (Exhibit 1).
Capital structure and fees
FRCL is a conventional investment trust with one class of share; there are currently 542.9m ordinary shares in issue, with a further 19.0m held in treasury. Gearing of up to 20% of NAV is permitted; at end-July 2017 it was 7.0%, which is towards the low end of the historical range. FRCL has a range of borrowing arrangements diversified by currency, lender and maturity profile; this includes a £100m short-dated revolving credit facility with a £100m accordion feature, which provides flexibility and reduces refinancing risk. At end-H117, the trust’s weighted average cost of debt was c 2.8%. This is considerably lower than the 7%+ cost in 2014 before the maturity of an 11.25% longstanding debenture. FRCL’s debt profile is as follows: ¥6.6bn at 2.50% and $80m at 4.00% maturing in 2019; €72m at 1.69% in 2022; £25m at 2.80% in 2028; £50m at 3.16% in 2031 and a £0.6m 4.25% perpetual debenture. The manager says that he thought borrowing rates looked attractive 12 months ago, but they have since become even more so, while spreads are also tighter than a year ago.
BMO Global Asset Management is paid an annual management fee of 0.365% of market cap, and FRCL also pays direct fees to its external managers. The manager believes that the trust’s fee structure is competitive with its peers, especially given that part of the asset management function is outsourced. The ongoing charge in FY16 was 0.79%, broadly similar to 0.80% in FY15, and includes agency fees paid to private equity managers, which are expected to decline going forward.
Dividend policy and record
FRCL has a distinguished dividend history. The board has announced its intention to grow the annual dividend again in FY17; this will be the 47th consecutive year. It aims to increase dividends in real terms and, over the last 10 years, the dividend has compounded at an annual rate of 6.4%, which is significantly higher than the UK inflation rate over the period.
In FY16, the annual dividend was 9.85p, which was 2.6% higher than the previous financial year and higher than the 1.6% rise in the Consumer Price Index. The FY16 dividend was fully covered by income and at the year-end, FRCL’s revenue reserve was c 1x the annual dividend. The trust’s current dividend yield is 1.6%.
Peer group comparison
FRCL is a member of the AIC Global sector. In Exhibit 8 we highlight the peers with less than 25% exposure in the UK. With a market cap above £3bn, FRCL is the second largest trust in the selected peer group. Its NAV total returns are below the weighted average over the periods shown; however, it should be noted that the average is skewed by the largest trust, Scottish Mortgage, which has the highest total returns over all periods shown. In addition, the manager comments that some of the peers have particular investment biases, which has led to better relative performance. FRCL ranks tenth, sixth and sixth out of 16 funds over one, three and five years respectively, and ranks fifth out of 15 funds over 10 years.
Within the selected peer group there is a wide range of discounts; FRCL’s is modestly above the weighted average. Its ongoing charge and gearing are broadly average, but FRCL has an above-average dividend yield, 0.3pp higher than the weighted average.
Exhibit 8: Selected peer group as at 1 September 2017*
% unless stated |
Market cap £m |
NAV TR |
NAV TR |
NAV TR |
NAV TR |
Discount (ex-par) |
Ongoing charge |
Perf. fee |
Net gearing |
Dividend yield (%) |
Foreign & Colonial Investment Trust |
3,354.8 |
21.4 |
58.7 |
107.9 |
139.1 |
(4.7) |
0.8 |
No |
107 |
1.6 |
Alliance Trust |
2,531.6 |
23.3 |
58.7 |
99.5 |
125.1 |
(5.8) |
0.5 |
No |
105 |
1.8 |
Bankers |
1,022.5 |
23.6 |
55.6 |
109.4 |
138.1 |
(2.0) |
0.5 |
No |
102 |
2.0 |
British Empire |
830.2 |
27.6 |
44.2 |
83.0 |
98.0 |
(9.8) |
0.9 |
No |
103 |
1.7 |
Caledonia Investments |
1,511.9 |
13.8 |
39.9 |
92.1 |
86.7 |
(15.8) |
1.1 |
No |
100 |
2.0 |
Edinburgh Worldwide |
316.7 |
26.9 |
64.7 |
124.0 |
167.8 |
(6.9) |
0.9 |
No |
107 |
0.0 |
EP Global Opportunities |
139.7 |
21.8 |
43.4 |
104.2 |
119.5 |
(4.8) |
1.0 |
No |
100 |
1.4 |
F&C Global Smaller Companies |
776.2 |
20.0 |
56.3 |
132.4 |
203.5 |
1.6 |
0.6 |
No |
104 |
0.9 |
F&C Managed Portfolio Growth |
66.1 |
22.0 |
39.2 |
91.3 |
|
0.3 |
1.0 |
Yes |
100 |
0.0 |
Hansa Trust class 'A' |
223.8 |
11.9 |
13.7 |
40.2 |
51.9 |
(29.8) |
1.1 |
No |
100 |
1.7 |
Lazard World Trust Fund |
136.6 |
29.3 |
63.9 |
107.5 |
62.3 |
(6.5) |
1.4 |
Yes |
100 |
3.5 |
Majedie Investments |
145.6 |
14.6 |
50.0 |
86.2 |
12.0 |
(17.5) |
1.4 |
No |
118 |
3.2 |
Martin Currie Global Portfolio |
226.9 |
19.5 |
50.7 |
95.1 |
132.3 |
(0.1) |
0.7 |
Yes |
100 |
1.7 |
Mid Wynd International Investment |
151.7 |
20.6 |
70.9 |
116.6 |
177.0 |
1.1 |
0.8 |
No |
102 |
1.0 |
Monks |
1,524.5 |
31.2 |
66.5 |
107.6 |
124.9 |
(1.9) |
0.6 |
No |
107 |
0.2 |
Scottish Mortgage |
6,079.7 |
40.7 |
93.2 |
205.7 |
274.9 |
1.9 |
0.4 |
No |
108 |
0.7 |
Weighted average |
28.3 |
67.3 |
135.9 |
174.2 |
(3.5) |
0.7 |
106 |
1.3 |
||
FRCL rank in sector (out of 16) |
2 |
10 |
6 |
6 |
5 |
8 |
9 |
3 |
9 |
Source: Morningstar, Edison Investment Research. Note: *Performance to 31 August 2017. TR = total return. Net gearing is total assets less cash and equivalents as a percentage of net assets.
The board
Following the retirement of Stephen Burley at the April 2017 AGM after nine years’ service, there are currently seven directors on the board of FRCL; all are non-executive and independent of the manager. Chairman Simon Fraser was appointed in September 2009 and has held his current role since May 2010. Senior independent director Sir Roger Bone was appointed in March 2008; Jeffrey Hewitt in September 2010; Sarah Arkle and Nicholas Moakes in March 2011; Francesca Ecsery in August 2013; and Edward Knapp in July 2016. On 25 July 2017, the board announced the appointment of another independent, non-executive director, effective 1 September 2017 – Beatrice Hollond has a background in asset management and is currently on the boards of Brown Advisory, Telecoms Plus, M&G Group, Henderson Smaller Companies Investment Trust and Templeton Emerging Markets Investment Trust. Hollond is also chairman of Millbank Investment Managers and Keystone Investment Trust.
|
|
Research: Industrials
Management’s focus on high-margin products and services for OEMs across a very broad range of applications in the clean tech, life science and green tech sectors resulted in strong growth in operating profit for m-u-t during H117. This result follows on from a record-beating FY16. The trend is set to continue, with management raising FY17 guidance.