Last close As at 06/08/2026
GBP2.23
— 0.00 (0.00%)
Market capitalisation
GBP156m
Research: Financials
Helios Underwriting (Helios) delivered strong EPS of 21.6p in FY23, from a loss of 3.1p in FY22, ahead of our 14.7p forecast. On 7 June, the company announced that CEO Martin Reith had stepped down, with Michael Wade taking over as executive chair. Mr Reith had driven a strategy of investment in internal capabilities and Lloyd’s of London (Lloyd’s) capacity expansion via tenancy capacity and promotor activities. While Helios will still pursue select capacity acquisition, indications are that future strategy will increasingly be focused on extracting value from the existing portfolio, with greater shareholder distributions through dividends and share buybacks. We have updated our forecasts based on the FY23 performance and underwriting outlook, paring back our near-term capacity growth forecasts but allowing for a more liberal distribution policy. We have cut our EPS forecasts by 5.5% in FY24 and 1.9% in FY25, and introduce FY26 forecasts. Our valuation is unchanged at 280p/share, supported by higher distributions.
Helios Underwriting |
Delivery into a strong underwriting cycle |
FY23 results |
Insurance |
5 July 2024 |
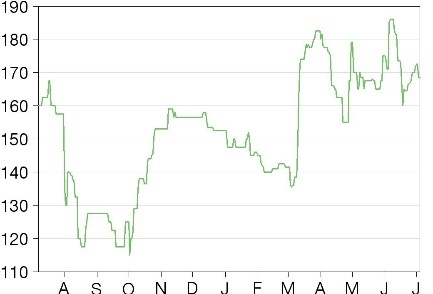
Share price performance
Business description
Next events
Analyst
Helios Underwriting is a research client of Edison Investment Research Limited |
||||||||||||||||||||||||||||||||||||||||||
Helios Underwriting (Helios) delivered strong EPS of 21.6p in FY23, from a loss of 3.1p in FY22, ahead of our 14.7p forecast. On 7 June, the company announced that CEO Martin Reith had stepped down, with Michael Wade taking over as executive chair. Mr Reith had driven a strategy of investment in internal capabilities and Lloyd’s of London (Lloyd’s) capacity expansion via tenancy capacity and promotor activities. While Helios will still pursue select capacity acquisition, indications are that future strategy will increasingly be focused on extracting value from the existing portfolio, with greater shareholder distributions through dividends and share buybacks. We have updated our forecasts based on the FY23 performance and underwriting outlook, paring back our near-term capacity growth forecasts but allowing for a more liberal distribution policy. We have cut our EPS forecasts by 5.5% in FY24 and 1.9% in FY25, and introduce FY26 forecasts. Our valuation is unchanged at 280p/share, supported by higher distributions.
Year end |
Revenue (£m) |
PBT* |
EPS* |
DPS |
P/E |
Yield |
12/23 |
212.9 |
22.1 |
21.6 |
6.0 |
7.9 |
3.5 |
12/24e |
341.3 |
24.5 |
24.8 |
14.3 |
6.9 |
8.4 |
12/25e |
428.2 |
36.4 |
36.9 |
28.2 |
4.6 |
16.5 |
12/26e |
465.8 |
32.3 |
32.7 |
28.0 |
5.2 |
16.4 |
Note: *PBT and EPS are normalised, excluding amortisation of acquired intangibles, exceptional items and share-based payments.
CEO departure could refocus strategic direction
After the departure of the CEO on 7 June, Helios commenced the search for a replacement. Mr Reith leaves the company with strengthened capabilities, with key additions to the team and the establishment of the portfolio evaluation and monitoring (PEM) initiative, as well as significantly higher levels of Lloyd’s capacity, increasing Helios’s participation in the current robust underwriting environment. The strategy of driving strong increased participation in Lloyd’s syndicates, both as promoter and acquirer, is under review and looks to be pivoting in favour of extracting value from the existing portfolio and increasing shareholder distributions.
Favourable outlook supported by FY23 results
Excellent FY23 syndicate underwriting profit was driven by a much stronger-than-expected 2023 year of account (YOA) due to a benign catastrophe environment, supporting a combined ratio of 86% versus 90% forecast. We forecast an increase in return on capacity (RoC) from 6.8% in FY23 (2021 YOA close-out) to 12.2% in FY24, peaking at 17.1% in FY25, with EPS growth of 14.9% to 24.8p in FY24 and 48.9% growth to 36.9p in FY25, and returns on net asset value (NAV) of 18.9% and 20.1%, respectively. We forecast a downturn in the underwriting cycle from FY26.
Valuation: Unchanged at 280p/share
Our valuation for Helios is based on an over-the-cycle return on NAV (RoNAV) of 14.2%, which results in a value of 280p/share (unchanged from our previous valuation), a 48% premium to FY23 NAV of 189p/share (28% premium to FY24 forecast NAV). Our valuation is 65% ahead of the current share price.
Strong FY23 results support forecasts
We have flagged improved operating results for Helios since our February 2022 initiation and, while the FY23 results were very strong, they have not meaningfully shifted the needle in terms of our forecasts and valuation. In fact, we have reduced our EPS forecasts by 5.5% to 24.8p in FY24 and by 1.9% to 36.9p in FY25 due to higher operating expenses than we had expected. The Lloyd’s underwriting environment remains very healthy and provides strong support for our forecasts.
A key metric that demonstrates this is RoC, which is only determined once a YOA closes out after three years, with the latest close-out being for the 2021 YOA. Helios delivered a 6.8% RoC for the 2021 YOA, which compares to 3.6% for 2020, 3.3% for 2019 and negatives for the two years prior to that. The mid-point estimates (provided by Lloyd’s syndicates based on observed experience) are already pointing to an RoC in FY24 for the 2022 YOA of 8.1%, although we forecast a further improvement to 12.2%. Following the super start for the 2023 YOA (an RoC contribution in its first year of 2.5%, where negative RoCs are usually delivered), we forecast a top-of-the-cycle RoC for this YOA in FY25 of 17.1%. On the back of this, we forecast RoNAV of 18.9% in FY24 and 20.1% in FY25, including an allowance for the revaluation of on-balance-sheet capacity in line with expected pre-emptions (from existing syndicate participation). Without these revaluations (allowing for EPS impact only), the forecast returns are 12.6% in FY24 and 16.1% in FY25.
After FY25, the outlook becomes more uncertain and a downturn in the underwriting cycle becomes more likely. While it is possible to see an extended hard underwriting cycle, especially considering record premium increases experienced over recent years, high margins invite competition and increased capital allocation, and we have opted to allow for a soft landing from FY26 onwards. As such, we forecast a moderation for the 2024 YOA RoC to 13.3%, an increase in combined ratio from 89.2% in FY25 to 91.4% in FY26 and an EPS decline of 11.2% from 36.9p in FY25 to 32.7p. This manifests in a decline in RoNAV to 15.1% (or 12.5% without capacity revaluation).
Helios’s stated strategy before its CEO’s departure was predicated on increased participation in the current hard underwriting cycle by actively deploying capital into existing syndicate opportunities, seeking and promoting new syndicate opportunities and extracting additional value from its growing capacity. The latter included its ‘rental capacity’ initiative aimed at generating fee income from third parties (see our January update note) on its growing capacity. We had taken a wait-and-see approach in allowing for this in our forecasts, expecting more clarity following the FY23 results.
In its announcement of the departure of its CEO, Helios also indicated that it would not proceed with establishing a ‘follow-only’ syndicate at Lloyd’s, which was part of this third-party initiative. Its future strategy is still under review, but indications are that it will focus less on strong capacity growth and more on value extraction from the existing portfolio, with more liberal shareholder distributions through dividends and share buybacks. On 19 June, Helios announced a new share buyback programme of up to £3.7m. We expect Helios to leverage its strong Lloyd’s capacity position by employing the PEM initiative in maximising underwriting results, RoC delivery, EPS growth and RoNAV, included in our forecasts. However, we have moderated our capacity growth forecasts, especially as they relate to retained capacity, allowing for the increased utilisation of third-party capacity (‘rental capacity’ in addition to quota share reinsurance). We have also allowed for higher distributions (increased payout ratio, although this may take the form of share buybacks), to maintain an acceptable level of free working capital and in support of our RoNAV forecasts.
The soft landing we forecast in FY26 could be overly conservative if the hard underwriting cycle for Lloyd’s is extended and the PEM initiative is successful in extracting additional value from syndicates, but is increasingly unlikely to be bolstered by aggressive capacity accumulation. Helios is expected to review its stop loss and excess of loss reinsurance arrangements, which could result in future savings, not yet accounted for in our forecasts, but offering upside.
Financials
Exhibit 1: Helios’s segmental forecasts and key metrics
£m |
FY22 |
FY23 |
FY24e |
FY25e |
FY26e |
Capacity (for deployment in the next year) |
296.6 |
507.0 |
547.5 |
590.0 |
628.3 |
Capacity added through acquisitions |
5.7 |
8.1 |
2.5 |
2.7 |
3.0 |
Capacity added through pre-emptions |
36.0 |
41.8 |
30.4 |
32.9 |
29.5 |
Tenancy capacity added |
38.9 |
154.0 |
7.6 |
6.8 |
5.9 |
Retained capacity |
238.3 |
391.9 |
402.4 |
412.9 |
427.2 |
Key parent company assets |
|
|
|||
FAL (required capital) |
73.8 |
70.8 |
91.4 |
107.0 |
110.6 |
WAV (intangible assets) |
60.0 |
82.4 |
94.4 |
102.8 |
109.0 |
Free working capital |
10.3 |
41.2 |
34.8 |
35.3 |
35.8 |
Key syndicate assets |
|
|
|||
Insurance assets |
152.2 |
217.4 |
437.8 |
475.9 |
478.4 |
Equity (members' balances at Lloyd's) |
(5.1) |
34.9 |
40.5 |
47.8 |
54.3 |
Group NAV (syndicate plus parent equity) |
55.7 |
58.0 |
67.6 |
81.2 |
81.9 |
Syndicate level results* |
|||||
GWP |
250.9 |
312.1 |
505.3 |
569.9 |
616.5 |
Net earned premiums |
156.6 |
219.4 |
339.3 |
427.7 |
462.7 |
Claims |
(96.8) |
(107.9) |
(186.1) |
(237.7) |
(267.5) |
Expenses |
(54.2) |
(79.4) |
(120.6) |
(143.7) |
(155.3) |
Underwriting result |
5.6 |
32.1 |
32.6 |
46.4 |
39.9 |
Investment income on financial assets |
(3.5) |
10.6 |
15.5 |
16.1 |
17.8 |
Quota share reinsurance |
(2.0) |
(11.1) |
(10.7) |
(13.9) |
(14.3) |
Underwriting Operating result |
0.1 |
31.6 |
37.4 |
48.6 |
43.3 |
Parent level results |
|
|
|||
Reinsurance income** |
0.6 |
1.4 |
2.2 |
3.5 |
4.6 |
Investment income on FAL |
0.6 |
2.1 |
5.0 |
5.8 |
6.4 |
Stop loss costs |
(1.0) |
(2.6) |
(5.0) |
(5.7) |
(5.7) |
Portfolio FAL financing |
(1.4) |
(3.1) |
(7.8) |
(8.4) |
(8.9) |
Operating costs*** |
(4.0) |
(6.8) |
(7.2) |
(7.2) |
(7.2) |
Pre-acquisition impact |
1.2 |
0.1 |
(0.2) |
(0.2) |
(0.2) |
Combined pre-tax profit |
(4.0) |
22.7 |
24.5 |
36.4 |
32.3 |
Tax |
1.9 |
(6.3) |
(6.1) |
(9.1) |
(8.1) |
Profit after tax |
(2.1) |
16.4 |
18.4 |
27.3 |
24.2 |
WAV revaluation after tax |
2.0 |
13.5 |
8.0 |
5.3 |
3.5 |
Total comprehensive income |
(0.1) |
29.9 |
26.3 |
32.5 |
27.8 |
NAV/share (p) |
151.8 |
189.3 |
218.9 |
248.6 |
257.9 |
WAV/share (p) |
78.7 |
111.1 |
127.6 |
139.0 |
147.3 |
EPS (p) |
(3.1) |
21.6 |
24.8 |
36.9 |
32.7 |
DPS (p) |
3.0 |
6.0 |
14.3 |
28.2 |
28.0 |
Capacity growth |
27.4% |
71.0% |
8.0% |
7.8% |
6.5% |
EPS growth |
309.6% |
(799.5%) |
14.9% |
48.9% |
(11.2%) |
RONAV/share |
(2.0%) |
13.8% |
12.6% |
16.1% |
12.5% |
RONAV/share plus WAV revaluations |
(0.1%) |
27.0% |
18.9% |
20.1% |
15.1% |
Group insurance ratios**** |
|
|
|||
Claims ratio |
63.7% |
52.9% |
58.2% |
58.9% |
61.1% |
Expense ratio |
40.6% |
44.6% |
42.8% |
39.7% |
39.3% |
Combined ratio |
104.3% |
97.6% |
101.0% |
98.5% |
100.3% |
Underwriting portfolio insurance ratios***** |
|
|
|||
Claims ratio |
61.8% |
49.2% |
54.8% |
55.6% |
57.8% |
Expense ratio |
34.6% |
36.2% |
35.5% |
33.6% |
33.6% |
Combined ratio |
96.4% |
85.4% |
90.4% |
89.2% |
91.4% |
RoC (closed YOA) |
3.6% |
6.8% |
12.2% |
17.1% |
13.3% |
Year 3 (accounting year) |
3.9% |
6.2% |
5.9% |
4.6% |
3.6% |
Year 2 (previous year) |
4.4% |
4.6% |
10.3% |
10.0% |
9.3% |
Year 1 (underwriting year) |
(4.6%) |
(4.0%) |
(4.0%) |
2.5% |
0.4% |
Source: Helios Underwriting accounts, Edison Investment Research. Notes: FAL, funds at Lloyd’s. WAV, weighted-average value. *Syndicate results before pre-acquisition/other parent items and after quota share reinsurance (QS). **QS and ‘rental capacity’ fees and profit commission. ***Including finance costs. ****Using consolidated premiums (after pre-acquisition impact) and including parent items. *****Using syndicate excluding pre-acquisitions and parent impacts. Syndicate revenue higher than consolidated revenue, but so are claims and expenses (pre-acquisition impact).
FY23 results comparison to forecasts
FY23 results deviated from our forecasts (see our April update note) in a number of key areas:
■
Syndicate underwriting operating results were £31.6m (combined ratio of 85.4%) versus our forecast of £22.4m (combined ratio of 90%).
■
This super syndicate underwriting result was driven by a much stronger-than-expected 2023 YOA (due to a benign catastrophe environment), delivering an RoC of 1.9% versus the -0.2% we had forecast and the first positive current-year RoC since FY15.
■
The parent company introduced a new split of expenses with a portion of stop-loss costs (relating to funds at Lloyd’s (FAL) financing) and a portion of operating costs (relating to FAL financing) separately disclosed as portfolio FAL financing.
■
On a like-for-like basis, stop-loss costs (under the previous definition) of £4.1m were largely in line with our forecast of £4.2m, while operating costs (under the previous definition) of £8.4m were sharply ahead of our forecast of £5.9m.
■
The higher-than-forecast operating costs were the result of bonuses of £1.25m, a £0.5m investment in additional staff and an FX charge of £0.8m (weaker US dollar over the period).
■
The new expense split resulted in clean operating costs (excluding FAL financing) of £6.8m and clean stop-loss costs of £2.6m, with the remaining £3.1m relating to, and disclosed as, portfolio FAL financing.
■
These higher-than-forecast expenses were more than offset by the higher-than-forecast syndicate underwriting profit, resulting in profit after tax of £16.4m, ahead of our forecast of £11.2m, which resulted in the strong 47% EPS beat of 21.6p versus 14.7p.
■
Actual capacity was £507m, versus £449.8m forecast, although we flagged that £52m of tenancy capacity was expected to become active during H124. The company did reflect this in its FY23 results, which largely explains the difference.
■
Actual FY23 FAL of £70.8m was ahead of our forecast of £64.2m, mainly owing to actual syndicate solvency levels and associate syndicate solvency credits (used in determining Lloyd’s economic solvency requirements and by extension FAL) being larger than we had expected, due to the super syndicate underwriting profit delivered over the period.
■
Actual free working capital of £41.2m was behind our forecast of £52.3m, which is linked to the acceleration of recognised capacity (referred to above) as well as the higher-than-expected build-up of syndicate solvency levels (remaining on syndicate balance sheets).
Changes to FY24 forecasts and beyond
We have moderated our FY24 forecasts, with positive adjustments in a number of areas being offset by higher forecast expenses. The syndicate underwriting operating result forecast is largely unchanged at £37.4m, thanks to higher forecast investment income on financial assets offsetting a slightly higher combined ratio (90.4% vs 89.9% forecast previously). We have also allowed for a less extreme pre-acquisition impact due to a higher starting level of Lloyd’s capacity and lower capacity growth during the period than had previously been forecast.
We have forecast expenses based on the new split disclosed by the company. Stop-loss costs are forecast to almost double due to the large increase in capacity, but this is not out of line with our previous forecasts. We now forecast portfolio FAL financing separately and allow for a substantial increase from £3.1m to £7.8m, driven by the US$75m of seven-year unsecured debt (with a 9.5% coupon) raised in December 2023. This increase had been included in our previous forecasts.
On a combined basis, we have lifted our expense forecasts by £2.0m from £18.0m to £20.0m, with the increase largely relating to operating costs. We forecast clean (of portfolio FAL financing) operating costs of £7.2m, up from £6.8m in FY23, with the £0.8m in one-off costs in FY23 not expected to be repeated, but allowing for additional costs relating to the CEO transition. This represents a 4% increase in base costs and an increase in bonus costs commensurate with our forecast increase in operating profit.
The net result of our above forecast changes is a 5.5% reduction in EPS to 24.8p. We forecast NAV of 218.9p/share at the end of FY24, which implies a RoNAV of 18.9% for the year.
Our forecasts for FY25 are slightly lower from a revenue point of view (allowing for more modest capacity growth) and, with a slightly higher cost base (flat operating costs on FY24, with modest increases in stop loss and portfolio FAL financing costs), we have cut our EPS forecast by 1.9% to 36.9p. We forecast NAV of 248.6p and RoNAV of 20.1%.
Our FY26 forecasts conservatively allow for a turn in the underwriting cycle, which has a negative impact on our forecast revenue. We forecast an increase in combined ratio from 89.2% in FY25 to 91.4% in FY26, which results in an 11% decline in the underwriting operating result to £43.3m. After allowing for a continued increase in reinsurance income and investment income on FAL, offset by a continued increase in expenses (albeit allowing for only modest increases in stop loss and portfolio FAL financing costs), this results in EPS of 32.7p in FY26, down 11.2% on FY25. On the back of this lower forecast EPS, RoNAV for FY26 is forecast to moderate to 15.1%.
Our forecasts offer upside potential if Helios can reduce its stop loss and FAL financing costs, which is an area of increasing focus for the company.
Valuation: An over-the-cycle return approach
Our base case valuation of 280p/share uses a 14.2% over-the-cycle RoNAV, which has been reduced from the 14.6% used in our previous notes. Our over-the-cycle RoNAV is based on the average RoNAV forecast over the next five years, which includes a turn in the cycle from FY26 and allows for 75% of capacity fund revaluations in its calculation (for conservatism).
At the same time, we have slightly increased our cost of equity from 10.3% to 10.6% based on a risk-free rate of 4.1% (up from 3.8%), a risk premium of 6.5% and a beta of 1x.
Our valuation uses a RoNAV versus price/NAV approach and has been determined with reference to the NAV/share disclosed as at 31 December 2023, which was 189p/share (compared to the 187p/share) used in our previous valuation.
The latest valuation of 280p/share is unchanged from our previous valuation (in April 2024), with the positive drivers of increased proximity to stronger cash flows, a higher NAV/share used for our calculation (based on actual FY23 delivery) and a more liberal distribution policy, offset by lower near-term forecasts, a slightly higher cost of equity and a slightly lower over-the-cycle RoNAV.
The valuation offers potential upside from the new share buyback programme announced on 19 June, as well as a longer-lasting hard underwriting cycle than allowed for in our soft landing forecast from FY26. Reductions in stop loss and portfolio FAL financing costs could offer further upside, which will become clearer as the company’s strategy develops.
Exhibit 2: Current valuation
FY23 |
FY24e |
FY25e |
FY26e |
|
Over-the-cycle valuation (p) |
280 |
|||
EPS (p) |
21.6 |
24.8 |
36.9 |
32.7 |
DPS (p) |
6.0 |
14.3 |
28.2 |
28.0 |
NAV/share (p) |
189.3 |
218.9 |
248.6 |
257.9 |
Valuation-implied P/E (x) |
13.0 |
11.3 |
7.6 |
8.5 |
Valuation-implied dividend yield (%) |
2.1% |
5.1% |
10.1% |
10.0% |
NAV multiple (x) |
1.48 |
1.28 |
1.13 |
1.09 |
Source: Helios, Edison Investment Research
Our fair value for Helios is at a 1.48x multiple of its FY23 NAV of 189p/share and at a 65% premium to the current share price. The valuation is well supported by expected FY24 EPS (P/E based on 280p/share valuation of 11.3x) and by dividends (5.1% dividend yield based on the 280p/share valuation), becoming even more attractive with reference to FY25 forecasts (valuation P/E multiple falling to 7.6x and valuation dividend yield rising to 10.1%).
Exhibit 3: Financial summary
2022 |
2023 |
2024e |
2025e |
2026e |
|
Accounts: IFRS, year-end 31 December, £000s |
|||||
PROFIT & LOSS |
|||||
Revenue* |
148,345 |
212,941 |
341,297 |
428,189 |
465,779 |
Net insurance claims and loss adjustment expenses |
(149,667) |
(185,640) |
(311,794) |
(386,770) |
(428,395) |
Gross Profit |
(1,322) |
27,301 |
29,503 |
41,418 |
37,384 |
EBITDA |
(5,169) |
22,086 |
24,469 |
36,388 |
32,317 |
Operating profit (before amort. and excepts.) |
(5,169) |
22,086 |
24,469 |
36,388 |
32,317 |
Intangible Amortisation |
0 |
0 |
0 |
0 |
0 |
Exceptionals |
1,216 |
619 |
0 |
0 |
0 |
Other |
(3,847) |
(5,215) |
(5,034) |
(5,030) |
(5,067) |
Operating Profit |
(3,953) |
22,705 |
24,469 |
36,388 |
32,317 |
Net Interest |
0 |
0 |
0 |
0 |
0 |
Profit Before Tax (norm) |
(5,169) |
22,086 |
24,469 |
36,388 |
32,317 |
Profit Before Tax (FRS 3) |
(5,169) |
22,705 |
24,469 |
36,388 |
32,317 |
Tax |
1,852 |
(6,334) |
(6,117) |
(9,097) |
(8,079) |
Profit After Tax (norm) |
(3,317) |
15,752 |
18,352 |
27,291 |
24,238 |
Profit After Tax (FRS 3) |
(2,101) |
16,371 |
18,352 |
27,291 |
24,238 |
Average Number of Shares Outstanding (m) |
72.0 |
75.2 |
74.1 |
74.0 |
74.0 |
EPS - normalised (p) |
(3.1) |
21.6 |
24.8 |
36.9 |
32.7 |
EPS - normalised fully diluted (p) |
(3.1) |
20.8 |
23.8 |
35.3 |
31.1 |
EPS - (IFRS) (p) |
(3.1) |
20.8 |
23.8 |
35.3 |
31.1 |
Dividend per share (p) |
3.0 |
6.0 |
14.3 |
28.2 |
28.0 |
Gross Margin (%) |
(0.9%) |
12.8% |
8.6% |
9.7% |
8.0% |
EBITDA Margin (%) |
(3.5%) |
10.4% |
7.2% |
8.5% |
6.9% |
Operating Margin (before GW and except.) (%) |
(3.5%) |
10.4% |
7.2% |
8.5% |
6.9% |
BALANCE SHEET |
|||||
Fixed Assets |
567,249 |
696,653 |
1,204,704 |
1,400,509 |
1,513,015 |
Intangible Assets |
61,434 |
82,117 |
94,100 |
102,526 |
108,722 |
Tangible Assets |
279,803 |
326,337 |
581,487 |
715,037 |
815,237 |
Investments |
226,012 |
288,199 |
529,117 |
582,946 |
589,056 |
Current Assets |
25,300 |
59,949 |
69,014 |
67,770 |
68,445 |
Stocks |
0 |
0 |
0 |
0 |
0 |
Debtors |
0 |
0 |
0 |
0 |
0 |
Cash |
25,300 |
59,949 |
69,014 |
67,770 |
68,445 |
Other |
0 |
0 |
0 |
0 |
0 |
Current Liabilities |
22,488 |
11,718 |
12,890 |
14,179 |
15,597 |
Creditors |
7,488 |
11,718 |
12,890 |
14,179 |
15,597 |
Short term borrowings |
15,000 |
0 |
0 |
0 |
0 |
Long Term Liabilities |
452,883 |
604,782 |
1,099,103 |
1,270,396 |
1,375,273 |
Long term borrowings |
0 |
59,055 |
59,055 |
59,055 |
59,055 |
Other long-term liabilities |
452,883 |
545,727 |
1,040,048 |
1,211,341 |
1,316,218 |
Net Assets |
117,178 |
140,101 |
161,725 |
183,704 |
190,591 |
CASH FLOW |
|||||
Operating Cash Flow |
(24,798) |
6,250 |
21,713 |
20,669 |
32,048 |
Net Interest |
(2,870) |
(7,426) |
(8,805) |
(16,457) |
(18,341) |
Tax |
(166) |
(6,334) |
(6,117) |
(9,097) |
(8,079) |
Capex |
(696) |
(500) |
0 |
0 |
0 |
Acquisitions/disposals |
3,459 |
273 |
6,726 |
14,211 |
15,922 |
Financing |
27,781 |
44,704 |
0 |
0 |
0 |
Dividends |
(2,034) |
(2,319) |
(4,451) |
(10,570) |
(20,874) |
Net Cash Flow |
676 |
34,649 |
9,065 |
(1,244) |
676 |
Opening net debt/(cash) |
24,624 |
10,300 |
894 |
9,959 |
8,715 |
HP finance leases initiated |
0 |
0 |
0 |
0 |
0 |
Change in borrowings |
(15,000) |
(44,055) |
0 |
0 |
0 |
Closing net debt/(cash) |
10,300 |
894 |
9,959 |
8,715 |
9,390 |
Source: Helios Underwriting accounts, Edison Investment Research. Note: *Shown after pre-acquisition impact and parent reinsurance result, investment income, costs and other items (see Exhibit 2 for a segmental view of Syndicate result and Parent result).
|
|
Research: Healthcare
Creo Medical has expanded its collaborative agreement with leading robotics manufacturer Intuitive Surgical, to include additional sites in the UK and Europe testing MicroBlate Flex in combination with Intuitive’s Ion surgical system for combined lung cancer diagnostics and treatment. The first such successful procedure under a clinical trial setting was announced in March 2024 by Professor Shah at Royal Brompton Hospital and the addition of new centres could potentially drive accelerated adoption of the MicroBlate Flex (commercial roll-out is planned over the next 12 months, with first procedures from the new sites expected in H2 CY24). We view this deal expansion as a validation of the utility of Creo’s technology in robotics-assisted procedures and a sentiment boost ahead of MicroBlate Flex’s commercial launch later this year.