Share’s FY17 results announcement continued the flow of encouraging news seen from previous updates. There was a strong increase in revenue and a move into modest normalised pre-tax profits. The IT investment programme is well underway and is becoming more visible as App enhancements and website improvements come on stream. Underpinning this are projects to strengthen infrastructure on which client service and the business depends. Operational gearing has the potential to bring the currently high prospective earnings multiples down rapidly.
Written by
Share |
Delivering IT programme and revenue growth |
FY17 results |
Financial services |
27 March 2018 |
Share price performance
Business description
Next events
Analysts
Share is a research client of Edison Investment Research Limited |
|||||||||||||||||||||||||||||||||||||||||||||||
Share’s FY17 results announcement continued the flow of encouraging news seen from previous updates. There was a strong increase in revenue and a move into modest normalised pre-tax profits. The IT investment programme is well underway and is becoming more visible as App enhancements and website improvements come on stream. Underpinning this are projects to strengthen infrastructure on which client service and the business depends. Operational gearing has the potential to bring the currently high prospective earnings multiples down rapidly.
Year end |
Revenue (£m) |
PBT* |
EPS* |
DPS |
P/E |
Yield |
12/16 |
14.6 |
0.0 |
0.00 |
0.25 |
N/A |
1.0 |
12/17 |
18.7 |
0.4 |
0.27 |
0.40 |
93.2 |
1.6 |
12/18e |
20.1 |
0.9 |
0.52 |
0.55 |
49.7 |
2.1 |
12/19e |
20.8 |
1.0 |
0.57 |
0.70 |
44.8 |
2.7 |
Note: *PBT and EPS are normalised, excluding amortisation of acquired intangibles, exceptional items and share-based payments.
FY17 results
Assets under administration (AUA) increased by 27% compared with FY16, reaching £4.7bn with about half this growth arising organically. AUA growth, favourable market conditions and strategic partnerships coming on stream all contributed to 28% revenue growth. Revenue market share has continued to rise and in a peer group including Hargreaves Lansdown was up from 3.21% to 3.87%. The programme of investment in IT and the need to service new strategic partnerships contributed to a 22% rise in costs, but this still allowed a normalised pre-tax profit of £0.35m compared with a marginal loss in 2016. The group’s cash position remains strong (£10.5m) and year-end capital stood at three times the regulatory requirement. The dividend was increased by 60%.
Outlook
2017 was a positive year for the equity market despite geopolitical uncertainties and the prospect of rising policy rates; the fact that the current year has already seen a spike in volatility and weakness in markets highlights the potential for a less favourable backdrop for Share. However, the economic background appears reasonably encouraging and investor sentiment has shown resilience. More fundamentally, the work that the group has done to improve its customer offering, IT platform and to expand its strategic partnerships should mean that it can grow to a more profitable scale through market cycles.
Valuation: Maintained
Our DCF valuation captures current relatively depressed profitability but allows for a potential geared improvement in cash flows over the medium term. As the IT investment programme reaches fruition this year, confidence in this prospect should improve. For the moment our central valuation is unchanged at 30.5p (see page 6).
FY17 results
Share reported full year revenue 28% ahead of 2016 and a normalised pre-tax profit versus a small loss in the prior year reflecting the continuing programme of IT investment to provide the basis for future growth and enhance the client experience. The proposed dividend of 0.4p/share was above our expectation and represents an increase of 60%. Exhibit 1 sets out key profit and loss figures for the full year and second half of 2017 and the main points are discussed below (all comparisons FY17 versus FY16 unless stated).
Exhibit 1: Results summary FY17 and H217
Year-end 31 December |
H216 |
H117 |
H217 |
H217 vs H216 % |
FY16 |
FY17 |
Change % |
Account fees |
3,513 |
3,533 |
3,667 |
4.4 |
6,784 |
7,200 |
6.1 |
Dealing Commissions |
3,597 |
4,992 |
5,608 |
55.9 |
7,040 |
10,600 |
50.6 |
Interest and other income |
276 |
350 |
576 |
108.7 |
786 |
926 |
17.8 |
Revenue |
7,386 |
8,875 |
9,851 |
33.4 |
14,610 |
18,726 |
28.2 |
Total costs |
(8,064) |
(9,074) |
(10,445) |
29.5 |
(15,956) |
(19,519) |
22.3 |
Operating profit |
(678) |
(199) |
(594) |
(12.4) |
(1,346) |
(793) |
(41.1) |
Investment revenues |
18 |
207 |
18 |
0.0 |
248 |
225 |
(9.3) |
Other income, gains/ losses |
1,491 |
67 |
884 |
(40.7) |
2,119 |
951 |
(55.1) |
Pre-tax profit |
831 |
75 |
308 |
(62.9) |
1,021 |
383 |
(62.5) |
Other gains and losses |
(1,494) |
(67) |
(884) |
(40.8) |
(2,122) |
(951) |
(55.2) |
Non-recurring items incl. FSCS |
71 |
96 |
301 |
323.9 |
299 |
397 |
32.8 |
Profit share impact of above |
142 |
(65) |
74 |
(47.9) |
154 |
9 |
(94.2) |
Normalised pre-tax profit |
(156) |
310 |
41 |
N/A |
(46) |
351 |
N/A |
Tax |
(228) |
(62) |
(11) |
(95.2) |
(284) |
(73) |
(74.3) |
Post-tax profit |
603 |
13 |
297 |
(50.7) |
737 |
310 |
(57.9) |
Normalised post-tax profit |
(128) |
255 |
128 |
N/A |
4 |
383 |
N/A |
Source: Share plc, Edison Investment Research
■
Assets under administration (AUA) increased by 27% to £4.7bn. This did not reflect the addition of new services for Computershare including certificated dealing and corporate sponsored nominee services as these would not count as AUA unless users went on to sign up with The Share Centre. Share attributes roughly half the increase to organic growth with approximately one third arising from the rise in the equity market during the year.
■
As noted, total revenue increased by 28% with the largest increases seen in dealing commissions (+50%) and interest income (+18%). The strength of the increase in commission income can be attributed to increased activity levels together with the benefit of the launch of new Computershare services in May 2017. Interest income benefited from a rise in cash held on behalf of customers (+31% to £387m) and permission from the FCA to increase the duration of up to 60% of deposits for up to 95 days.
■
The number of accounts increased by 3% to 258,000.
■
Share’s three in-house fund of funds, while still relatively small, continued to increase their combined assets under management (from £70m to £101m) and offer investors a straightforward entry point to equity investing.
■
Costs increased by 22% partly driven by the new Computershare services where commissions are shared and which have also contributed to a 21% increase in the overall headcount. Otherwise some recruitment was needed to deal with regulatory changes and the intangible amortisation charge increased reflecting IT investment and the purchase of customer accounts.
■
Reported pre-tax profit was more than 60% lower at £0.38m, but this reflected the absence of the £2.1m one-off gain on the sale of London Stock Exchange shares in 2016’s profit. This was only partly balanced by a payment of £0.9m received in 2017 for costs related to a customer contract that did not proceed. On a normalised basis, excluding one-offs and adding back share-based payments, Share moved from a marginal loss to a profit of £0.35m.
Share has made progress with its technology programme designed to deliver a digital transformation and to further one of its three strategic aims: putting customers first. During the year achievements included development of the Share Centre mobile App with the launch in October of a version which allows clients to fund their account and trade. It is still early days, but Share report 4% of trades are via the App. Work has also been undertaken to redevelop and enhance the Share Centre website with new features set to rolled out on a phased basis. Work on the infrastructure that supports client services has also taken place including a new client asset reconciliation system completed and projects related to regulatory changes also completed. The investment is expected to be substantially completed in the current year.
In addition to strengthening the IT platform that supports it, the second strategic aim of focusing on the core business was furthered through the sale of Sharefunds (which acts as an Authorised Corporate Director), a non-core activity.
The third strategic leg is pursuing strategic partnerships and acquisitions. Here, 2017 saw additional services for Computershare come on line including certificated and corporate nominee dealing. Approximately 8,000 Invesco Perpetual investment trust accounts were moved across to the Share platform and a bond subscription service was launched for Wellesley and Co. There is a pipeline of further potential partnerships although, as usual, timing of completion of agreements is unpredictable.
As highlighted above, 2017 saw strong growth in AUA and Exhibit 2 puts this in a longer-term context making clear the increased growth in recent periods reflecting a combination of organic growth supported by the attractions of Share’s flat account fee structure, market strength and acquisitions of books of business.
|
Exhibit 2: Share plc AUA |
Exhibit 3: Share plc revenue analysis over time |
|
|
|
Source: Share plc |
Source: Share plc |
|
Exhibit 2: Share plc AUA |
|
|
Source: Share plc |
|
Exhibit 3: Share plc revenue analysis over time |
|
|
Source: Share plc |
Exhibit 3 gives an analysis of revenue over the same period. Revenue was broadly maintained in the period between 2011 and 2016 despite the elimination of trail commission, the adoption of the flat account fee structure and the contraction in interest income as rates fell to historically low levels. 2017 therefore represented a substantial step forward driven primarily by commissions as a result of favourable market conditions and the new partnership agreements.
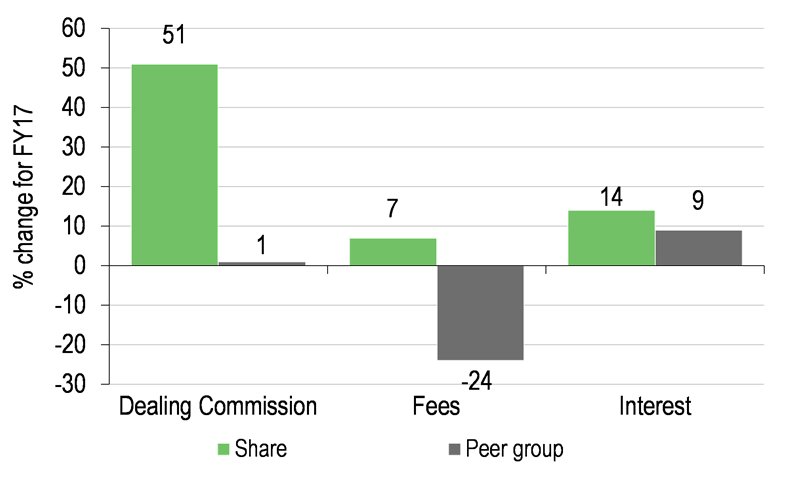
Exhibits 4 and 5 show revenue market share figures for Share compared with a peer group collected by Compeer1. The first chart shows growth in the different categories of income with Share demonstrating particular relative strength in dealing commissions and fee income. The next chart shows Share’s progress in market share (revenue excluding interest income) relative to the same peer group. Against a broader quarterly-collected peer group that includes Hargreaves Lansdown, Share’s market share for 2017 increased to 3.87% compared with 3.21% in 2016.
Alliance Trust Savings, Barclays Stockbrokers, Equiniti, Halifax Share Dealing (Lloyds Bank), HSBC Stockbrokers, Saga Personal Finance, Selftrade and TD Direct Investing. Industry leader Hargreaves Lansdown is excluded because it does not submit monthly information to Compeer.
|
Exhibit 4: FY17 change in revenue, SHRE and peers |
Exhibit 5: Share plc revenue market share progress |
|
|
|
Source: Share plc, Compeer |
Source: Share plc, Compeer. Note: Excludes interest. |
|
Exhibit 4: FY17 change in revenue, SHRE and peers |
|
|
Source: Share plc, Compeer |
|
Exhibit 5: Share plc revenue market share progress |
|
|
Source: Share plc, Compeer. Note: Excludes interest. |
Background and outlook
The recent pattern in UK equity market performance and volatility are illustrated in the next two charts highlighting the period of strength from early 2016 to end 2017 despite bouts of volatility accompanying events such as the Brexit vote and UK election. This year there has been a further spike in volatility and marked weakness in February. It remains to be seen whether the subsequent reduction in volatility will be sustained, allowing a return to more favourable conditions for investor confidence and hence for Share.
|
Exhibit 6: FTSE All-Share Index (total return) |
Exhibit 7: FTSE100 Implied Volatility Index |
|
|
|
Source: Thomson Datastream |
|
Exhibit 6: FTSE All-Share Index (total return) |
|
|
Source: Thomson Datastream |
|
Exhibit 7: FTSE100 Implied Volatility Index |
|
|
Source: Thomson Datastream |
In Exhibit 8 we chart the level of retail equity fund sales as reported by the Investment Association as one indicator of investor confidence. This shows that 2017 saw a return to significant net purchases after a negative year in 2016. The Exhibit 9 shows a shorter-term series of the net fund sales data together with the Lloyds Bank investment sentiment index for UK equities. While we do not yet have fund sales data for 2018 it is interesting to see that Lloyds Bank survey data has remained in positive territory despite the period of higher volatility. This could be a positive indicator for Share and, in tune with this, the company notes that during the market decline in February this year two thirds of its trades were buys.
|
Exhibit 8:Retail equity fund net sales from 2012 |
Exhibit 9:Fund sales and investor sentiment index |
|
|
|
Source: Investment Association |
Source: Investment Association, Lloyds Bank |
|
Exhibit 8:Retail equity fund net sales from 2012 |
|
|
Source: Investment Association |
|
Exhibit 9:Fund sales and investor sentiment index |
|
|
Source: Investment Association, Lloyds Bank |
Clearly, Share will be sensitive to any significant market setback but on a longer view the work it has done to improve its customer offering and the success it has had in building revenue market share, AUA and partnership agreements should stand it in good stead through market fluctuations. One source of swings in sentiment is likely to be changing expectations on the pace unwinding of exceptionally low interest rates and here, Share stands to benefit from higher rates earned on client money balances to the extent that banking counterparties reflect rising rates in the deposit rates they pay. We expect higher interest income to make a significant contribution to the increase in normalised profits we estimate for 2018 (see estimate revisions set out in the next section).
Financials
Changes in our estimates are shown in Exhibit 10 with a forecast for 2019 included for the first time. There is a 6% increase in our revenue estimate for this year which translates into a 20% rise in estimated earnings. The main change we have made, as noted above, has been to increase the assumed interest income reflecting the rise in customer deposits, greater flexibility granted by the FCA and some benefit from a rise in base rates. Subject to policy rate movements and how much these feed into deposit rates, we suspect there could positive surprises compared with our expectation.
Exhibit 10: Estimate revisions
Revenue (£m) |
PBT* (£m) |
EPS* (p) |
Dividend (p) |
||||||||||
Old |
New |
% chg |
Old |
New |
% chg |
Old |
New |
% chg |
Old |
New |
% chg |
||
2017 |
18.0 |
18.7 |
4% |
0.5 |
0.4 |
-32% |
0.29 |
0.27 |
-6% |
0.30 |
0.40 |
33% |
|
2018e |
19.0 |
20.1 |
6% |
0.8 |
0.9 |
12% |
0.43 |
0.52 |
20% |
0.50 |
0.55 |
10% |
|
2019e |
20.8 |
N/A |
1.0 |
N/A |
0.57 |
N/A |
0.70 |
N/A |
|||||
Source: Edison Investment Research. Note: *PBT and EPS are normalised, excluding exceptional items and share-based payments. For 2017 “old” figures are estimated and “new” actual.
Share’s capital and cash position remains strong. The regulatory capital requirement is £5m for 2018 and was £5.6m for 2017. At end 2017 the group held capital equivalent to three times the requirement, comfortably above the company’s own policy of holding twice the regulatory requirement. Share has no debt and at the year-end had cash of £10.5m compared with £11.4m at the end of the prior year. Operating cash flow was a positive £1.1m while the main uses of cash were intangible and fixed investment (£1.5m), much of which related to the IT programme together with dividends and share purchases for the employee benefit reserve (£0.9m in total). In addition to the cash position Share holds available for sale investments, primarily holdings in the London Stock Exchange and Euroclear. These were valued at £6.4m at the year end.
Valuation
We have updated the comparative table we have used in previous notes. This incorporates selected measures for Share, Alliance Trust Savings and Hargreaves Lansdown. The scale of Hargreaves Lansdown is apparent with its latest reported AUA standing at £86bn compared with £15.8bn and £4.7bn for Alliance Trust Savings and Share respectively. With a history of growth and track record of profitability it is unsurprising that Hargreaves Lansdown also trades on substantially higher multiples of revenue or as a percentage of AUA. Following an increase in the capital requirement for Hargreaves Lansdown last year, surplus capital (assuming a target of capital at twice the required level, in line with Share) has been largely absorbed. For Share there is a £5m surplus on this basis which we deduct from the market capital to calculate an adjusted value. For Alliance Trust Savings we take the valuation reported in the Alliance Trust accounts (down from £61.5m to £38m following problems and costs associated with the launch of a new IT platform). Perhaps unsurprisingly after a year of significant losses at Alliance Trust Savings, the valuation in terms of revenue and AUA now stands below Share.
Share’s valuation is lower than that we reported following the H117 results (then the adjusted value was 2.0x revenue and 0.8% of AUA) which we would ascribe to the strong revenue and AUA growth that has yet to be fully evidenced in profitability. Prospectively, organic and/or acquisitive growth may produce positive surprises as operational gearing comes into play following the period of IT investment.
Exhibit 11: Peer comparison
£m unless stated |
Share |
Alliance Trust Savings |
Hargreaves Lansdown |
Market capital (22 March 2018) |
36.2 |
8,291.1 |
|
Surplus capital (assumes cover of twice the regulatory requirement) |
5.0 |
0.2 |
|
Adjusted value |
31.2 |
38.0 |
8,290.9 |
Revenue |
18.7 |
27.0 |
432.0 |
AUA |
4,700 |
15,800 |
86,100 |
Number of accounts (active clients HL) |
258,000 |
113,317 |
1,015,000 |
Market capital/revenue (x) |
1.9 |
N/A |
19.2 |
Market capital/AUA (%) |
0.8 |
N/A |
9.6 |
Adjusted value/revenue (x) |
1.7 |
1.4 |
19.2 |
Adjusted value/AUA (%) |
0.7 |
0.2 |
9.6 |
Source: Edison Investment Research, companies’ disclosure. Note: valuation, turnover and AUA for Alliance Trust Savings from FY17 results. Hargreaves Lansdown AUA and revenue (annualised) from H118. Share AUA and revenue FY17.
We have also updated our DCF valuation using assumptions that include intermediate growth (2020-22) of 50% to capture operational gearing starting from relatively low profitability, a discount rate of 10% and a terminal multiple of 10x. Allowing for changes to our FY19 assumptions, our central value (see sensitivity in Exhibit 12) is unchanged at 30.5p.
Exhibit 12: Discounted cash flow valuation sensitivity (pence per share)
Discount rate |
|||||
2020-22 growth |
8% |
9% |
10% |
11% |
12% |
0% |
19.5 |
17.4 |
16.9 |
16.4 |
15.9 |
30% |
25.6 |
22.1 |
21.1 |
20.2 |
19.5 |
50% |
39.2 |
32.4 |
30.5 |
28.9 |
27.4 |
70% |
51.9 |
41.9 |
39.2 |
36.8 |
34.7 |
Source: Edison Investment Research
Exhibit 13: Financial summary
£000 |
2014 |
2015 |
2016 |
2017 |
2018e |
2019e |
|
Year end 31 December |
|||||||
PROFIT & LOSS |
|||||||
Account fees |
6,610 |
6,400 |
6,784 |
7,200 |
7,488 |
7,750 |
|
Dealing Commissions |
6,610 |
6,400 |
7,040 |
10,600 |
11,236 |
11,573 |
|
Interest and other income |
1,800 |
1,250 |
786 |
926 |
1,405 |
1,502 |
|
Revenue |
|
15,042 |
14,050 |
14,610 |
18,726 |
20,129 |
20,826 |
Cost of Sales (exc amortisation and depreciation) |
(14,579) |
(14,812) |
(15,727) |
(19,169) |
(19,445) |
(19,965) |
|
EBITDA |
|
463 |
(762) |
(1,117) |
(443) |
684 |
861 |
Depreciation |
|
(104) |
(111) |
(121) |
(127) |
(135) |
(140) |
Amortisation |
(11) |
(21) |
(108) |
(223) |
(630) |
(680) |
|
Operating profit (pre exceptional) |
|
348 |
(894) |
(1,346) |
(793) |
(81) |
41 |
Exceptionals |
0 |
0 |
0 |
900 |
0 |
0 |
|
Other |
60 |
1,479 |
2,119 |
51 |
0 |
0 |
|
Investment revenues |
308 |
276 |
248 |
225 |
198 |
198 |
|
Profit Before Tax (FRS 3) |
|
716 |
861 |
1,021 |
383 |
117 |
239 |
Profit Before Tax (norm) |
|
1,615 |
584 |
(46) |
351 |
859 |
983 |
Tax |
(109) |
(196) |
(284) |
(73) |
0 |
(45) |
|
Profit After Tax (FRS 3) |
|
607 |
665 |
737 |
310 |
117 |
194 |
Profit After Tax (norm) |
|
1,416 |
555 |
4 |
383 |
718 |
796 |
Average Number of Shares Outstanding (m) - exc treasury |
143.5 |
139.2 |
139.3 |
139.4 |
139.4 |
139.4 |
|
EPS - normalised (p) |
|
0.99 |
0.40 |
0.00 |
0.27 |
0.52 |
0.57 |
EPS - FRS3 (p) |
|
0.42 |
0.48 |
0.53 |
0.22 |
0.08 |
0.14 |
Dividend per share (p) |
0.62 |
0.74 |
0.25 |
0.40 |
0.55 |
0.70 |
|
EBITDA Margin (%) |
3.1% |
(5.4%) |
(7.6%) |
(2.4%) |
3.4% |
4.1% |
|
Normalised operating margin (%) |
8.3% |
2.2% |
(2.0%) |
0.7% |
3.3% |
3.8% |
|
BALANCE SHEET |
|||||||
Fixed Assets (mainly Investments) |
|
9,405 |
8,083 |
8,341 |
9,986 |
10,121 |
10,001 |
Current Assets |
|
21,316 |
19,716 |
23,883 |
35,300 |
21,733 |
22,789 |
Total Assets |
|
30,721 |
27,799 |
32,224 |
45,286 |
31,854 |
32,790 |
Current Liabilities |
|
(8,450) |
(7,681) |
(13,384) |
(25,942) |
(12,430) |
(13,400) |
Long term Liabilities |
(1,594) |
(1,418) |
(1,096) |
(1,155) |
(1,155) |
(1,155) |
|
Net Assets |
|
20,677 |
18,700 |
17,744 |
18,189 |
18,269 |
18,235 |
CASH FLOW |
|||||||
Operating Cash Flow |
|
199 |
(2,104) |
492 |
1,147 |
(335) |
1,886 |
Net cash from investing activities |
(434) |
1,990 |
483 |
(1,293) |
(702) |
(502) |
|
Net cash from (used in) financing |
(736) |
(878) |
(1,217) |
(735) |
(558) |
(767) |
|
Net Cash Flow |
|
(971) |
(992) |
(242) |
(881) |
(1,594) |
618 |
Opening net (debt)/cash |
|
13,626 |
12,655 |
11,663 |
11,421 |
10,540 |
8,946 |
Closing net (debt)/cash |
|
12,655 |
11,663 |
11,421 |
10,540 |
8,946 |
9,563 |
Source: Company accounts, Edison Investment Research
|
|
Learning Technologies Group (LTG) released another strong set of results and trading post the year end is ahead of management expectations. The outlook is supported by a successful “co-ordinated selling” strategy, which has been driving cross-sales across the business units, creating sector-leading margins, and the order book is healthy. LTG is comfortably on target to double run rate revenues to £100m and achieve run rate EBIT of at least £25m by the end of 2020. While the shares look punchy on c 34x our FY19e EPS, the business is attractively positioned in an industry growing in double figures and we note that potential high-teen growth opportunities are hard to find across the broader market.