Last close As at 05/08/2026
—
— 0.00 (0.00%)
Market capitalisation
—
Research: Financials
Numis issued an upbeat trading statement at the end of July signalling that activity has been strong since the end of March and that revenue and profit for the current year to end September are likely to be comfortably ahead of the prior year. We have increased our estimate accordingly while holding our FY18 forecast steady on a precautionary basis. The recent pick up in trading is evidence of how the strength of the franchise pays off in favourable market conditions and provides an encouraging backdrop as board changes signal further measured evolution in management.
Written by
Numis Corporation |
Comfortably ahead |
Trading update |
Financial services |
7 August 2017 |
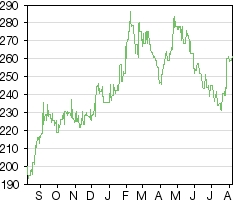
Share price performance
Business description
Next events
Analysts
|
||||||||||||||||||||||||||||||||||||||||||||||||
Numis issued an upbeat trading statement at the end of July signalling that activity has been strong since the end of March and that revenue and profit for the current year to end September are likely to be comfortably ahead of the prior year. We have increased our estimate accordingly while holding our FY18 forecast steady on a precautionary basis. The recent pick up in trading is evidence of how the strength of the franchise pays off in favourable market conditions and provides an encouraging backdrop as board changes signal further measured evolution in management.
Year end |
Revenue (£m) |
PBT* |
EPS* |
DPS |
P/E |
Yield |
09/15 |
98.0 |
26.1 |
18.3 |
11.5 |
14.3 |
4.4 |
09/16 |
112.3 |
32.5 |
22.4 |
12.0 |
11.7 |
4.6 |
09/17e |
126.0 |
35.1 |
23.8 |
12.0 |
11.0 |
4.6 |
09/18e |
119.5 |
30.8 |
21.0 |
12.5 |
12.4 |
4.8 |
Note: *PBT and EPS are on a reported basis.
Trading update and board changes
Numis issued a positive trading update on 28 July indicating that, since the end of March, its Equities business has continued to perform well while Corporate Broking and Advisory has seen a marked increase in the size of equity issuance transactions with average fees substantially higher than in the first half. Hence, subject to trading in August and September, the company expects full year revenue and profit to be comfortably ahead of the prior year. Numis also announced that three executive board directors will be standing down between September this year and January 2018; this will leave a board more balanced with regard to executive and non-executive directors (see page 2).
Outlook
Reflecting the trading update we have increased our revenue estimate for FY17 by nearly 8% which results in an increase of over 15% in earnings per share. Most of the increase in forecast revenues relates to placing commissions (further detail overleaf). Given the potential for renewed market volatility and lower corporate and market activity together with uncertainty over the possible impacts as MiFID II is implemented, we are leaving our FY18 forecasts unchanged for the moment. However, if market confidence is sustained, this could prove conservative. On a longer view, Numis continues to work on developing its franchise further through initiatives such as its Venture Broking activity which addresses the opportunity to provide funding and advice to private companies.
Valuation: Still on a cautious rating
Numis shares have responded to recent more positive trading news but remain modestly rated in terms of P/E multiples compared with peers (page 4), while our central ROE/COE valuation (323p vs 318p before) points to upside of more than 20%.
FY17 estimates increased and board changes
Revised estimates following trading update
As noted above, Numis reported strong trading between end March and July with equity issuance and, to some extent, M&A activity contributing to the improved outlook for the full year. Exhibit 1 shows that UK equity market levels have shown resilience in the face of uncertainty over the political and economic outlook and (not shown) the value of trading activity on the London Stock Exchange has also demonstrated progress. Exhibit 2 shows total issuance for the AIM and Main markets and for Numis’ Q3 period to end June. The value of new and follow on issuance was ahead of H216 on a pro rata basis, led by Main market activity. Compared with the H117 period, the Q3 run rate is similar.
|
Exhibit 1: FTSE AIM, All-Share and Small Cap indices |
Exhibit 2: AIM and Main market issuance |
|
|
|
Source: Thomson Datastream. Note: total return series |
Source: LSE. Note: H1 to end Mar, Q3 to end Jun, H2 to end Sep |
|
Exhibit 1: FTSE AIM, All-Share and Small Cap indices |
|
|
Source: Thomson Datastream. Note: total return series |
|
Exhibit 2: AIM and Main market issuance |
|
|
Source: LSE. Note: H1 to end Mar, Q3 to end Jun, H2 to end Sep |
Numis therefore appears to have performed more strongly than the overall market in recent months. Transactions contributing to this include the recent Alfa Financial Software, Nexus Infrastructure and Sherborne Investors IPOs and secondary raises for Draper Esprit, IP Group and INPP and a significant block trade for Countryside. M&A deals pending or completed include IP’s purchase of Touchstone (over £500m), the acquisition of 32 Red by Kindred (c £170m), the c £2bn offer by SNC-Lavalin for Atkins and the sale of former SVG Capital plc (Sole Realisation Company) assets (over £900m). These and other transactions appear likely to contribute to FY17 pre-tax profit c 8 % ahead of the prior year (our interpretation of “comfortably ahead”). Within our revenue estimate the main increase is for placing commissions (see Exhibit 3 below), while we have allowed for a modest upgrade of advisory fees and left other segments unchanged.
Exhibit 3: Revenue and total income estimate changes
£m |
Old |
New |
Unchanged |
Change |
09/17e |
09/17e |
09/18e |
09/17e |
|
Net trading gains |
9.0 |
9.0 |
7.0 |
0.0% |
Institutional commissions |
35.9 |
35.9 |
35.0 |
0.0% |
Net institutional income |
44.9 |
44.9 |
42.0 |
0.0% |
Corporate retainers |
11.6 |
11.6 |
12.0 |
0.0% |
Advisory fees |
15.9 |
16.9 |
18.5 |
6.3% |
Placing commissions |
44.5 |
52.6 |
47.0 |
18.3% |
Total revenue |
116.9 |
126.0 |
119.5 |
7.8% |
Other operating income |
3.0 |
3.0 |
0.7 |
0.0% |
Total income |
119.9 |
129.0 |
120.2 |
7.6% |
Source: Edison Investment Research
Below the revenue line the main change is in our staff cost assumption with an increase in variable compensation diluted by fixed costs resulting in a sub-5% increase in overall costs allowing operational gearing to come into play and our EPS estimate to increase by over 15% (exhibit 4).
Exhibit 4: Estimate revisions
Revenue (£m) |
PBT (£m) |
EPS (p) |
DPS (p) |
|||||||||
Old |
New |
Change |
Old |
New |
Change |
Old |
New |
Change |
Old |
New |
Change |
|
09/17e |
116.9 |
126.0 |
7.8% |
30.1 |
35.1 |
16.8% |
20.6 |
23.8 |
15.4% |
12.0 |
12.0 |
0.0% |
09/18e |
119.5 |
119.5 |
0.0% |
30.8 |
30.8 |
0.0% |
21.0 |
21.0 |
0.0% |
12.5 |
12.5 |
0.0% |
Source: Edison Investment Research
Further details of our estimates including balance sheet and cash flow figures are included in our financial summary (Exhibit 9).
Board changes
Numis also announced three prospective board changes. Finance director Simon Denyer is to step down from the board and leave in January 2018 after more than 11 years with the company. Following 16 years at Numis as a leading media analyst and more recently as head of media banking, Lorna Tilbian is to stand down and leave the company at the end of 2017. Finally, Marcus Chorley is to stand down from the board in September but will remain in his role as chairman of equities.
Andrew Holloway will succeed Simon Denyer as finance director having joined Numis in 2009 following roles in corporate finance and corporate broking at Deloitte and Dresdner Kleinwort Wasserstein. He is currently managing director and head of FIG within the Corporate Broking and Advisory department.
The changes, in part, reflect the normal process of individual directors reaching a stage at which they wish to pursue other interests. Also, following the succession planning which lead to the appointment of new co-CEOs last year, the company has sought a more streamlined board with greater balance between executive and non-executive directors. The prospective board composition in Exhibit 5 shows the new shape of the board once the announced changes have taken place.
Exhibit 5: Prospective board composition and changes
Board members |
Role |
Date of joining |
||
Prospective board following announced changes |
||||
Executive directors |
||||
Alex Ham |
Co-CEO |
Sep-16 |
||
Ross Mitchinson |
Co-CEO |
Sep-16 |
||
Andrew Holloway |
CFO |
Jan-18 |
||
Independent non-executive directors |
||||
Alan Carruthers |
Chairman |
Mar-17 |
||
Geoffrey Vero |
Apr-03 |
|||
Robert Sutton |
May-14 |
|||
Catherine James |
May-14 |
|||
Prospective and recent board departures |
Date standing down |
|||
Oliver Hemsley |
Founder and former CEO remains as adviser at least until May 2018 |
May-17 |
||
Marcus Chorley |
Chairman of equities stepping down from board but remains in current role |
Sep-17 |
||
Lorna Tilbian |
Head of media sector - leaving company December 2017 |
Sep-17 |
||
Simon Denyer |
Group finance director and co. secretary - leaving company |
Jan-18 |
||
Source: Edison Investment Research, Numis Corporation
Valuation
In the table below we have updated our comparison with UK brokers and US/European investment banks. As a supplementary reference we also include average figures for auctioneers, interdealer brokers and estate agents on the basis that they act as intermediaries and provide advisory services. The significant differentiation of these businesses qualifies the comparison but in broad terms we can see that Numis trades below the average level of P/Es for each sector and on a higher yield. In terms of price to book it is similar to or below the averages with an above average ROE.
Exhibit 6: Peer comparison
Price (local) |
Market cap (£m) |
Last reported PER (x) |
Current PER (x) |
Yield (%) |
Price to Book (x) |
ROE (%) |
|
UK brokers |
|||||||
Numis |
258.75 |
281 |
11.0 |
10.9 |
4.6 |
2.2 |
17.4 |
Arden |
43.5 |
14 |
loss |
0.0 |
1.4 |
-14.8 |
|
Cenkos |
100.0 |
57 |
21.3 |
8.9 |
6.0 |
2.1 |
10.0 |
Shore Capital |
252.5 |
54 |
42.1 |
19.3 |
2.0 |
0.9 |
2.2 |
WH Ireland |
147.0 |
41 |
loss |
0.0 |
3.0 |
-6.9 |
|
UK brokers average |
24.8 |
13.0 |
2.5 |
1.9 |
1.6 |
||
US European IB and advisory |
|||||||
Bank of America |
24.5 |
182,382 |
15.5 |
13.5 |
1.0 |
1.0 |
7.4 |
Evercore |
78.6 |
3,873 |
28.7 |
15.3 |
1.6 |
6.7 |
41.0 |
Goldman Sachs |
226.2 |
69,936 |
13.7 |
12.3 |
1.1 |
1.2 |
10.6 |
Greenhill |
18.1 |
405 |
9.5 |
34.2 |
9.9 |
1.9 |
20.3 |
JP Morgan |
92.7 |
248,895 |
14.9 |
13.7 |
2.0 |
1.4 |
10.7 |
Moelis |
40.2 |
2,030 |
21.9 |
18.3 |
8.4 |
7.9 |
21.6 |
Morgan Stanley |
47.1 |
65,842 |
15.8 |
13.6 |
1.5 |
1.3 |
9.1 |
Stifel |
50.0 |
2,584 |
43.1 |
14.6 |
0.0 |
1.3 |
4.5 |
Credit Suisse |
14.9 |
29,726 |
loss |
19.5 |
4.5 |
0.9 |
-3.8 |
Deutsche Bank |
15.1 |
28,053 |
loss |
14.2 |
1.1 |
0.5 |
-1.4 |
UBS |
17.5 |
50,923 |
loss |
12.9 |
0.0 |
1.2 |
7.7 |
US, European IB/average |
20.4 |
16.5 |
2.8 |
2.3 |
11.6 |
||
Auctioneers average |
33.6 |
22.9 |
1.8 |
3.9 |
14.2 |
||
Interdealer brokers average |
28.9 |
16.6 |
4.7 |
2.8 |
8.7 |
||
Estate agents average |
18.3 |
16.9 |
2.3 |
1.9 |
8.1 |
Source: Bloomberg. Note: Priced at 2 August 2017.
Our ROE/COE model, using assumptions of an ROE of 19% (equivalent to the 2014-18e average), a cost of equity of 10% and growth of 5%, applied to the H117 NAV gives central value of 323p (318p previously based on the FY16 NAV). The sensitivity of this valuation to changing growth and ROE assumptions is illustrated in Exhibit 7.
Exhibit 7: ROE/COE valuation output variations (value per share, p)
Growth rate (right) Return on equity |
2.0% |
4.5% |
5.0% |
5.5% |
6.0% |
12% |
144 |
157 |
162 |
167 |
173 |
16% |
202 |
241 |
254 |
269 |
289 |
19% |
245 |
304 |
323 |
346 |
375 |
24% |
318 |
409 |
439 |
475 |
520 |
28% |
375 |
493 |
531 |
577 |
635 |
Source: Edison Investment Research
Finally, Exhibit 8 compares the recent share price performance for UK brokers and US/European investment banks. Here there is significant variation but from 12 month highs Numis’ performance has been similar to both the UK and investment bank averages. More recently, while the share price has bounced quite sharply in response to encouraging trading news, the three-month return remains negative, perhaps supporting the idea that there is further scope for rerating.
Exhibit 8: Share price performance (%)
1 Month |
3 Months |
1 Year |
YTD |
From 12m high |
|
Numis |
5.7 |
-6.4 |
42.2 |
5.3 |
-10.9 |
Arden |
6.1 |
27.9 |
77.6 |
29.9 |
-1.1 |
Cenkos |
2.0 |
-12.7 |
-18.4 |
38.9 |
-24.8 |
Shore Capital |
0.0 |
2.0 |
1.0 |
12.2 |
0.0 |
WH Ireland |
4.3 |
13.1 |
50.8 |
20.5 |
-5.2 |
UK broker average |
3.6 |
4.8 |
30.6 |
21.3 |
-8.4 |
US European IB and advisory |
|||||
Bank of America |
1.0 |
4.2 |
73.5 |
10.9 |
-5.0 |
Evercore |
11.5 |
5.3 |
59.9 |
14.4 |
-5.7 |
Goldman Sachs |
1.9 |
0.5 |
44.9 |
-5.5 |
-11.3 |
Greenhill |
-10.0 |
-27.9 |
-3.5 |
-34.7 |
-44.2 |
JP Morgan |
1.5 |
7.2 |
45.7 |
7.5 |
-1.9 |
Moelis |
3.3 |
8.7 |
74.9 |
21.6 |
-10.5 |
Morgan Stanley |
5.7 |
8.7 |
68.3 |
11.5 |
-1.9 |
Stifel |
8.7 |
3.2 |
47.0 |
0.1 |
-11.7 |
Credit Suisse |
7.6 |
6.6 |
54.8 |
10.8 |
-2.2 |
Deutsche Bank |
-2.5 |
-9.2 |
51.0 |
-1.7 |
-15.1 |
UBS |
3.1 |
4.8 |
39.7 |
15.7 |
-4.4 |
US, European IB/advisory average |
2.2 |
0.3 |
47.0 |
2.8 |
-11.5 |
Source: Bloomberg. Note: Priced at 2 August 2017.
Exhibit 9: Financial summary
£'000s |
2015 |
2016 |
2017e |
2018e |
||
Year end 30 September |
||||||
PROFIT & LOSS |
||||||
Revenue |
|
|
97,985 |
112,335 |
126,038 |
119,500 |
Other operating income |
|
|
(1,978) |
3,759 |
2,991 |
700 |
Total income |
|
|
96,007 |
116,094 |
129,029 |
120,200 |
Cost of Sales (excl. amortisation and depreciation) |
(65,018) |
(76,120) |
(81,017) |
(78,247) |
||
Share based payment |
(4,104) |
(6,229) |
(11,675) |
(10,000) |
||
EBITDA |
|
|
28,863 |
29,986 |
33,346 |
31,253 |
Depreciation |
|
|
(882) |
(1,126) |
(1,214) |
(1,214) |
Amortisation |
(111) |
(125) |
(88) |
(88) |
||
Op. profit (incl. share-based payouts pre-except.) |
|
|
27,870 |
28,735 |
32,044 |
29,951 |
Net finance income |
190 |
37 |
100 |
100 |
||
Other operating income |
(1,978) |
3,759 |
2,991 |
700 |
||
Profit Before Tax |
|
|
26,082 |
32,531 |
35,135 |
30,751 |
Tax |
(4,533) |
(6,132) |
(7,135) |
(5,995) |
||
Profit after tax (FRS 3) |
|
|
21,549 |
26,399 |
28,000 |
24,756 |
Average diluted number of shares outstanding (m) |
117.6 |
118.0 |
117.5 |
118.1 |
||
EPS - basic (p) |
19.5 |
23.5 |
25.1 |
22.1 |
||
EPS - diluted (p) |
|
|
18.3 |
22.4 |
23.8 |
21.0 |
Dividend per share (p) |
11.50 |
12.00 |
12.00 |
12.50 |
||
NAV per share (p) |
102.0 |
113.5 |
127.5 |
136.9 |
||
ROE (%) |
19% |
22% |
20% |
17% |
||
EBITDA margin (%) |
29.5% |
26.7% |
26.5% |
26.2% |
||
Operating margin (before GW and except.) (%) |
28.4% |
25.6% |
25.4% |
25.1% |
||
BALANCE SHEET |
||||||
Fixed assets |
|
|
6,724 |
5,522 |
5,580 |
4,778 |
Current assets |
|
|
279,114 |
312,462 |
331,439 |
342,574 |
Total assets |
|
|
285,838 |
317,984 |
337,019 |
347,352 |
Current liabilities |
|
|
(170,319) |
(188,895) |
(192,835) |
(192,835) |
Long term liabilities |
0 |
(12) |
(11) |
(11) |
||
Net assets |
|
|
115,519 |
129,077 |
144,173 |
154,506 |
CASH FLOW |
||||||
Operating cash flow |
|
|
6,467 |
48,735 |
35,129 |
30,658 |
Net cash from investing activities |
(3,632) |
84 |
(119) |
(100) |
||
Net cash from (used in) financing |
(17,510) |
(19,580) |
(25,858) |
(24,423) |
||
Net cash flow |
|
|
(14,675) |
29,239 |
9,152 |
6,135 |
Opening net (cash)/debt |
|
|
(74,518) |
(59,591) |
(89,002) |
(97,979) |
Fx effect |
|
|
(252) |
172 |
(175) |
0 |
Closing net (cash)/debt |
|
|
(59,591) |
(89,002) |
(97,979) |
(104,114) |
Source: Edison Investment Research, Numis Corporation accounts
|
|
Research: TMT
YouGov’s FY17 year-end trading update confirms that positive trading momentum continued in the second half for Data Products and Services. Results should be ahead of our previous forecasts and well ahead of market growth. The results reflect the growth in high-margin products as well as margin improvements in custom research in addition to some currency benefit. We have moved our PBT numbers up by 5% for FY17e and 9% for FY18e. The shares continue to trade at a premium to the global sector, although that is being eroded by YouGov’s faster growth.