Last close As at 05/08/2026
—
— 0.00 (0.00%)
Market capitalisation
—
Research: Metals & Mining
Record Q4 emerald and ruby auctions, which generated US$37.8m and US$88.4m respectively, took Gemfields’ total gemstone auction sales for 2021 to US$239.6m, an all-time high that exceeds the 2019 total of US$200.6m. The results indicate a strong market for coloured gemstones. Gemfields provides investors with unique exposure to this subsector and we have updated our forecasts to reflect stronger gemstone prices.
Written by
Gemfields Group |
Coloured gemstones’ time to sparkle and shine |
Auction results |
Metals & mining |
16 December 2021 |
Share price performance
Business description
Next events
Analysts
Gemfields Group is a research client of Edison Investment Research Limited |
|||||||||||||||||||||||||||||||||||||||||||||||
Record Q4 emerald and ruby auctions, which generated US$37.8m and US$88.4m respectively, took Gemfields’ total gemstone auction sales for 2021 to US$239.6m, an all-time high that exceeds the 2019 total of US$200.6m. The results indicate a strong market for coloured gemstones. Gemfields provides investors with unique exposure to this subsector and we have updated our forecasts to reflect stronger gemstone prices.
Year end |
Revenue (US$m) |
PBT* |
EBITDA (US$m) |
EV/EBITDA |
EPS* |
P/E |
12/19 |
216.2 |
55.9 |
80.9 |
2.9 |
1.3 |
14.1 |
12/20 |
34.6 |
(84.7) |
(30.0) |
N/A |
(6.1) |
N/A |
12/21e |
249.7 |
74.4 |
98.1 |
2.4 |
2.2 |
8.4 |
12/22e |
277.7 |
79.7 |
107.9 |
2.1 |
2.5 |
7.4 |
Note: *PBT and EPS are normalised, excluding amortisation of acquired intangibles, exceptional items and share-based payments.
Strong Q4 auctions: Lifting gemstone price forecasts
Gemfields generated US$126.2m from its two Q4 auctions (US$88.4m from Montepuez Ruby Mining (MRM) and US$37.8m from Kagem) versus our expectation of around US$73m in revenues from these two auctions, with the difference driven by stronger pricing rather than volumes. The result reflects the strength of the coloured gemstone market, with Gemfields commenting that it is seeing a step change in demand from customers. We are increasing our forecast gemstone prices by between 10% (for long-term ruby prices) and 22% (for high-quality emeralds). Our price assumptions (which consider longer-term prices achieved, as well as this year’s results) remain below the pricing achieved in the latest auctions.
Forecast FY21 EBITDA of US$98.1m
Updating FY21 forecasts for the outstanding auction results achieved in Q4, we now expect FY21 EBITDA of US$98.1m (from US$56.2m), PBT of US$74.4m (from US$32.5m) and EPS of 2.2c (from 0.4c). We expect Gemfields to end FY21 with net cash of US$34.7m (previously US$8.6m). Our FY22 forecast EBITDA of US$107.9m (from US$78.6m) would put Gemfields on an FY22 EV/EBITDA multiple of 2.0x. We expect Gemfields to end FY22 with net cash of US$52.9m (US$15.9m).
Valuation: Updated SOTP of US$502m, ZAR6.85/share
Updating our discounted cash flow (DCF) modelling for stronger pricing, we now calculate a DCF sum of the parts (at a 10% discount rate) of US$502m (previously US$367m). Within that, Kagem’s attributable valuation has increased by 42% to US$256m and MRM’s valuation by 19% to US$362m. Despite Gemfields’ share price having increased by more than 100% this year, our valuation implies further upside potential.
Investment summary
Company description: Significant coloured gemstone producer
The coloured gemstone market is fragmented and, as the only major listed producer, Gemfields provides investors with a unique opportunity to gain exposure to this subsector. In addition to its 75% share in the Kagem Emerald Mine (Zambia) and 75% share in MRM, Mozambique, Gemfields also owns 100% of the Fabergé jewellery business and historic brand.
Valuation: SOTP of US$502m, ZAR6.85/share or 32.5p/share
We value Gemfields using a sum-of-the-parts DCF valuation model with a 10% discount rate. Following the strong auction results this year, we have increased our emerald and ruby price forecasts by between 10% (for long-term ruby prices) and 22% (for high-quality emeralds), driving an increase in our valuation to US$502m (from US$367m). As pricing can vary from auction to auction, our price forecasts take into account longer-term prices achieved, as well as this year’s auction results, and remain below the most recent auction prices. MRM is the largest contributor to group value, with our updated valuation being US$362m (from US$303m), followed by Kagem’s US$256m (from US$180m).
Financials: Raising forecasts on strong auction pricing
Against the backdrop of ongoing travel restrictions, which have disrupted Gemfields’ usual auction process, the company nevertheless achieved record 2021 auction sales of US$239.6m. The November/December high-quality (HQ) emerald auction (which included the sale of the exceptional 7,525ct ‘rhino emerald’) generated a record US$37.8m at a record average price of US$150.65/ct and the November/December auction of mixed-quality MRM rubies also saw record total sales of US$88.4m (at US$132.47/ct).
Gemfields describes what it is seeing as a ‘step change in both market demand and the prices bid by our customers’. This strong demand is also evidenced elsewhere in the sector. At Phillips’s recent auction of emerald jewellery from a private collector, Treasures from Zambia, of the top 10 lots sold by value, seven exceeded the top end of their pre-auction estimate ranges and five did so by more than 100%.
Updating our FY21 forecasts for the actual November/December auction results and our FY22 forecasts for stronger emerald and ruby prices (with forecast production and sales volumes unchanged) sees our FY21 EBITDA estimate increase to US$98.1m and FY22 to US$107.9m. We now expect Gemfields to end FY21 with net cash of US$34.7m and FY22 with net cash of US$52.9m. We have not forecast any dividend payment for FY21, although the strong cash position and cash flow generation could enable the company to consider one.
Exhibit 1: Key financial metrics
EBITDA (US$m) |
Normalised EPS (c) |
Net cash (US$m) |
|||||||
Old |
New |
% chg. |
Old |
New |
% chg. |
Old |
New |
% chg. |
|
2021e |
56.2 |
98.1 |
74% |
0.4 |
2.2 |
504% |
8.6 |
34.7 |
301% |
2022e |
78.6 |
107.9 |
37% |
1.2 |
2.5 |
110% |
15.9 |
52.9 |
232% |
Source: Edison Investment Research
Sensitivities: Product variability and Mozambique country risk
As with any mining company, Gemfields has numerous operational risks, including risk from COVID-19. However, from an investment perspective we would highlight two key risks:
■
Mozambique country risk: Gemfields’s most important asset, MRM, is located in northern Mozambique, a region that has suffered from recent significant political unrest.
■
Variability in premium gemstone production: the bulk of Gemfields’ revenue by value comes from just the top 3–4% of production by volume and this can be subject to significant variability from period to period (in both negative and positive directions). Production of premium emeralds and rubies since production resumed in March 2021 (through to the last reported figures in August 2021) was broadly in line with 2018/19 levels.
Kagem
Gemfields is the 75% owner of Kagem emerald mine in Zambia with the remaining 25% held by the Zambian government. Kagem is one of the largest emerald mines in the world and sells its production through one to two HQ and one to two commercial-quality (CQ) auctions each year. Currently stones are being made available for viewing in Dubai and Jaipur before being auctioned online.
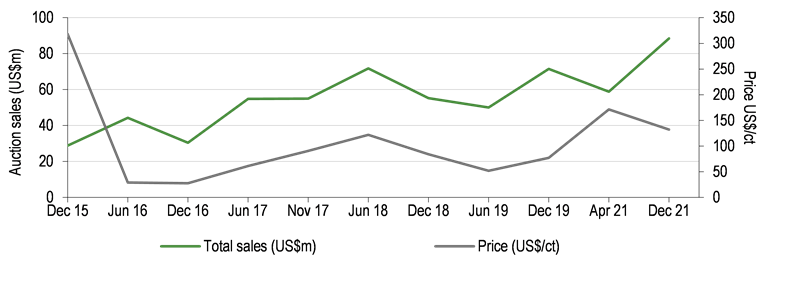
The series of five mini auctions in November/December (which included the sale of the exceptional 7,525ct ‘rhino emerald’) generated a revenue record for any Gemfields HQ emerald auction of US$37.8m with pricing of US$150.65/ct also reaching an all-time high.
|
Exhibit 2: Kagem HQ auction results |
|
|
Source: Gemfields Group |
Following this trend of strong auction results we are now increasing our long-term forecast price for Kagem HQ auctions to US$81.55/ct (being the five-year weighted average price achieved to December 2021) from US$67.03/ct previously (our previous price was equal to the five-year weighted average from 2014–19 plus 2.5%). Our updated forecast remains nevertheless well below the latest auction price of US$150.65/ct (which may have been upwardly biased by the sale of the large rhino emerald) and also below the April 2021 price of US$115.59/ct; prices will fluctuate from auction to auction depending on the mix of stones sold and we believe the five-year average provides a more robust assumption. However, it is possible that the recent auctions are indeed indicative of a more significant step-change in pricing, in which case even these upwardly revised forecasts may prove conservative.
We have also applied the five-year average to CQ forecasts, giving us a forecast CQ auction price of US$4.55/ct versus US$3.95/ct previously (with the previous forecast being the five-year weighted average from 2014–19 less 2%).
|
Exhibit 3: Kagem CQ auction results |
|
|
Source: Gemfields Group, Edison Investment Research |
Montepuez Ruby Mining (MRM)
MRM is the single largest ruby mine in the world, producing around half of the world’s ruby supply through shallow open-pit mining. Gemfields owns 75% of MRM with the remainder held by a local partner. Construction of a second wash plant is currently underway at MRM, which will allow for processing of greater volumes of material annually, including more of the (lower-grade) primary deposits in addition to the (higher-grade) secondary gravels, which are the current focus. MRM production is ordinarily sold twice a year at mixed-quality auctions. Currently, given the difficulties that travel restrictions pose to international buyers, Gemfields is showing the stones in Bangkok, Dubai and Jaipur before auctioning them online in a series of ‘mini-auctions’.
MRM’s November/December 2021 mixed-quality auction sales of US$88.4m significantly exceeded our expectation – our forecasts had assumed around US$49m – and was sharply up from H121’s US$58.9m figure and a new record from an MRM auction. The average price of US$132.47/ct was below the exceptional April 2021 figure of US$171.33/ct. However, that figure was positively affected by a large parcel by weight of lower-quality stones that did not sell in the April auction.
|
Exhibit 4: MRM auction results – mixed quality |
|
|
Source: Gemfields Group |
With the strong auction results achieved in 2021, we have increased our forecast MRM FY22 prices by 15% from our previous forecast which, assuming no change to production or sales volumes, means that our forecast FY22 MRM revenue moves to US$155m. We have also increased FY23 and longer-term forecast MRM prices by 10%.
Because of the mix of stones mined at different areas of Montepuez, which have different grade and quality profiles, we expect future average prices per carat to be lower than current levels once the second wash plant ramps up in FY23. Our forecasts assume an average price of US$125.4/ct in FY22 and US$100.12/ct in FY23 (vs the US$145.6/ct achieved in FY21).
The chart below reflects our old and new revenue forecasts for MRM.
|
Exhibit 5: MRM revenue estimates |
|
|
Source: Gemfields Group, Edison Investment Research estimates |
Sensitivities
In addition to the normal operational, safety, environmental and other risks of any mining operation as well as COVID-19 related operational risks, Gemfields has two key risks that we think are of particular importance: grade and quality mix; and heightened political and security risks in Mozambique. Investors should also be cognisant of the risk that the coloured gemstone market could prove weaker than expected, although recent auction results point to a market that is currently very strong indeed.
Grade and quality mix of Gemstone production
The nature of Gemfields’ emerald and ruby mining operations is that there is high variability in the grade of gemstones recovered but also in the value of those stones. Premium emeralds make up less than 2% and premium rubies less than 4% of production by volume, but contribute more than 60% of revenue. In the past there have been periods where production of premium gemstones has fallen short of expectations (such as at Kagem in 2016 in 2017). While over the life of the mine the variability in gemstone grade and quality can equally provide upside as well as downside, investors should be cognisant of the short-term risk of high-quality production falling below expectations.
Heightened political and security risk in Mozambique
Since 2017, there has been a rise in insurgent attacks in the Cabo Delgado region in northern Mozambique, where Gemfields’ MRM mine is located. The insurgents are linked to Islamist militant groups with connections to Islamic State but are also tapping into local political grievances. Those attacks escalated through 2020 and it is estimated that some 650,000 civilians are currently displaced by the violence. In recent months, in coordination with Rwandan and Southern African Development Community (SADC) troops, Mozambique’s armed forces have continued to gain control over areas previously occupied by insurgents, but the situation remains fluid. Although the Montepuez district is some distance from the fighting and Gemfields’ operations have not been directly affected, the security situation in this region is a key risk for Gemfields.
Valuation
As previously, we value Gemfields on a DCF sum-of-the-parts basis (at a 10% discount rate):
■
Our updated sum-of-the-parts valuation totals US$502m or 32.5p per share (previously US$367m or 24p per share).
■
The rand per-share valuation of ZAR6.85 (previously ZAR4.69), of interest mostly to South African investors, is also positively affected by the impact of the weaker rand (ZAR15.95/US$ versus ZAR14.95/US$ previously) on the translation of our US dollar-driven valuation of Gemfields to rand per share.
Compared to previously, the change in our valuation reflects the increase in forecast pricing, which lifts Kagem’s attributable valuation by 42% to US$256m and MRM’s valuation by 19% to US$362m. Our valuation of Faberge remains unchanged at US$17m.
Gemfields is looking to realise value from its non-core 6.5% stake in Sedibelo Platinum Mines.
Exhibit 6: Sum-of-the-parts valuation
New valuation |
Previous valuation |
|
Kagem (75%) US$m |
256 |
180 |
Montepuez (75%) US$m |
362 |
303 |
Fabergé (100%) US$m |
17 |
17 |
Sedibelo (6.54%) US$m |
40 |
40 |
Corporate overheads US$m |
(159) |
(159) |
Net cash US$m (31 December 2020) |
(13) |
(13) |
Sum of the parts valuation US$m |
502 |
367 |
Rand per share |
6.85 |
4.69 |
Pence per share |
32.5 |
24 |
Source: Edison Investment Research
Financials
Following the strong H221 auction results, our forecast FY21 group revenue rises to US$249.7m (from US$196.4m previously). We now expect FY21 EBITDA of US$98.1m (previously US$56.2m) and EPS of 2.2c (previously 0.4c).
We now expect Gemfields to end 2021 with US$34.7m in net cash (previously US$8.6m) with a further US$53.0m in auction receivables from the November/December mini auctions to be received in early FY22. Although we have not currently forecast payment of a dividend for the FY21 financial year, the strong cash position could certainly enable the company to consider one and Gemfields has previously indicated that a sustainable dividend would be a priority for the group.
For FY22 we now forecast revenue of US$277.7m (previously US$239.8m), EBITDA of US$107.9m (from US$78.6m) and EPS of 2.5c (from 1.2c). We expect Gemfields to end FY22 with net cash of US$52.9m (previously US$15.9m).
Exhibit 7: Forecast key metrics
US$m |
Previous |
New |
Kagem revenue 2021 |
78.8 |
92.3 |
MRM revenue 2021 |
107.5 |
147.2 |
Faberge revenue 2021 |
10.1 |
10.1 |
Group revenue 2021 |
196.4 |
249.7 |
Cash mining and production costs 2021 |
(76.4) |
(81) |
Selling general and admin |
(51.8) |
(58) |
Change in inventory 2021 |
(12.0) |
(12) |
Group EBITDA 2021 |
56.2 |
98.1 |
PBT 2021 (reported basis) |
30.5 |
72.4 |
EPS 2021 (c) |
0.4 |
2.2 |
Closing net cash/(debt) 2021 |
8.6 |
34.7 |
Kagem revenue 2022 |
90.4 |
108.1 |
MRM revenue 2022 |
134.9 |
155.1 |
Faberge revenue 2022 |
14.5 |
14.5 |
Group revenue 2022 |
239.8 |
277.7 |
Group EBITDA 2022 |
78.6 |
107.9 |
PBT 2022 (reported basis) |
47.7 |
77.7 |
EPS 2022 (c) |
1.2 |
2.5 |
Closing net cash/(debt) 2022 |
15.9 |
52.9 |
Source: Edison Investment Research
Exhibit 8: Financial summary
US$m |
2018 |
2019 |
2020 |
2021e |
2022e |
||
Year end 31 December |
IFRS |
IFRS |
IFRS |
IFRS |
IFRS |
||
INCOME STATEMENT |
|||||||
Revenue |
|
|
206.1 |
216.2 |
34.6 |
249.7 |
277.7 |
Cost of Sales |
(123.5) |
(118.5) |
(58.0) |
(120.0) |
(132.1) |
||
Gross Profit |
82.5 |
97.8 |
(23.4) |
129.7 |
145.6 |
||
EBITDA |
|
|
58.9 |
80.9 |
(30.0) |
98.1 |
107.9 |
Operating Profit (before amort. and excepts.) |
|
28.2 |
46.1 |
(51.1) |
71.2 |
81.2 |
|
Fair value gains (losses) |
(41.9) |
14.3 |
(27.9) |
7.9 |
0.0 |
||
Exceptionals |
(22.6) |
13.2 |
(13.5) |
0.0 |
0.0 |
||
Share-based payments |
(4.2) |
(1.7) |
(0.9) |
(2.0) |
(2.0) |
||
Reported operating profit |
(40.4) |
71.9 |
(93.4) |
77.0 |
79.2 |
||
Net Interest |
(8.8) |
(4.5) |
(5.8) |
(4.7) |
(1.5) |
||
Joint ventures & associates (post tax) |
0.0 |
0.0 |
0.0 |
0.0 |
0.0 |
||
Profit Before Tax (norm) |
|
|
(22.5) |
55.9 |
(84.7) |
74.4 |
79.7 |
Profit Before Tax (reported) |
|
|
(53.9) |
67.4 |
(99.2) |
72.4 |
77.7 |
Reported tax |
(6.5) |
(28.2) |
6.0 |
(36.3) |
(36.8) |
||
Profit After Tax (norm) |
(29.0) |
27.6 |
(78.8) |
38.1 |
43.0 |
||
Profit After Tax (reported) |
(60.4) |
39.1 |
(93.2) |
36.1 |
41.0 |
||
Minority interests |
(1.8) |
(10.8) |
7.9 |
(12.0) |
(13.5) |
||
Net income (normalised) |
(30.8) |
16.9 |
(70.8) |
26.1 |
29.4 |
||
Net income (reported) |
(62.2) |
28.4 |
(85.3) |
24.1 |
27.4 |
||
Average Number of Shares Outstanding (m) |
1,170 |
1,265 |
1,169 |
1,170 |
1,170 |
||
EPS - normalised (c) |
|
|
(2.6) |
1.3 |
(6.1) |
2.2 |
2.5 |
EPS - normalised fully diluted (c) |
|
|
(2.6) |
1.3 |
(6.1) |
2.2 |
2.5 |
EPS - basic reported (c) |
|
|
(5.3) |
2.2 |
(7.3) |
2.1 |
2.3 |
Dividend per share (c) |
0.0 |
0.0 |
0.0 |
0.0 |
0.0 |
||
Revenue growth (%) |
152.4 |
4.9 |
(-84.0) |
622.3 |
11.2 |
||
Gross Margin (%) |
40.1 |
45.2 |
-67.8 |
51.9 |
52.4 |
||
EBITDA Margin (%) |
28.6 |
37.4 |
-86.9 |
39.3 |
38.9 |
||
Normalised Operating Margin |
13.7 |
21.3 |
-147.7 |
28.5 |
29.3 |
||
BALANCE SHEET |
|||||||
Fixed Assets |
|
|
509.7 |
507.4 |
457.9 |
443.8 |
453.9 |
Intangible Assets |
52.3 |
55.2 |
51.5 |
51.5 |
51.5 |
||
Tangible Assets |
365.0 |
376.9 |
362.7 |
355.9 |
367.9 |
||
Investments & other |
92.4 |
75.3 |
43.7 |
36.5 |
34.5 |
||
Current Assets |
|
|
224.4 |
276.8 |
198.8 |
269.2 |
268.9 |
Stocks |
99.2 |
110.7 |
117.8 |
106.4 |
95.4 |
||
Debtors |
62.1 |
87.8 |
37.1 |
71.1 |
74.6 |
||
Cash & cash equivalents |
63.0 |
78.2 |
43.9 |
91.7 |
98.9 |
||
Other |
0.0 |
0.0 |
0.0 |
0.0 |
0.0 |
||
Current Liabilities |
|
|
(60.6) |
(75.2) |
(59.5) |
(96.1) |
(80.7) |
Creditors |
(28.2) |
(29.9) |
(18.2) |
(25.0) |
(27.0) |
||
Tax payable |
(1.4) |
(16.3) |
(4.3) |
(29.1) |
(14.7) |
||
Short term borrowings |
(23.2) |
(24.8) |
(33.0) |
(38.0) |
(35.0) |
||
Other |
(7.9) |
(4.2) |
(4.0) |
(4.0) |
(4.0) |
||
Long Term Liabilities |
|
|
(123.4) |
(130.1) |
(114.2) |
(109.7) |
(101.7) |
Long term borrowings |
(30.0) |
(28.0) |
(23.5) |
(19.0) |
(11.0) |
||
Other long term liabilities |
(93.4) |
(102.1) |
(90.7) |
(90.7) |
(90.7) |
||
Net Assets |
|
|
550.1 |
578.9 |
483.0 |
507.2 |
540.3 |
Minority interests |
(73.9) |
(84.7) |
(70.4) |
(76.4) |
(80.1) |
||
Shareholders' equity |
|
|
476.2 |
494.3 |
412.6 |
430.8 |
460.3 |
CASH FLOW |
|||||||
Operating Cash Flow |
58.9 |
80.9 |
(30.0) |
98.1 |
107.9 |
||
Working capital |
(29.7) |
(25.7) |
25.5 |
8.9 |
(4.8) |
||
Exceptional & other |
0.3 |
(8.8) |
(0.6) |
0.0 |
0.0 |
||
Tax |
(24.4) |
(9.7) |
(15.0) |
(29.1) |
(34.8) |
||
Net operating cash flow |
|
|
5.1 |
36.7 |
(20.2) |
78.0 |
68.4 |
Capex |
(29.0) |
(30.8) |
(8.6) |
(20.0) |
(38.8) |
||
Acquisitions/disposals |
77.4 |
35.2 |
0.1 |
0.0 |
0.0 |
||
Net interest |
(4.4) |
(3.3) |
(4.1) |
(4.7) |
(1.5) |
||
Equity financing |
(4.7) |
(14.4) |
(0.2) |
0.0 |
0.0 |
||
Dividends |
(5.9) |
0.0 |
0.0 |
(6.0) |
(9.9) |
||
Other |
(2.9) |
(7.8) |
(5.0) |
0.0 |
0.0 |
||
Net Cash Flow |
35.6 |
15.6 |
(38.1) |
47.3 |
18.2 |
||
Opening net debt/(cash) |
|
|
25.7 |
(9.8) |
(25.4) |
12.6 |
(34.7) |
FX |
(0.1) |
0.0 |
0.1 |
0.0 |
0.0 |
||
Other non-cash movements |
0.0 |
0.0 |
0.0 |
0.0 |
0.0 |
||
Closing net debt/(cash) |
|
|
(9.8) |
(25.4) |
12.6 |
(34.7) |
(52.9) |
Source: Gemfields, Edison Investment Research
|
|||||||||||||||||||||||||||||||||||||||||
|
|
Research: Industrials
H122 results proved disappointing as Chess failed to deliver against expectations. The weakness at EID was anticipated, although there is a further deferral to its recovery. MCL, SEA, MASS and ELAC are all expected to make progress in FY22. However, this will not compensate for the shortfall at Chess and we have reduced our EPS estimates by 12% in FY22 and 8% in FY23 to reflect that. We expect that following a strong recovery in FY23, Cohort should return to sustainable growth in FY24.