BrainJuicer Group
BrainJuicer Group |
Driving flagship System 1 services |
Final results |
Media |
31 March 2016 |
Share price performance
Business description
Next events
Analysts
BrainJuicer Group is a research client of Edison Investment Research Limited |
|||||||||||||||||||||||||||||||||||||||||||||||||
BrainJuicer is more clearly focusing on driving its higher quality earnings streams in ad-testing, brand tracking and predictive markets. These areas of the business are growing faster, are more scalable and should drive higher margins than the one-off research projects and consultancy services that have formed much of the mix historically. The group has very strong cash generation and a debt free balance sheet. Proof that the shift in emphasis is paying off should help close the discount with other quoted market research companies.
Year end |
Revenue (£m) |
PBT* |
EPS* |
DPS |
P/E |
Yield |
12/14 |
24.6 |
4.3 |
21.3 |
4.3 |
14.2 |
1.4 |
12/15 |
25.2 |
4.5 |
22.7 |
4.5 |
13.3 |
1.5 |
12/16e |
27.0 |
5.0 |
25.3 |
5.0 |
12.0 |
1.7 |
12/17e |
29.0 |
5.8 |
29.6 |
5.8 |
10.2 |
1.9 |
Note: *PBT and EPS are normalised, excluding amortisation of acquired intangibles, exceptional items and share-based payments.
Core System1 products growing well
The group has stated that it is moving to a March year-end as from the current year so will publish 15-month numbers to March 2017 in due course. Our forecasts remain for a December year-end as pro-forma figures are not yet available. This change helps remove the potential volatility of operating profits in a sector where clients backload their spending to the final weeks of the year. FY15 results showed strong growth in the System1-driven gross profit (emotional, intuitive reactions, as opposed to System2 rational responses), with core products growing at 17%, more than offsetting the decline in the more commoditised areas and the high-level but expensive-to-deliver consultancy. New initiatives such as the creative agency and broadened distribution should deliver incremental growth and margin.
Inherently strong cash generation
The group has inherently strong cash generation, with little substantive capital requirement. Acquisitions have not figured to date, primarily due to the distinct culture of the group, although an aborted purchase (on valuation grounds) in H115 indicates that this option is not closed off. BJU has no debt and ended the year with net cash of £6.4m. It has a record of returning cash to shareholders through a combination of ordinary dividends, special dividends and share buy-backs.
Valuation: Sizeable discount on EV/EBITDA persists
The transition from ambitious upstart challenger to ambitious, high-profile industry champion has led to the earlier valuation premium being chipped away. The group trades at a discount to peers of 21-24% on a P/E basis across FY15, FY16e and FY17e; and at a larger differential on EV/EBITDA, our preferred measure. The discount is 35% for FY15; 30% for FY16e and 28% for FY17e, with BJU trading at 6.0x FY16e. Evidence that the growth strategy is paying off is a likely catalyst to close this gap.
Investment summary
Company description: Challenger thinker in market research
BrainJuicer has positioned itself as a challenger brand in the market research (MR) industry, using approaches based on behavioural economics to predict consumer actions and reactions to maximise the efficacy of its clients’ spend. These clients tend to be the largest multinational fast-moving consumer products (FMCG) groups and their spend with BrainJuicer represents a very small part of their overall spend. Small increases in these budget allocations could therefore have a very material effect on BrainJuicer’s scale. It has grown organically over its 16-year history, overseen by founder John Kearon (CEO), from a small, UK-based concern, to a multinational supplier, generating 67% of its gross profit and 61% of operating profits overseas. It has a broad spread of clients, with the largest representing 7% of revenue.
Valuation: Strong cash characteristics underpin rating
We evaluate BrainJuicer in a peer group primarily of global MR suppliers, although some peers are part of larger agency groupings such as WPP. Compared to the pure quoted sector, BJU trades at a multiple of 6.0x current year EV/EBITDA versus 9.8x, but operates at an EBITDA margin of 19.9%, ahead of the peer group of 18.4%.
Financials: Growing and throwing off cash
While traditionally companies have either been categorised as ‘growth’ or ‘cash cows’, BrainJuicer has grown strongly over the years but has less requirement either for capital investment or working capital absorption than might companies with similar growth profiles in other industries.
Having grown entirely organically and with no previous appetite for acquisitions, cash has been returned to shareholders via a combination of share buybacks and special dividends. Over the last five years, the group has returned a total of £56.17m to shareholders in dividends and £3.56m in share buy-backs. Year-end cash (no debt) was nevertheless £6.37m.
FY15 figures showed gross profit growth of 4% and operating profit ahead by 6%. The growth in those areas identified as core products was 17%, with an increasing emphasis on ongoing regular repeat business.
Sensitivities: Timing issue addressed
The group is addressing a key historic sensitivity with its intention to move the financial year end from December to March. To date, the outcome of any particular financial period was heavily dependent on the final few weeks of the year, when clients’ unutilised marketing budgets are used up. This complicated forecasting and increased volatility in working capital at the balance sheet date. BrainJuicer is a growth business and the alignment of the timing of the recruitment of people to support a larger business and the revenues coming in to recover the additional cost can easily get out of sync. Management has demonstrated that it can react to this situation when it arises. Other sensitivities relate to key client risks and personnel regarding recruitment and retention, and changes to the competitive landscape.
Company description: System-1 marketing and research
BrainJuicer’s business is based around acknowledging that human decision-making is primarily a function of emotional and instinctive stimuli – as described by Nobel Prize winner Daniel Kahneman, people’s choices are often unconscious and highly influenced by their social, personal and environmental context, which he categorises as System 1 versus System 2 thinking. The latter is the rational process (which we tend to believe, via post-rationalisation, drives our decisions).
Humans are unreliable witnesses and predictors of our own behaviour. Traditional market research (MR) seeks to ascertain respondents’ self-reported rational reactions to stimuli, which are often coloured by the way in which that respondent wants to be regarded, either consciously or unconsciously. BrainJuicer has questioned whether this – rationality and logicality – was indeed the way in which individuals made decisions, including the observation that we are better at predicting the likely behaviour of others than our own. BrainJuicer has developed its business around the concepts described above and has built a range of proprietary tools (an ongoing programme within a dedicated unit, BrainJuicer Labs) that particularly seek to draw out consumers’ emotional reactions. These can relate to ideas, marketing and packaging materials or products and insight generation, feeding back into the client’s process to maximise the commercial prospects. In the area of new product development, these tools are used to identify and evaluate those ideas likely to be commercially successful, so saving clients money on development costs for those that never reach the market. Similarly in ad pre-testing, they identify those marketing messages most likely to trigger stronger emotional reactions in the viewer.
The company was established by John Kearon, the CEO, in 1999, floating on AIM in 2006. Its original business premise was simple. MR was based on asking questions of a sampled panel, primarily face-to-face or over the telephone, and feeding the results back to the client for them to utilise as they saw fit. The democratisation of the web presented BrainJuicer with an opportunity to come at the issue from a variety of different angles, without the legacy business model that requires volume throughput to cover overhead.
Rather than simply reinterpret the industry for new delivery and implementation channels, though, the group had a more radical approach – rethinking the questions as well as the way to get the answers and moving beyond the industry focus on the methodology rather than the purpose.
|
Exhibit 1: GP by revenue stream |
Exhibit 2: GP by geography |
|
|
|
Source: BrainJuicer |
|
Exhibit 1: GP by revenue stream |
|
|
Source: BrainJuicer |
|
Exhibit 2: GP by geography |
|
|
Source: BrainJuicer |
The market for pre-testing of advertising is a substantial element of the MR industry (ESOMAR estimates 2% of the $43bn global total MR market, ie around $0.9bn), and has understandably been a mainstay of the MR industry with somewhat embedded incumbents, methodologies and tracking studies. Newer BrainJuicer tools, specifically designed for appraisal of advertising, make use of emotional engagement – a far better stimulus to unprompted viewer/listener recall and a substantially better signal that a campaign may go viral, with significantly better ROI possibilities.
New methodologies and techniques are understandably a favourite talking point at industry conferences and generate many column inches in the trade press, on and offline. However, it is undoubtedly a harder sell into clients. They may be happy to learn about and talk over new approaches but can prove reluctant to commit to leaving behind their established working practices. It can take a long time and repeated demonstrations for a supplier to establish sufficient credibility in the market, particularly for mandates, where there is a body of relevant historical data that will need to be rebuilt. BrainJuicer has deliberately sought (and been very successful in building) a high industry profile to gain airtime for its products and concepts. The annual industry GRIT Reports consistently place BrainJuicer at the head of the list of those in the MR industry that are the most innovative, well ahead of Vision Critical and Kantar, etc. This industry recognition has enabled the group to be included on pitch lists that would normally be inaccessible because of its size and historical limited geographic coverage.
|
Exhibit 3: Gross profit by revenue stream |
|
|
Source: BrainJuicer |
The group has historically divided its offer into two categories: Juicy and Twist. Twist refers to more traditional/recognisable MR approaches, albeit incorporating an element of behavioural economics. Juicy is the terminology used for its more ‘radical’ approaches, tools and processes. As the group has evolved, this approach would now mask much of the strengths of the business model and a new breakdown of the revenue streams is helpful to highlight the improving quality of the earnings. Juicy can be broadly equated to ‘System1’, with Twist more ‘System2’. Ad testing and brand tracking, Predictive markets and other Juicy System1 quantitative can all be viewed together as System1-based operations and these form the core of the growth strategy.
The Twist quant element of the business was half of gross profit in 2010 but has since fallen to 15% (also retreating in absolute terms). Although BrainJuicer’s Twist offer was differentiated, it was insufficient to fight off the impact of commoditisation within the industry and price pressure from procurement. Sales effort behind Twist has therefore been diverted to more remunerative business areas.
The Juice Generation Qualitative business, which includes the behavioural consultancy unit, was viewed as a strong entry point into clients at a high level, leading on to more predictable revenue streams. Although the first part of that has come through, it is the second part of the process that has not played out as expected, with the connection between the two not sufficiently linked, particularly in the case of ad-testing. The individuals involved in delivering these projects have now set up independently, so the service can still be offered, not at BrainJuicer’s direct cost.
Driving repeatable revenue streams
Both ad-testing and brand tracking are attractive market areas on which to focus, providing ongoing business, often as sole supplier. Good ad-testing (identifying those ads that will have the greatest impact and – ultimately – stimulate the clients’ sales) can prevent vast amounts of wasted spend. BrainJuicer’s approach is based upon identifying the attributes of Feeling, Fame and Fluency, which together underpin brand building. Although evaluating each campaign is in effect a separate project, being seen by the ad industry as driving successful choices by agencies and their clients builds reputation and generates repeat and new business.
Brand tracking (determining the relative health of brands out in the market) is, by definition, ongoing revenue. Having scalable and repeatable revenue streams making up an increasing proportion of gross profit should enable better resource planning and improve margin.
Predictive markets is the other key component of the ongoing focus of the group’s efforts and was the largest contributor to gross profit in FY15. This is based on the Wisdom of Crowds concept as described by James Surowiecki in his 2004 book of the same name. BrainJuicer’s interpretation involves asking people to identify what they think other people will do or think, through ‘buying’ or ‘selling’ alternative options to reach an interpolated preference. It is typically used to pre-test product or packaging ideas and has grown its gross profit by a CAGR of 18% over the last five years.
Adding to the offer
BrainJuicer has recently launched a creative agency, predicated on using the same System-1 approaches. Rather than set up a traditional agency through investing in creative talent, with all the attendant overhead and management resource, the ideas and concepts will be generated by a network of known creatives globally. System1 agency will not pitch against peers in the normal way, but will only present ideas that have screened very strongly through BrainJuicer’s pre-testing. Upfront investment is likely to be of the order of £0.3m, with further funding approval depending on initial progress.
The distinctive corporate culture has historically meant that acquisitions have not formed a key part of the growth strategy. In this last financial year, however, the group did come close to buying another operation. The deal did not proceed and the costs involved were wrapped up in with the disclosed operating costs of moving offices at a total of £0.32m, taken in H115.
Broadening the distribution
At the commodity end of the market research market, there has been increased interest in automation and in DIY approaches. ZappiStore has emerged as a key actor in this process, providing an IP platform on which clients and suppliers can share tools and solutions. BrainJuicer has launched two of its solutions (in ‘lite’ forms) on this platform to allow access for its approaches at a lower price point, on a revenue-share model. Further information on the platform and on this deal is given in this article.
Management strength in depth
Through the early stages of its corporate history, BrainJuicer was virtually synonymous within its market with its founder, CEO John Kearon, who owns 30.4% of the equity. His earlier career included research and marketing functions at Unilever and time at Publicis, where he became planning director. He founded an innovation agency, Brand Genetics, which developed new product concepts for larger companies. The CFO, James Geddes, has been with the group since 2003, joining at the time Unilever Ventures made its investment. He was previously CFO of IOBox (sold to Telefonica for £230m) and before that held positions at MediaOne Group and Fosters Brewing.
Over more recent years, the corporate infrastructure has been considerably strengthened, notably through the 2010 appointment of Alex Batchelor as COO (Unilever, Interbrand, Orange, Royal Mail and TomTom) and earlier appointments of the regional directors. Jim Rimmer is now global research director, having joined BrainJuicer in 2006 as UK MD. He previously had senior roles in research agencies such as Research International and SGA. With these results, the group announced new geographical heads: Alex Hunt for the Americas and Mark Johnson in charge of UK and Continental Europe. The group now has the maturity for a more formal graduate recruitment and development programme, initially in the UK then rolling out to the US.
The research and development arena, known as BrainJuicer Labs, is run by Orlando Woods, who is a regular speaker and presenter of ideas and concepts at MR industry events. Susan Griffin, who heads up the company’s marketing and business development function, completes the large senior management team.
Industry and clients searching for innovation
The global market research industry was estimated by industry-body ESOMAR, to be have been worth around US$43bn in 2014. Although this looks like solid growth over prior year of US$40.3bn, there have been definitional changes as market research itself has become more broadly sourced (through self-serve and through the larger consultancies) and the effective growth in market size was minimal. The US is far and away the largest single market, valued at US$18.565bn, up 2% on prior year. Business of Evidence 2016, produced by PwC with the MRS in the UK, sizes the domestic market at £4.8bn (US$6.8bn), although the definitions may not be directly comparable.
Looking at the aggregate revenue figures from the quoted companies, growth was higher than overall market estimates at 5.8% in FY14, slowing to 3.3% in FY15. Analysts’ forecasts for FY16 and F17 are looking for a resumption of faster growth at 5.1% and 4.7% respectively.
The appetite for innovation among both researchers and clients is a clear feature, with speed of turnaround, pricing and accuracy key drivers, but also stimulated by changes in consumption of media and purchasing habits. The PwC report highlights key areas of growth as: data analytics; qualitative research; social media/web traffic monitoring; and online/mobile surveys.
|
Exhibit 4: Usage of new research techniques |
|
|
Source: GRIT Survey Q3-Q415 |
It is clear from the latest GRIT industry survey that mobile, online and social media-based analytics are approaching ‘old news’ status, with widespread adoption. Big data-type research is high on the register, with ‘smart data’ the new holy grail in this arena. The PwC survey points to research involving wearables, behavioural economics and neuroscience as the notable emergent methods. BrainJuicer’s core heart of behavioural economics and neuromarketing are in trends that GRIT defines as having “substantive levels of adoption and interest, but lack mainstream breakthrough”.
Sensitivities
The key sensitivity for the financial results has always been the marked tendency of clients to spend up their budgets in the final few weeks of the year, making predicting the full year figures more than usually fraught, as well as having implications for the volatility of the working capital position at 31 December. This has now been addressed with the stated intention to shift the year end to March. Fifteen-month figures will be issued to 31 March 2016 and half year figures to September in due course.
Managing the transitions, the timing of spend versus projected revenues, opening new territories and offices etc are crucial to financial performance. Our forecasts are based on the current business structure and geographic alignment. A number of factors could influence the outturn:
■
Managing the cost base. The alignment of central overhead and operating cost in a growing market with limited visibility always raises issues over timing of recruitment spend. In FY12, spend got ahead of where revenues ended up and adjustments were made, the benefit of which accrued in FY13.
■
Loss of significant client. The group generates a large proportion of its revenues from a relatively small cohort of clients. However, these clients are very substantial businesses with highly significant research budgets and BrainJuicer currently represents a very small proportion of their spending. The largest client represented 7% of group revenues in FY15 (FY14: 7%), with the top 20 accounting for around 66% (FY14: 50%).
■
Loss of key personnel. Again, growth of the business and the team dilutes the dependence on key individuals. Nevertheless, John Kearon’s high industry profile and 30% shareholding make his position more influential than usual.
■
As the group’s ex-UK revenue has grown, currency movements have become more of a factor. Hedges are not yet deemed cost effective.
■
Securing new talent. BrainJuicer needs to keep investing in its Juicy products to sustain interest from potential clients and to ensure the best value for existing clients. As the group’s record of success has built, it has become a safer option for established (as well as new) talent to join. However, for account managers – the key resource requirement – home-grown talent is preferable, rather than recruiting people with higher salary expectations who may need to ‘unlearn’ their previous cultures.
■
Acquisition risk. With the possibility of deals now on the radar, there will be an element of acquisition risk that has not been in the equation to date. Disregarding a previous, very small experiment in Australia that did not work out, management is acutely conscious that the first deal will be subject to a great deal of scrutiny and will be particularly important that all aspects of any deal stack up: content/capability, clients, location and (particularly) culture.
There are two more broad industry issues that could affect the trading environment:
■
Big MR could start genuinely to innovate. Attitudes toward innovation among the larger players have shifted and they now ‘talk the talk’ on data analytics, mobile etc, yet underlying attitudes remain slow to adapt. This could lead to a diminution of the differentiation of BrainJuicer’s model compared to the industry, or even just the perception of that differentiation.
■
Privacy and trust. The traditional MR model was very much an ‘opt-in’ version, with respondents choosing to divulge or withhold information about themselves, their preferences and their habits. With the rise in the use of big data analytics and passive monitoring, the amount of information held on individuals (albeit aggregated and anonymised) has increased at explosive rates. There continues to be a public conversation about issues of data ownership, data value and privacy, with younger people seemingly more protective of their data. Safe harbour arrangements are in place.
Valuation
Peer group comparison
BrainJuicer traditionally traded at a premium to the global MR sector (the quoted domestic sector is too small to make a sensible comparison). As its story has developed it has become less focused on the short term, high top-line growth and high cash flow, and more on the medium-term potential to become a robust and scalable presence in the sector. Its share price multiple has similarly trended back below the average for the quoted sector.
|
Exhibit 5: CY16 P/E vs two-year EPS growth |
Exhibit 6: CY16 EV/EBITDA vs EBITDA margin |
|
|
|
Source: Edison Investment Research, Thomson Reuters |
|
Exhibit 5: CY16 P/E vs two-year EPS growth |
|
|
Source: Edison Investment Research, Thomson Reuters |
|
Exhibit 6: CY16 EV/EBITDA vs EBITDA margin |
|
|
Source: Edison Investment Research, Thomson Reuters |
Exhibit 7: Summary peer group analysis
|
Price |
Currency |
Market cap |
EV/sales |
EV/EBITDA |
EV/EBITDA |
EV/EBITDA |
Yield |
EPS |
ComScore |
30.54 |
$ |
1,732 |
4.1 |
16.4 |
13.5 |
10.7 |
0.0% |
0.0% |
IMS Health |
26.19 |
$ |
8,606 |
4.2 |
14.0 |
13.3 |
12.2 |
0.0% |
6.9% |
Nielsen |
51.8 |
$ |
18,858 |
4.2 |
13.9 |
13.2 |
12.3 |
2.1% |
6.7% |
YouGov |
137 |
£ |
143 |
1.7 |
13.5 |
11.9 |
11.2 |
0.7% |
14.0% |
Forrester |
32.87 |
$ |
583 |
1.5 |
14.4 |
11.7 |
11.9 |
0.0% |
12.5% |
Natl Research Corp |
14.8 |
$ |
353 |
3.0 |
10.3 |
8.9 |
7.9 |
1.6% |
3.3% |
Cello |
97 |
£ |
84 |
0.5 |
7.6 |
7.3 |
7.0 |
2.9% |
6.3% |
Ipsos |
20.32 |
€ |
920 |
0.8 |
6.8 |
6.5 |
6.3 |
3.7% |
-1.0% |
BrainJuicer |
303 |
£ |
39 |
1.3 |
6.4 |
6.0 |
5.5 |
1.6% |
9.0% |
GfK |
31.8 |
€ |
1,161 |
1.0 |
6.8 |
6.0 |
5.6 |
2.1% |
13.5% |
Average |
|
|
|
2.2 |
11.0 |
9.8 |
9.1 |
1.5% |
7.1% |
Source: Edison Investment Research, Thomson Reuters Eikon. Note: Prices as at 22 March 2016.
Despite its higher-than-sector earnings growth rate (2014 to 2016), based on conservative assumptions about the success of the newer initiatives and business emphasis, BrainJuicer now trades at a discount to its international peers. This is inevitably partly a reflection of size and liquidity, but a 39% discount on our preferred measure of EV/EBITDA, putting it on a similar rating with Ipsos and GfK with their substantive structural legacy issues, is overdone.
Financials
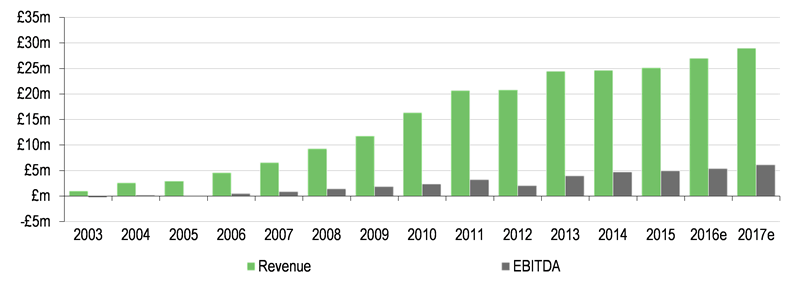
The long-term growth pattern below shows consistent top-line progress, albeit minimal in 2012 and below what had been hoped for FY14, with FY12 showing the only interruption to the pattern of progress in EBITDA.
Despite this, there is a sense that BrainJuicer had lost momentum in building market share. The resonance of the concepts that the group introduced to the industry continues to be high, as noted in the industry section above. Converting this level of interest into profitable and ongoing revenue streams, on scalable deliverables, has been more elusive. The new focus, drawing out ad-testing, brand tracking and predictive markets as the core emphasis and scaling down the other activities (without incurring significant restructuring costs), as well as the launch of the new initiatives of the creative agency and the ZappiStore distribution, should help restore the confidence at the heart of the business, driving gross profit and margin. Our forecasts (largely unchanged since last publication) remain circumspect and conservative at this point until evidence that this approach is paying off starts to show through.
|
Exhibit 8: Long-term record and forecasts |
|
|
Source: BrainJuicer accounts, Edison Investment Research |
Historically, we have looked at the revenue line as a function of the average number of projects and average project size. As the business is changing shape, and with the growing emphasis on recurring and repeat revenue streams, this approach is becoming less useful. Our model is driven off growth in geographic markets, the basis on which a breakdown of operating profit is given in the accounts. As shown in Exhibit 3, above, the newly-disclosed analysis of gross profit by type gives a clearer view of the underlying dynamic. Splitting out gross profit by what are now clearly identified as the core elements of the group offer, the improving quality of earnings is also more apparent (see Exhibit 9), with a greater proportion of group income in scalable and repeatable or recurring area and a tailing off of the one-off project work, particularly in Twist, where the differentiation was not such as to be able to avoid the commodification and pricing pressures prevalent in the industry.
|
Exhibit 9: Juicy quant products gross profit |
Exhibit 10: Twist and Juice Gen gross profit |
|
|
|
Source: BrainJuicer |
|
Exhibit 9: Juicy quant products gross profit |
|
|
Source: BrainJuicer |
|
Exhibit 10: Twist and Juice Gen gross profit |
|
|
Source: BrainJuicer |
Inherently strong cash flow
BrainJuicer does not have any structural heavy requirement for cash, and expansionary costs of opening new offices and geographies was negligible in the year just reported, although there were modest costs associated with moving the head office in London on expiry of the previous lease.
Overheads primarily consist of staff costs and these rose by 9.2% in the year after stripping out bonus and on-off costs relating to the head office move and the costs incurred on an aborted acquisition totalling £0.32m, which was taken in H1. Although this growth in staff costs outstripped top-line progress, some of this relates to the changes in business emphasis described above, from which the benefits will accrue in FY16, not FY15. The current year will bear the initial investment of £0.3m in the new creative agency, described above.
Capital expenditure was £0.32m in FY15 (FY14: £0.27m), with depreciation/amortisation at £0.46m. The tax charge was up 1% at 33%, reflecting the relatively high contribution from the US. The only substantive variable (beyond ‘normal’ swings in working capital, inevitable when business bunches so much towards the final few weeks of the financial year) is that of staff bonuses. Generally these are at a maximum of 20% of salary for a full award reflecting good prior year performance. In FY15, this figure was negligible (FY14: £1.0m, FY13: £1.9m, FY12: £0.1m). Management’s assessment is that the business could double or even treble revenues without the need for a step change in structure.
With limited requirement internally for the cash generated, BrainJuicer’s priorities would tend to go in the order 1) salaries, 2) dividends, 3) bonus pool, and 4) return of cash to shareholders. The fourth of these has been carried out over the years through a mix of share buyback and through special dividend. The last special dividend was paid out in FY14. Share repurchases are carried out with regard to the share price at the time and in the context of practical issues, such as the prevailing liquidity in the stock.
Cash-rich balance sheet
With no debt and no acquisition history, the balance sheet is extremely straightforward. Intangibles represent internally developed software and there is negligible stock – simply trade debtors and creditors. Cash (net cash) at the year end was £6.4m and, should there be no deals and factoring in no return to shareholders, would build to £9.5m by the end of FY16 under our modelling scenario.
Exhibit 11: Financial summary
£000s |
2013 |
2014 |
2015 |
2016e |
2017e |
||
Year end 31 December |
|||||||
PROFIT & LOSS |
|||||||
Revenue |
|
|
24,457 |
24,645 |
25,184 |
27,000 |
29,000 |
Cost of Sales |
(5,370) |
(5,235) |
(4,934) |
(5,400) |
(5,800) |
||
Gross Profit |
19,087 |
19,410 |
20,250 |
21,600 |
23,200 |
||
EBITDA |
|
|
4,015 |
4,726 |
5,001 |
5,385 |
6,144 |
Operating Profit (before GW and except) |
|
|
3,550 |
4,301 |
4,546 |
4,960 |
5,744 |
Goodwill Amortisation |
0 |
0 |
0 |
0 |
0 |
||
Exceptionals |
0 |
0 |
0 |
0 |
0 |
||
Other |
0 |
0 |
0 |
0 |
0 |
||
Operating Profit |
3,550 |
4,301 |
4,546 |
4,960 |
5,744 |
||
Net Interest |
6 |
(15) |
(45) |
40 |
56 |
||
Profit Before Tax (norm) |
|
|
3,556 |
4,286 |
4,501 |
5,000 |
5,800 |
Profit Before Tax (FRS 3) |
|
|
3,556 |
4,286 |
4,501 |
5,000 |
5,800 |
Tax |
(1,121) |
(1,389) |
(1,469) |
(1,625) |
(1,854) |
||
Profit After Tax (norm) |
2,435 |
2,897 |
3,032 |
3,375 |
3,946 |
||
Profit After Tax (FRS3) |
2,435 |
2,897 |
3,032 |
3,375 |
3,946 |
||
Average Number of Shares Outstanding (m) |
12.6 |
12.6 |
12.7 |
12.7 |
12.7 |
||
EPS - normalised fully diluted (p) |
|
|
18.7 |
21.3 |
22.7 |
25.3 |
29.6 |
EPS - FRS 3 (p) |
|
|
19.4 |
23.0 |
23.9 |
26.6 |
31.1 |
Dividend per share (p) |
3.9 |
4.3 |
4.5 |
5.0 |
5.8 |
||
Gross Margin (%) |
78.0% |
78.8% |
80.4% |
80.0% |
80.0% |
||
EBITDA Margin (%) |
16.4% |
19.2% |
19.9% |
19.9% |
21.2% |
||
Operating Margin (before GW and except) (%) |
14.5% |
17.5% |
18.1% |
18.4% |
19.8% |
||
BALANCE SHEET |
|||||||
Fixed Assets |
|
|
1,782 |
1,774 |
1,412 |
1,409 |
1,309 |
Intangible Assets |
1,000 |
797 |
519 |
641 |
641 |
||
Tangible Assets |
782 |
977 |
893 |
768 |
668 |
||
Unquoted investments |
0 |
0 |
0 |
0 |
0 |
||
Current Assets |
|
|
13,770 |
12,266 |
13,050 |
16,314 |
20,102 |
Stocks |
238 |
195 |
90 |
96 |
104 |
||
Debtors |
7,344 |
6,724 |
6,595 |
6,717 |
6,998 |
||
Cash |
6,188 |
5,347 |
6,365 |
9,500 |
13,000 |
||
Other |
0 |
0 |
0 |
0 |
0 |
||
Current Liabilities |
|
|
(7,053) |
(5,967) |
(4,753) |
(5,211) |
(5,725) |
Creditors |
(6,336) |
(5,543) |
(4,161) |
(4,595) |
(5,083) |
||
Other creditors |
(717) |
(424) |
(592) |
(616) |
(642) |
||
Short term borrowings |
0 |
0 |
0 |
0 |
0 |
||
Minority interests |
0 |
0 |
0 |
0 |
0 |
||
Long Term Liabilities |
|
|
(390) |
(368) |
(469) |
(469) |
(469) |
Long term borrowings |
0 |
0 |
0 |
0 |
0 |
||
Other long term liabilities |
(390) |
(368) |
(469) |
(469) |
(469) |
||
Net Assets |
|
|
8,109 |
7,705 |
9,240 |
12,043 |
15,217 |
CASH FLOW |
|||||||
Operating Cash Flow |
|
|
5,343 |
4,672 |
4,137 |
5,700 |
6,300 |
Net Interest |
(8) |
(15) |
(45) |
40 |
56 |
||
Tax |
(835) |
(1,242) |
(1,119) |
(1,508) |
(1,682) |
||
Capex |
(139) |
(273) |
(322) |
(300) |
(300) |
||
Acquisitions/disposals |
97 |
0 |
0 |
0 |
0 |
||
Financing |
(71) |
(1,938) |
(928) |
(170) |
(170) |
||
Dividends/share buybacks |
(1,903) |
(2,016) |
(544) |
(592) |
(666) |
||
Other |
0 |
0 |
0 |
(11) |
0 |
||
Net Cash Flow |
2,484 |
(812) |
1,179 |
3,159 |
3,538 |
||
Opening net debt/(cash) |
|
|
(3,755) |
(6,188) |
(5,347) |
(6,365) |
(9,500) |
HP finance leases initiated |
0 |
0 |
0 |
0 |
0 |
||
Other |
(51) |
(29) |
(161) |
(24) |
(38) |
||
Closing net debt/(cash) |
|
|
(6,188) |
(5,347) |
(6,365) |
(9,500) |
(13,000) |
Source: BrainJuicer accounts, Edison Investment Research
|
|||||||||||||||||||||||||||||||||||||||||||||||||||
|