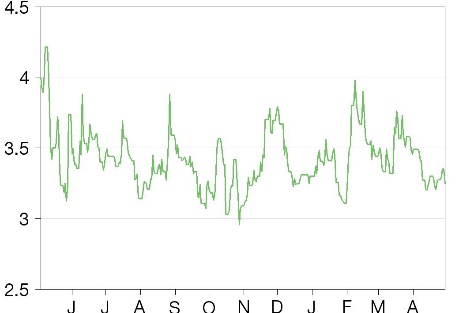
Last close As at 05/08/2026
—
— 0.00 (0.00%)
Market capitalisation
—
Research: Healthcare
In many respects, 2020 was a year of rebuilding for Pharnext following the disruption in its previous Phase III clinical study of PXT3003 for the treatment of Charcot-Marie-Tooth disease, type 1A (CMT1A). While showing positive results, the study’s high dose arm was prematurely discontinued due to a manufacturing issue. In 2020, Pharnext completed gathering data from the study and met with the FDA and other authorities in preparation for the re-initiation of its pivotal Phase III clinical program, which started in March 2021.
Written by
Pharnext |
Back in the saddle again |
Earnings update |
Pharma & biotech |
4 May 2021 |
Share price performance
Business description
Next events
Analyst
Pharnext is a research client of Edison Investment Research Limited |
|||||||||||||||||||||||||||||||||||||||||||||
In many respects, 2020 was a year of rebuilding for Pharnext following the disruption in its previous Phase III clinical study of PXT3003 for the treatment of Charcot-Marie-Tooth disease, type 1A (CMT1A). While showing positive results, the study’s high dose arm was prematurely discontinued due to a manufacturing issue. In 2020, Pharnext completed gathering data from the study and met with the FDA and other authorities in preparation for the re-initiation of its pivotal Phase III clinical program, which started in March 2021.
Year end |
Revenue (€m) |
PBT* |
EPS* |
DPS |
P/E |
Yield |
12/19 |
3.6 |
(23.4) |
(1.61) |
0.00 |
N/A |
N/A |
12/20 |
2.8 |
(21.4) |
(1.17) |
0.00 |
N/A |
N/A |
12/21e |
2.6 |
(25.0) |
(1.19) |
0.00 |
N/A |
N/A |
12/22e |
3.1 |
(26.0) |
(1.13) |
0.00 |
N/A |
N/A |
Note: *PBT and EPS are normalised, excluding amortisation of acquired intangibles, exceptional items and share-based payments.
Recovering from an unfortunate turn
2020 began with Pharnext reporting final results from the extension portion of its previous pivotal Phase III study (PLEO-CMT) for CMT1A. Earlier, the trial had to halt enrolment due to a manufacturing issue and could not be used as a pivotal study. Despite this, even under the most stringent statistical interpretation of the data, it reached statistical significance (p=0.04 in favour of the high dose arm). The open-label extension portion study further supported the utility of the treatment and a statistically significant improvement in the Overall Neuropathy Limitations Scale (ONLS) was seen compared to the prior placebo arm (p=0.001).
Focused on PREMEIRE Phase III
The final results of PLEO-CMT strongly supported running a new Phase III clinical study, and despite the potential disruption of the COVID-19 pandemic, the company was able to initiate the PREMIER Phase III study on schedule in March 2021. This trial design is based on feedback from the FDA. The primary endpoint of the study will be improvement in ONLS and it will enrol 350 patients.
Update from long-term extension study
The company previously reported interim results from its long-term extension study, PLEO-CMT-FU, in January 2020 and provided an update on 29 April 2021. The data showed that the improvement in ONLS scores seen in the earlier data were maintained and continued (p-value not presented). The patients presented in the new data have been on PXT3003 for up to 54 months and no safety issues were raised.
Valuation: Increased to €287.7m or €13.12
Our valuation is up slightly at €287.7m or €13.12 per share, from €283.2m or €13.08 per share. We have updated our estimated net cash (€4.57m) based on the company’s reporting. Otherwise, our valuation remains unchanged.
Executing on re-entering the clinic
Pharnext reported its financial results for FY20 at the end of April 2021 and reflected on its progress over the year. The main operational goal for 2020 was to prepare for the re-initiation of clinical studies into its lead asset, PXT3003, for the treatment of CMT1A. During 2020, Pharnext applied for a special protocol assessment (SPA) from the FDA. An SPA is a special agreement with the agency that sets out the specific parameters by which a drug or treatment will be evaluated following clinical trials. The company received feedback it describes as constructive from the FDA as part of this application process but decided not to pursue an official SPA before initiating clinical studies. The only remaining topic was the statistical treatment of COVID-19-related dropouts under a particular analysis (the modified intent to treat (mITT) population). This is a minor factor in the overall trial design, and it is understandable that the company did not want to delay further on account of this point. The FDA provided extensive feedback as part of the application process and a consensus was reached on all other details. The parameters for the study will be similar to the previous PLEO-CMT Phase III clinical trial: the endpoint will be ONLS, and secondary endpoints will be the 10-metre walk test, quantified muscular testing of the hand and foot, Patient Global Impression of Severity (PGI-S), Patient Global Impression of Change (PGI-C) and the Charcot-Marie-Tooth Neuropathy Score, version 2 (CMTNS-v2). The main difference from the prior clinical study is that only the ‘high dose’ will be examined (1.4mg naltrexone, 12mg baclofen, 420mg sorbitol) vs placebo. The study has an estimated completion date of October 2023.
Update on PLEO-CMT-FU long-term study
Pharnext’s previous Phase III clinical study PLEO-CMT was disrupted in 2018 following a manufacturing issue that required the study to halt enrolment. The halt was not due to any safety or efficacy issues on the part of the treatment. On the contrary, patients on the high dose arm of the study who completed treatment saw a statistically robust response (improvement of 0.37 in ONLS, p=0.008). The study even showed statistical significance on an intent-to-treat (ITT) basis (p=0.04), a much harsher statistical treatment that counts all discontinuations as treatment failures. These results were further supported by data gathered from an extension study, which Pharnext reported in early 2020 (the PLEO-CMT-FU study). Patients examined for this interim analysis had been treated (with either PXT3003 or placebo) for a total of 24 months. The study showed improvements in ONLS across all three original trial cohorts. When these patients were pooled in a post-hoc analysis, the trend showed a statistically significant improvement compared to the prior placebo arm of the study (0.30 points, p=0.001).
On 29 April 2021, the company provided an update on PLEO-CMT-FU. ONLS data were gathered from patients after 54 months on treatment. A total of 187 patients were evaluable at this time point. Additionally, in this second part of the extension study, all patients were treated with the high dose, as defined in the previous PLEO-CMT study (but were still stratified by their original treatment arm). On a numerical basis, all patient groups saw continued improvement compared to the 24-month data (Exhibit 1). However, Pharnext did not present a statistical analysis of these data (p values etc), so it is hard to draw definitive conclusions, although the direction of the data is definitively positive.
There should always be a caveat when evaluating unblinded data like those presented here. However, we find the consistency of the data compelling. All patient groups saw improvements and these improvements continued to increase over time. It is rare to see improvements in ONLS in CMT studies, and the effect sizes seen here are far larger than those in many other studies.1
Mandel J, et al. (2015) A meta-analysis of randomized double-blind clinical trials in CMT1A to assess the change from baseline in CMTNS and ONLS scales after one year of treatment. Orphanet J Rare Dis 10, 74.
Moreover, no safety issues were raised.
|
Exhibit 1: 54-month data from PLEO-CMT-FU |
|
|
Source: Pharnext |
Financial results
The company reported an operating loss of €18.9m for 2020, down slightly from 2019 (€20.0m). The mix of expenses was different, with lower R&D (€13.5m from €15.2m) and marketing expenses (€2.1m from €3.5m), but higher administrative expenses (€6.1m from €5.0m). We assume these higher administrative expenses are associated with hiring Pharnext’s new CEO in mid-2020. We forecast R&D expenses increasing in 2021 (€16.6m) and beyond due to the expense of the PREMIER clinical study. These are unadjusted from our previous estimates. Revenue for the period was €2.8m, almost entirely from R&D tax credits, as in other years.
The company ended the period with €11.1m in cash and €12.1m in debt. This has since been supplemented by an offering completed in February 2021, which included €6m in equity (1.75m units at €3.42 per unit, with each unit comprising one share and one half-share purchase warrant exercisable at €4.45/share) and €5m in convertible debt (convertible at the lower of €4.25/share or 93% of 15-day VWAP). We include €80m in expected additional financing for the company to complete the PREMEIR study and launch PXT3003 for CMT1A in 2024. This is included on our balance sheet as illustrative debt (€50m in 2022, €30m in 2023).
Valuation
We have made no adjustments to our valuation apart from updating net cash based on the company’s report (€1.01m net debt at the end of the period + €5.58m estimated net cash from the February offering). This has lifted our valuation slightly to €287.7m or €13.12 per share, from €283.2m or €13.08 per share.
Exhibit 2: Valuation of Pharnext
Development program |
Indication |
Clinical stage |
Probability of success |
Launch year |
Patent/exclusivity protection |
Launch pricing ($/year) |
Peak sales (US$m) |
rNPV |
|||||||
PXT3003 |
CMT1A |
Phase III |
70% |
2024 |
2031–34 |
55,000 |
626 |
283.2 |
|||||||
Total |
283.2 |
||||||||||||||
Net cash (YE20 + offering) (€m) |
4.57 |
||||||||||||||
Total firm value (€m) |
287.7 |
||||||||||||||
Total basic shares (m) |
21.9 |
||||||||||||||
Value per basic share (€) |
13.12 |
||||||||||||||
Dilutive options, warrants, and convertible debt (m) |
7.42 |
||||||||||||||
Total diluted shares (m) |
29.34 |
||||||||||||||
Value per diluted share (€) |
11.09 |
||||||||||||||
Source: Pharnext reports, Edison Investment Research
Exhibit 3: Financial summary
€'000s |
2019 |
2020 |
2021e |
2022e |
||
Year end 31 December |
IFRS |
IFRS |
IFRS |
IFRS |
||
INCOME STATEMENT |
||||||
Revenue |
|
|
3,597.4 |
2,810.5 |
2,565.2 |
3,140.6 |
Cost of Sales |
0.0 |
0.0 |
0.0 |
0.0 |
||
Gross Profit |
3,597.4 |
2,810.5 |
2,565.2 |
3,140.6 |
||
R&D |
(15,178.1) |
(13,548.4) |
(16,587.3) |
(17,930.4) |
||
Admin & Marketing |
(8,444.6) |
(8,175.6) |
(8,614.4) |
(8,700.5) |
||
EBITDA |
|
|
(19,501.6) |
(18,159.2) |
(22,521.3) |
(23,451.8) |
Normalised operating profit |
|
|
(20,093.0) |
(18,716.5) |
(22,439.4) |
(23,293.3) |
Amortisation of acquired intangibles |
0.0 |
0.0 |
0.0 |
0.0 |
||
Exceptionals |
0.0 |
0.0 |
0.0 |
0.0 |
||
Share-based payments |
67.7 |
(197.0) |
(197.0) |
(197.0) |
||
Reported operating profit |
(20,025.3) |
(18,913.5) |
(22,636.4) |
(23,490.3) |
||
Net Interest |
(3,283.9) |
(2,650.5) |
(2,551.5) |
(2,658.1) |
||
Joint ventures & associates (post tax) |
0.0 |
0.0 |
0.0 |
0.0 |
||
Exceptionals |
0.0 |
0.0 |
0.0 |
0.0 |
||
Profit Before Tax (norm) |
|
|
(23,376.9) |
(21,367.0) |
(24,991.0) |
(25,951.4) |
Profit Before Tax (reported) |
|
|
(23,309.2) |
(21,564.1) |
(25,188.0) |
(26,148.4) |
Reported tax |
0.0 |
0.0 |
0.0 |
0.0 |
||
Profit After Tax (norm) |
(23,376.9) |
(21,367.0) |
(24,991.0) |
(25,951.4) |
||
Profit After Tax (reported) |
(23,309.2) |
(21,564.1) |
(25,188.0) |
(26,148.4) |
||
Minority interests |
0.0 |
0.0 |
0.0 |
0.0 |
||
Discontinued operations |
0.0 |
0.0 |
0.0 |
0.0 |
||
Net income (normalised) |
(23,376.9) |
(21,367.0) |
(24,991.0) |
(25,951.4) |
||
Net income (reported) |
(23,309.2) |
(21,564.1) |
(25,188.0) |
(26,148.4) |
||
Basic average number of shares outstanding (m) |
14.5 |
18.2 |
21.0 |
23.0 |
||
EPS - basic normalised (€) |
|
|
(1.61) |
(1.17) |
(1.19) |
(1.13) |
EPS - diluted normalised (€) |
|
|
(1.61) |
(1.17) |
(1.19) |
(1.13) |
EPS - basic reported (€) |
|
|
(1.61) |
(1.18) |
(1.20) |
(1.14) |
Dividend (€) |
0.00 |
0.00 |
0.00 |
0.00 |
||
BALANCE SHEET |
||||||
Fixed Assets |
|
|
1,526.5 |
855.4 |
740.3 |
701.8 |
Intangible Assets |
12.1 |
7.4 |
0.0 |
0.0 |
||
Tangible Assets |
293.2 |
146.3 |
38.5 |
0.0 |
||
Investments & other |
1,221.2 |
701.8 |
701.8 |
701.8 |
||
Current Assets |
|
|
21,645.1 |
20,398.4 |
937.0 |
25,395.5 |
Stocks |
0.0 |
0.0 |
0.0 |
0.0 |
||
Debtors |
0.0 |
9,320.2 |
421.7 |
516.3 |
||
Cash & cash equivalents |
16,246.6 |
11,078.2 |
515.4 |
24,879.2 |
||
Other |
5,398.5 |
0.0 |
0.0 |
0.0 |
||
Current Liabilities |
|
|
(9,959.6) |
(15,516.6) |
(9,088.3) |
(21,483.4) |
Creditors |
(5,792.7) |
(11,302.7) |
(6,137.1) |
(6,508.5) |
||
Tax and social security |
0.0 |
0.0 |
0.0 |
0.0 |
||
Short term borrowings |
(3,806.3) |
(3,926.0) |
(2,663.3) |
(14,687.0) |
||
Other |
(360.5) |
(287.9) |
(287.9) |
(287.9) |
||
Long Term Liabilities |
|
|
(20,457.9) |
(18,256.2) |
(24,518.9) |
(62,495.1) |
Long term borrowings |
(11,181.4) |
(8,157.4) |
(14,420.1) |
(52,396.4) |
||
Other long-term liabilities |
(9,276.6) |
(10,098.8) |
(10,098.8) |
(10,098.8) |
||
Net Assets |
|
|
(7,245.9) |
(12,519.0) |
(31,929.9) |
(57,881.3) |
Minority interests |
0.0 |
0.0 |
0.0 |
0.0 |
||
Shareholders' equity |
|
|
(7,245.9) |
(12,519.0) |
(31,929.9) |
(57,881.3) |
CASH FLOW |
0 |
|||||
Op Cash Flow before WC and tax |
(19,569.3) |
(17,962.2) |
(22,324.3) |
(23,254.8) |
||
Working capital |
(1,523.1) |
1,797.7 |
3,733.0 |
276.7 |
||
Exceptional & other |
(476.0) |
82.5 |
0.0 |
0.0 |
||
Tax |
0.0 |
0.0 |
0.0 |
0.0 |
||
Net operating cash flow |
|
|
(21,568.4) |
(16,081.9) |
(18,591.3) |
(22,978.1) |
Capex |
0.0 |
22.0 |
0.0 |
0.0 |
||
Acquisitions/disposals |
193.5 |
(83.4) |
0.0 |
0.0 |
||
Net interest |
(1,412.9) |
(1,622.2) |
(2,551.5) |
(2,658.1) |
||
Equity financing |
16,494.9 |
16,271.7 |
5,580.0 |
0.0 |
||
Dividends |
0.0 |
0.0 |
0.0 |
0.0 |
||
Other |
0.0 |
(199.5) |
0.0 |
0.0 |
||
Net Cash Flow |
(6,292.9) |
(1,693.4) |
(15,562.8) |
(25,636.2) |
||
Opening net debt/(cash) |
|
|
16,011.4 |
(1,258.8) |
1,005.6 |
16,568.4 |
FX |
0.0 |
0.0 |
0.0 |
0.0 |
||
Other non-cash movements |
23,563.0 |
(571.0) |
0.0 |
0.0 |
||
Closing net debt/(cash) |
|
|
(1,258.8) |
1,005.6 |
16,568.4 |
42,204.6 |
Source: Pharnext reports, Edison Investment Research
|
|
Research: Healthcare
Kinase inhibitor specialist Sareum develops small molecule therapeutics with application in oncology and autoimmune disease areas. Lead asset SDC-1801 targets the autoimmune space and is nearing an inflection point, with a planned clinical trial application (CTA) filing in mid-2021 and clinical progression in Q421. The other candidate, SDC-1802, is focused on cancer and holds first-in-class promise with value to be unlocked with clinical validation. The out-licensed assets, SRA737 and FLT3+Aurora kinase, are currently de-prioritised but offer upside potential on revived activity.