Last close As at 05/08/2026
GBP19.60
▲ 20.00 (1.03%)
Market capitalisation
GBP239m
Research: Financials
The H120 results confirmed encouraging trends at Advantage motor finance with a resumption of growth in new transactions and an increase in receivables following a contraction in H219. Early indicators continue to show that the tightening of credit criteria is beginning to take effect with the potential for further benefits in future periods. While muted liquidity in the property market is affecting the small Aspen property bridging business there is still a good opportunity for it to make a useful contribution to growth on a medium-term view.
Written by
S&U |
Advantage growth resumes |
H120 results |
Financial services |
30 September 2019 |
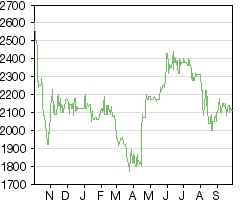
Share price performance
Business description
Next events
Analysts
S&U is a research client of Edison Investment Research Limited |
|||||||||||||||||||||||||||||||||||||||||||||||||
The H120 results confirmed encouraging trends at Advantage motor finance with a resumption of growth in new transactions and an increase in receivables following a contraction in H219. Early indicators continue to show that the tightening of credit criteria is beginning to take effect with the potential for further benefits in future periods. While muted liquidity in the property market is affecting the small Aspen property bridging business there is still a good opportunity for it to make a useful contribution to growth on a medium-term view.
Year end |
Revenue (£m) |
PBT* |
EPS* |
DPS |
P/E |
Yield |
01/18 |
79.8 |
30.2 |
202.4 |
105.0 |
10.5 |
5.0 |
01/19 |
89.2 |
34.6 |
232.0 |
118.0 |
9.1 |
5.6 |
01/20e |
98.0 |
36.9 |
248.7 |
124.0 |
8.5 |
5.8 |
01/21e |
108.2 |
40.5 |
271.7 |
128.0 |
7.8 |
6.0 |
Note: *PBT and EPS are normalised, excluding amortisation of acquired intangibles, exceptional items and share-based payments.
H120 results
S&U’s H120 results showed revenues 7% ahead to £47.7m with pre-tax profit and fully diluted EPS up 3% and 4%, respectively. The dividend was increased by 6% to 34p. At Advantage receivables growth resumed (+5.8% compared with year end) and the risk adjusted yield was slightly up at 24.9% versus 24.6% following earlier tightening of credit criteria. Increased costs tempered profit growth, including higher commission payments to improve transaction volume/quality. Aspen property bridging continued to make progress with the loan book standing at £24.7m at end July versus £18m at the beginning of the year and its pre-tax profit increased from £0.3m to £0.5m. The weak market has also affected borrower exits and resulted in one crystallised loss (default interest only) and late repayments on nine loans.
Background and outlook
While car transaction volumes in the UK market have shown some weakness year to date, the used car segment was down less than 2% in the first half and car finance through dealerships for used cars has continued to grow, albeit more slowly than previously (see page 5). At Advantage the recent resumption of growth in transactions is encouraging for the near-term outlook, while the company’s track record through a number of cycles and potential to grow market share from a small base is positive on a longer view. For Aspen there is also good scope to grow from a small base and management’s conservative approach to the business should limit risks.
Valuation
Our estimates are little changed following the first half results (EPS marginally higher: see page 5) and we still look for the company to generate returns on equity of over 17% this year and next. An ROE/COE calculation suggests the current market price is factoring in a return of just over 13%, which appears cautious. Also worth noting is the dividend yield of 5.6% (peer average 3.7%).
H120 results
A summary of figures from the H120 results is shown in Exhibit 1 and key points from the results are noted below with percentage changes versus H119 unless stated.
■
Motor finance receivables increased by nearly 6% compared with end FY19 following a contraction in H219 when the number of new loans was restricted by a tighter credit policy and competitive behaviour. The average level of receivables increased 3% against H119.
■
Advantage revenues increased by 5% while pre-tax profit was £16.6m (vs £16.3m).
■
The property bridging loan book increased by 51% and revenue by 74% as the business begins to build scale following its pilot phase. Aspen pre-tax profit was £0.5m compared with £0.3m.
■
The total profit and loss impairment charge was slightly lower, with Advantage lower (equivalent to 8.3% versus 8.8% of average receivables) while the figure for Aspen increased from a low base reflecting increased scale and a difficult market that has affected borrower exits and resulted in one crystallised loss (default interest only) and late repayments on nine loans.
■
Not shown below but the ratio of transactions to applications at Advantage fell from 2.3% to 1.8%, evidencing the tighter credit standards that are being applied.
■
The 19% increase in cost of sales can be attributed to a small increase in the number of new loans, an increase in commissions paid by Advantage in order to encourage a higher volume and a better mix of deals from internet brokers (see Exhibit 3). Administrative expenses increased by 17% as investment was made in collection capability at Advantage.
■
Pre-tax profit increased by 3% and fully diluted earnings per share by 4%.
■
The interim dividend is increased by 6% to 34p. Board policy with regard to dividends is to take into account a conservative treasury policy and to aim for cover of two times on a longer-term view.
Exhibit 1: Summary of H120 figures
£000 unless stated |
H119 |
H219 |
H120 |
H120 vs H119 % |
Sequential change % |
Motor finance receivables at period end |
263,455 |
258,810 |
273,771 |
3.9 |
5.8 |
Number of new motor loans |
11,822 |
9,231 |
12,065 |
2.1 |
30.7 |
Bridging loans at period end |
16,327 |
18,253 |
24,690 |
51.2 |
35.3 |
Revenue |
|||||
Motor finance |
43,270 |
43,102 |
45,586 |
5.4 |
5.8 |
Property bridging |
1,190 |
1,653 |
2,073 |
74.2 |
25.4 |
Total |
44,460 |
44,755 |
47,659 |
7.2 |
6.5 |
Impairments |
|||||
Motor finance |
(11,320) |
(11,660) |
(11,075) |
-2.2 |
-5.0 |
Property bridging |
(98) |
(108) |
(318) |
224.5 |
194.4 |
Total |
(11,418) |
(11,768) |
(11,393) |
-0.2 |
-3.2 |
Other cost of sales |
(8,587) |
(7,164) |
(10,249) |
19.4 |
43.1 |
Administration expenses |
(5,468) |
(5,295) |
(6,381) |
16.7 |
20.5 |
EBITDA |
18,987 |
20,528 |
19,636 |
3.4 |
-4.3 |
Depreciation |
(174) |
(240) |
(226) |
29.9 |
-5.8 |
Operating profit / loss |
18,813 |
20,288 |
19,410 |
3.2 |
-4.3 |
Finance expense |
(2,139) |
(2,402) |
(2,272) |
6.2 |
-5.4 |
Pre-tax profit |
16,674 |
17,886 |
17,138 |
2.8 |
-4.2 |
Tax |
(3,167) |
(3,404) |
(3,121) |
-1.5 |
-8.3 |
Net profit |
13,507 |
14,482 |
14,017 |
3.8 |
-3.2 |
EPS fully diluted (p) |
111.8 |
120.2 |
116.1 |
3.8 |
-3.4 |
Dividend per share (p) |
32.0 |
86.0 |
34.0 |
6.3 |
Source: S&U, Edison Investment Research
The following exhibits show a number of measures for the motor finance business starting with the trends in Advantage’s customer credit score and flat interest rates. Historically, the credit score was at a high level following the financial crisis as mainstream lenders drew back from the market driving borrowers with higher credit ratings to alternative providers such as Advantage. More recently the score has run at a lower level as these borrowers settled and an experimental move towards higher risk categories pulled the average down. Credit criteria have been tightened and on various measures (including first payment performance) this is starting to gain traction. H120 saw a small increase in the average score while the flat interest rate was only down slightly on FY19. Turning to Exhibit 3, the cost of sales per loan has shown a consistent rise in recent periods reflecting the growing role of internet brokers in the market and competitive pressures. The latest increase, to £823 per loan, reflects a deliberate decision to increase commissions paid in order to improve the flow and mix of deals from brokers. As shown, the level of transactions in the first half (annualised in the chart) saw a marked recovery and ran at a similar level to FY18.
|
Exhibit 2: Customer credit score and flat interest rates |
Exhibit 3: Cost of sales and transactions |
|
|
|
Source: S&U. Note: Internal credit quality score and flat interest rate by year of origination. FY19 and 1H20 scores adjusted for negative impact of use of new HCSTC products. |
Source: S&U. Note: Cost of sales represents acquisition costs mainly arising from commission paid to brokers. H120 annualised. |
|
Exhibit 2: Customer credit score and flat interest rates |
|
|
Source: S&U. Note: Internal credit quality score and flat interest rate by year of origination. FY19 and 1H20 scores adjusted for negative impact of use of new HCSTC products. |
|
Exhibit 3: Cost of sales and transactions |
|
|
Source: S&U. Note: Cost of sales represents acquisition costs mainly arising from commission paid to brokers. H120 annualised. |
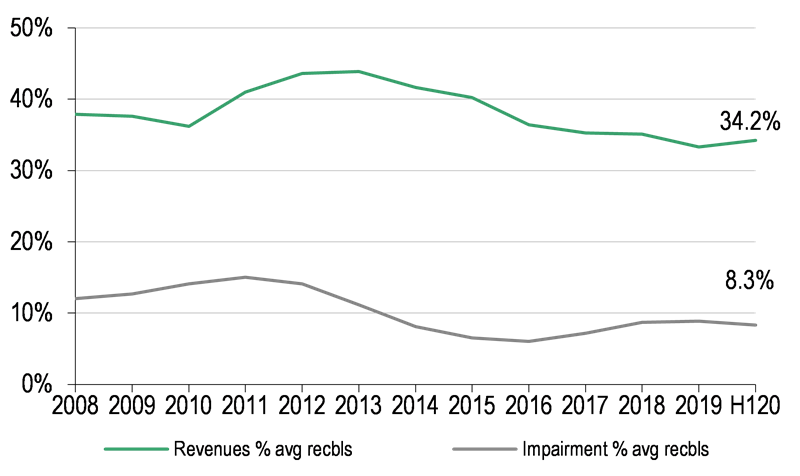
Next we look at revenue and impairment as a percentage of average receivables (Exhibit 4). The revenue yield rose in the post-crisis period and has then subsided with changes in risk exposure playing a role as well as the market environment. As noted earlier, impairments as a percentage of receivables were slightly lower year-on-year in H120. Combining the revenue yield and rate of impairment, the risk-adjusted yield (Exhibit 5) increased slightly in the first half (S&U reports a risk adjusted yield of 24.9% at end July compared with 24.6% based on average monthly receivables). The cost of sales increase shown in Exhibit 3 and investment in collection were drivers of a lower pre-tax profit margin at Advantage, also shown below. Despite this Advantage continued to record a return on capital employed of over 15% (as it has in each year from FY12).
|
Exhibit 4: Revenue and impairment, % of receivables |
Exhibit 5: Risk-adjusted yield and profit margin |
|
|
|
Source: S&U, Edison Investment Research |
|
Exhibit 4: Revenue and impairment, % of receivables |
|
|
Source: S&U, Edison Investment Research |
|
Exhibit 5: Risk-adjusted yield and profit margin |
|
|
Source: S&U, Edison Investment Research |
Other indicators reported for Advantage showed limited change with the original term of loans standing at 51 months compared with 50 for FY19 and the average advance up 3.5% at £6,353.
Advantage reached its 20th anniversary in the period and it was announced with the results that Guy Thompson, current chief executive and managing director at its inception, is to retire in 2020 having overseen a period in which the company achieved profit growth in every year. His successor will be Graham Wheeler, who joins in October and brings with him extensive experience in motor finance in the UK including senior roles at VW Financial Services and Jaguar Land Rover Financial Services. His remit is to develop the business further, retaining the culture and conservative approach that characterise the business.
Turning to Aspen Bridging, the business remains at an early stage but increased its net receivables to £24.7m by end July and having made 137 loans in the 30 months since inception. Of these loans 73 have been repaid. The average loan size has increased to c £0.400m (from £0.375m). Maximum loan to value is 71%, the average interest rate just over 1% per month and the original term between six and 14 months. As noted above, reduced liquidity in the UK property market (for example, residential property transactions in the period were down nearly 5% y-o-y) has affected the ability of some borrowers to meet their target exit dates and this has contributed to one crystallised loss and late repayments on nine loans. Higher interest rates may be applied where repayments are delayed so, providing an exit is simply delayed and repayment is made in full, this can enhance the returns earned.
Background and outlook
As highlighted in previous notes, S&U sees the main potential sensitivity for its Advantage business as being the financial well-being of its borrowers rather than used car prices, given the relatively low value of vehicles being financed and their typical use for transport to work. Consumer confidence is running at a lower level than pre-referendum levels but could be seen as resilient so far given the uncertain background. Similarly unemployment remains low and redundancies have been muted, although these indicators will tend to lag any significant economic downturn were this to occur.
|
Exhibit 6: GFK UK consumer confidence indicator |
Exhibit 7: UK redundancies and unemployment |
|
|
|
Source: Bloomberg (last value August 2019) |
Source: Bloomberg (last value July 2019) |
|
Exhibit 6: GFK UK consumer confidence indicator |
|
|
Source: Bloomberg (last value August 2019) |
|
Exhibit 7: UK redundancies and unemployment |
|
|
Source: Bloomberg (last value July 2019) |
Exhibits 8 and 9 show trends in the UK new and used car markets. Used car market transaction volumes have been less volatile and recent quarters have seen smaller reductions in used car activity. The value of car finance through dealerships shows a similar relationship and used car financing has continued to see growth in value over the period shown (to Q219). The latest monthly reading for the value of used car financing (in July) showed a YoY increase of 8%.
|
Exhibit 8: UK car market trends (volume) |
Exhibit 9: Car finance through dealerships (value) |
|
|
|
Source: SMMT |
Source: Finance and Leasing Association |
|
Exhibit 8: UK car market trends (volume) |
|
|
Source: SMMT |
|
Exhibit 9: Car finance through dealerships (value) |
|
|
Source: Finance and Leasing Association |
Prospectively the prevailing macro uncertainties seem likely to persist, but for Advantage the positive trend in transaction numbers and indications that the tightened credit criteria are taking effect are encouraging.
At Aspen the incidence of slower repayments and a lower than expected pace of new loans in the first half may mean it is prudent to assume that the near-term pace of expansion is below previous estimates, but the market opportunity is still seen as attractive with enquiries and deal pipeline running well ahead of the prior year. Product adaption, experience in the market and further establishment of the network of introducer relationships should all be helpful in moving the business to a scale where it would be seen as more material as a diversifying profit and growth contributor (potentially with a loan book of £60–70m and profit of c £5m).
Financials
Our profit and earnings estimates only change marginally, as shown below, with higher estimated revenues for Advantage offset by higher assumed cost of sales, mirroring the changes seen in the first half figures.
Exhibit 10: Changes to estimates
Year-end |
Revenue (£m) |
PBT (£m) |
EPS (p) |
DPS (p) |
||||||||
Old |
New |
Change (%) |
Old |
New |
Change (%) |
Old |
New |
Change (%) |
Old |
New |
Change (%) |
|
FY20e |
94.7 |
98.0 |
3.5% |
36.9 |
36.9 |
0.1% |
247.8 |
248.7 |
0.4% |
122.5 |
124.0 |
1.2% |
FY21e |
103.8 |
108.2 |
4.3% |
40.3 |
40.5 |
0.5% |
270.8 |
271.7 |
0.4% |
124.6 |
128.0 |
2.7% |
Source: Edison Investment Research
Our assumptions for Advantage include motor finance receivables growth of 11% and 8% for FY20 and FY21, respectively, and a reduced percentage level of impairments at c 8.5% of receivables. At Aspen bridging receivables are assumed to reach £30m in the current year followed by £40m (£45m previously). Further details from our estimates are shown in the financial summary (Exhibit 14).
S&U’s half-yearly cash flow analysis is shown in Exhibit 11. The main features to highlight here are the swing from a net inflow to a net outflow at Advantage between the H219 and H120 as new transactions increased, while at Aspen the outflow increased with higher advances and lower collections sequentially. Net debt at end H120 stood at £125.2m (excluding lease liabilities) and committed funding facilities remain at £160m, providing headroom for growth. On our estimates, net debt could rise to c £148m by end FY21 with net debt/equity at 75%.
Exhibit 11: Cash flow analysis
£m |
H119 |
H219 |
H120 |
Motor finance |
|||
Advances |
(72.8) |
(56.4) |
(76.6) |
Monthly collections |
67.7 |
70.4 |
72.1 |
Settlements/reloans |
14.4 |
13.5 |
15.6 |
Debt recovery |
7.3 |
8.2 |
8.6 |
Overheads/interest |
(15.8) |
(14.6) |
(17.2) |
Corporation tax |
(2.8) |
(2.7) |
(3.1) |
Dividend |
(7.5) |
(3.0) |
(9.0) |
Motor finance inflow/(outflow) |
(9.5) |
15.4 |
(9.6) |
Property bridging |
|||
Gross advances |
(10.1) |
(13.0) |
(16.6) |
Retention collections |
1.1 |
1.4 |
1.8 |
Collections |
4.5 |
9.5 |
5.7 |
Debt recovery |
0.1 |
1.7 |
4.4 |
Overheads/interest |
(0.5) |
(1.2) |
(1.3) |
Property bridging inflow/(outflow) |
(4.9) |
(1.6) |
(6.0) |
Other inflow/(outflow) |
(2.0) |
(0.4) |
(1.6) |
Group inflow/(outflow) |
(16.4) |
13.4 |
(17.2) |
Opening net debt |
105.0 |
121.4 |
108.0 |
Closing net debt |
121.4 |
108.0 |
125.2 |
Source: S&U. Note: Net debt excludes lease liabilities.
Valuation
We have updated our peer comparison table including companies with exposure to motor finance and non-standard lending. This shows S&U trading on similar earnings multiples to the average and on an above average yield. The price to book multiple is above the average, but the return on equity is also higher than average.
Exhibit 12: Peer comparison
Price |
Market cap |
P/E 2019 |
P/E 2020 |
Yield |
ROE |
P/BV |
|
S&U |
2,120 |
259 |
8.6 |
7.9 |
5.6 |
17.6 |
1.5 |
Close Brothers |
1,354 |
2,073 |
10.1 |
9.9 |
4.9 |
14.9 |
1.5 |
PCF Group |
27 |
68 |
8.9 |
7.0 |
1.1 |
10.8 |
1.3 |
Provident Financial |
402 |
1,030 |
8.5 |
7.1 |
2.5 |
16.1 |
1.5 |
Secure Trust Bank |
1,300 |
243 |
7.4 |
6.2 |
6.4 |
12.7 |
1.0 |
Peer average |
8.7 |
7.5 |
3.7 |
13.6 |
1.3 |
Source: Refinitiv, Edison Investment Research. Note: P/Es adjusted to calendar years. Priced 26 September 2019.
Using an ROE/COE model (with cost of equity assumed at 10% and growth of 4%) the current share price implies a market assumption of a return on equity of just above 13%, which appears cautious when compared with our expectation of over 17% for this year and next and 17.6% recorded in FY19.
Exhibit 13 shows the recent share price performance of the same companies. The weakness of the whole group on a one-year view and from 12-month highs can be attributed to concerns over possible risks in the economic background for domestic lenders in the UK. Directionally, S&U has mirrored its peers though the year-to-date and from its 12-month high it has outperformed, which can be justified by the resilience demonstrated by the main Advantage business through previous cycles.
Exhibit 13: Share price performance comparison
% change |
1 month |
3 months |
1 year |
YTD |
From 12m high |
S&U |
3.4 |
-10.9 |
-18.3 |
-0.5 |
-20.3 |
Close Brothers |
5.4 |
-4.4 |
-15.4 |
-6.0 |
-17.3 |
PCF Group |
8.0 |
-11.5 |
-32.3 |
-25.2 |
-33.7 |
Provident Financial |
5.5 |
-1.0 |
-35.9 |
-30.1 |
-39.6 |
Secure Trust Bank |
-2.3 |
-10.3 |
-24.7 |
9.2 |
-26.1 |
Average |
4.1 |
-6.8 |
-27.1 |
-13.0 |
-29.2 |
Source: Refinitiv. Note: Priced 26 September 2019.
Exhibit 14: Financial summary
£000s |
2016 |
2017 |
2018 |
2019 |
2020e |
2021e |
||
Year end 31 January |
||||||||
PROFIT & LOSS |
||||||||
Revenue |
|
|
45,182 |
60,521 |
79,781 |
89,215 |
98,002 |
108,240 |
Impairments |
(7,611) |
(12,194) |
(19,596) |
(23,186) |
(23,530) |
(25,880) |
||
Other cost of sales |
(8,980) |
(12,871) |
(17,284) |
(15,751) |
(19,814) |
(21,648) |
||
Administration expenses |
(7,131) |
(8,332) |
(9,629) |
(10,763) |
(12,322) |
(13,746) |
||
EBITDA |
|
|
21,460 |
27,124 |
33,272 |
39,515 |
42,336 |
46,965 |
Depreciation |
|
|
(209) |
(253) |
(294) |
(414) |
(475) |
(555) |
Op. profit (incl. share-based payouts pre-except.) |
|
|
21,251 |
26,871 |
32,978 |
39,101 |
41,862 |
46,410 |
Exceptionals |
0 |
0 |
0 |
0 |
0 |
0 |
||
Non recurring items |
0 |
0 |
0 |
0 |
0 |
0 |
||
Investment revenues / finance expense |
(1,782) |
(1,668) |
(2,818) |
(4,541) |
(4,962) |
(5,911) |
||
Profit before tax (FRS 3) |
|
|
19,469 |
25,203 |
30,160 |
34,560 |
36,900 |
40,499 |
Profit before tax (norm) |
|
|
19,469 |
25,203 |
30,160 |
34,560 |
36,900 |
40,499 |
Tax |
(3,583) |
(4,861) |
(5,746) |
(6,571) |
(6,876) |
(7,695) |
||
Discontinued business after tax |
53,299 |
|||||||
Profit after tax (FRS 3) |
|
|
69,185 |
20,342 |
24,414 |
27,989 |
30,024 |
32,804 |
Profit after tax (norm) |
|
|
15,886 |
20,342 |
24,414 |
27,989 |
30,024 |
32,804 |
Average Number of Shares Outstanding (m) |
12.0 |
12.0 |
12.1 |
12.1 |
12.1 |
12.1 |
||
Diluted EPS (p) |
|
|
576.5 |
169.1 |
202.4 |
232.0 |
248.7 |
271.7 |
EPS - normalised (p) |
|
|
132.4 |
169.1 |
202.4 |
232.0 |
248.7 |
271.7 |
Dividend per share (p) |
201.0 |
91.0 |
105.0 |
118.0 |
124.0 |
128.0 |
||
EBITDA margin (%) |
47.5% |
44.8% |
41.7% |
44.3% |
43.2% |
43.4% |
||
Operating margin (before GW and except.) (%) |
47.0% |
44.4% |
41.3% |
43.8% |
42.7% |
42.9% |
||
Return on equity |
15.2% |
15.2% |
16.7% |
17.6% |
17.4% |
17.3% |
||
BALANCE SHEET |
||||||||
Non-current assets |
|
|
103,653 |
138,004 |
181,015 |
185,383 |
215,413 |
238,124 |
Current assets |
|
|
61,903 |
57,763 |
84,178 |
95,430 |
106,188 |
117,552 |
Total assets |
|
|
165,556 |
195,767 |
265,193 |
280,813 |
321,600 |
355,675 |
Current liabilities |
|
|
(6,850) |
(17,850) |
(7,927) |
(6,722) |
(7,815) |
(8,144) |
Non current liabilities inc pref |
(30,450) |
(38,450) |
(104,450) |
(108,724) |
(132,801) |
(148,701) |
||
Net assets |
|
|
128,256 |
139,467 |
152,816 |
165,367 |
180,984 |
198,830 |
NAV per share (p) |
1,084 |
1,177 |
1,276 |
1,375 |
1,505 |
1,654 |
||
CASH FLOW |
||||||||
Operating cash flow |
|
|
(16,017) |
(27,431) |
(43,418) |
10,530 |
(9,113) |
230 |
Net cash from investing activities |
80,716 |
(308) |
(1,040) |
(785) |
(625) |
(860) |
||
Dividends paid |
(23,090) |
(9,548) |
(11,377) |
(13,080) |
(14,453) |
(15,088) |
||
Other financing (excluding change in borrowing) |
55 |
21 |
12 |
14 |
(16) |
0 |
||
Net cash flow |
|
|
41,664 |
(37,266) |
(55,823) |
(3,321) |
(24,206) |
(15,718) |
Opening net (debt)/cash |
|
|
(53,565) |
(11,901) |
(49,167) |
(104,990) |
(108,311) |
(132,494) |
Closing net (debt)/cash |
|
|
(11,901) |
(49,167) |
(104,990) |
(108,311) |
(132,494) |
(148,213) |
Source: S&U, Edison Investment Research. Note: FY16 dividend per share includes exceptional payment of 125p.
|
|
Research: Healthcare
In January, Carmat announced data from the initial 10 patients included in the first leg of its EU pivotal study investigating the surgical implantation of the Carmat heart in patients suffering from end-stage biventricular heart failure (HF). In total, 70% of these patients achieved the primary endpoint, which is survival at six months post implant. Also, improvements to the device manufacturing process starting in Q418 slightly delayed timelines. The trial is expected to resume with the improved Carmat heart in Q319.