Last close As at 05/08/2026
—
— 0.00 (0.00%)
Market capitalisation
—
Research: Financials
OTC Markets Group’s (OTCM) first quarter results showed progress with revenues up 5% and pre-tax profits 12% ahead of Q116. While the corporate client count was down, there are encouraging signs of an improvement in the rate of new additions. OTCM continues to refine the rules for its premium markets to enhance their reputation while minimising the burden on corporates. The drive to increase the number of states that grant OTCM markets Blue Sky recognition continues as a further means to increase their appeal to corporates. OTCM is also taking a measured approach in its response to the competitive threat from the Global OTC ATS.
Written by
OTC Markets Group |
Acceleration in corporate client signings |
Q117 results |
Financial services |
26 May 2017 |
Share price performance
Business description
Next events
Analysts
OTC Markets Group is a research client of Edison Investment Research Limited |
|||||||||||||||||||||||||||||||||||||||||||||||
OTC Markets Group’s (OTCM) first quarter results showed progress with revenues up 5% and pre-tax profits 12% ahead of Q116. While the corporate client count was down, there are encouraging signs of an improvement in the rate of new additions. OTCM continues to refine the rules for its premium markets to enhance their reputation while minimising the burden on corporates. The drive to increase the number of states that grant OTCM markets Blue Sky recognition continues as a further means to increase their appeal to corporates. OTCM is also taking a measured approach in its response to the competitive threat from the Global OTC ATS.
Year end |
Revenue ($m) |
PBT* |
EPS* |
DPS** |
P/E |
Yield |
12/15 |
49.9 |
16.9 |
0.88 |
1.08 |
25.6 |
4.8 |
12/16 |
50.9 |
16.9 |
0.95 |
1.16 |
23.7 |
5.2 |
12/17e |
53.8 |
17.6 |
0.96 |
1.20 |
23.4 |
5.3 |
12/18e |
55.9 |
18.1 |
0.97 |
1.22 |
23.2 |
5.4 |
Note: *Fully diluted and calculated after restricted stock awards and excluding exceptional items and amortisation of acquired intangibles. **Including special declared dividends of $0.6 for 2015 and 2016, and an estimated $0.6 for 2017 and 2018.
Q117 shows revival in corporate signings
Within the 5% Q117 revenue increase corporate services was the main contributor to growth, driven principally by a price increase implemented at OTCQX. Revenue for OTC Link ATS (trading services) was down reflecting continued contraction in the number of broker-dealer subscribers, while market data revenues showed a modest increase helped by a large increase in non-professional users. The total number of client companies was down 2% and 7% for OTCQX as strengthened criteria reduced the count. Positively, after a subdued period for sales, new additions increased for both premium markets, OTCQX and OTCQB, following a greater focus on this area during FY16.
Changeable backdrop, but generally positive outlook
The trading background for OTCM is sensitive to a range of macro factors that influence corporate confidence and activity in the equity market. With the US economy showing resilience this should provide a reasonable underpinning despite fluctuating views on the prospects for implementation of the Trump administration’s agenda. Also, subscription-type income accounts for the majority of revenue (we estimate over 80%), providing a measure of stability. We have broadly maintained our revenue estimates, but increased EPS forecasts by 4% and 2% for this year and next reflecting a lower assumed tax rate.
Valuation: Increased and similar to share price
OTCM shares are trading on an FY17e P/E below information providers (which also enjoy a subscription income base) and in line with the average for global exchange comparators. For the following year its P/E is somewhat above both areas but, taking into account the output from our discounted cash flow model (page 9), we see a fair value of c $22 as reasonable (previously c $20).
Investment summary
Company description: Transparent cost-effective markets
OTCM’s strategy is to build business-friendly markets for global and US companies with an emphasis on ensuring that information on corporates is widely available through open networks to help investors make informed choices. The tiered markets it operates further this objective by applying graduated criteria, which suit a range of companies capable of meeting different standards of disclosure while providing a venue for broker-dealer subscribers to facilitate trade across a spectrum of issuers. We estimate that over 80% of revenue can be described as subscription in nature rather than being transactional. This includes broker-dealer subscriptions, market data licences and initial and annual charges for companies on the premium OTCQX and OTCQB markets. OTCM aims to provide a service that is less onerous both in terms of administration and cost compared with listing on a national securities exchange such as Nasdaq.
Valuation: Broadly supported by comparator ratings
On a P/E comparison with information providers and exchanges, OTCM trades below the FY17e average for information providers and in line with the exchanges, while it trades modestly above both averages for FY18e (based on estimates taken from Bloomberg for the comparators). Setting drivers within our discounted cash flow model such that the valuation is in line with the current share price includes an assumption of long-term cash flow growth of 3%, a discount rate of 9% and a terminal cash flow multiple of between 16x and 17x. Taking this and the comparison of P/E multiples into account we increase our fair value to a level of c $22 compared with c $20 previously.
Financials: Revenue estimates held and EPS increased
Our total revenue estimates are broadly unchanged but we have allowed for more cautious assumptions for OTC Link ATS to reflect the continued contraction in the number of broker-dealer subscribers, a trend that shows no sign of abating. Slightly higher assumptions for the other segments, including allowance for an improvement in the number of new corporate clients signed up combined with the increase in fees for OTCQX, results in a maintained overall top-line forecast.
Sensitivities: Competition, regulation and technology
There is a range of sensitivities to consider including the macroeconomic and equity market background that may have a bearing on the level of corporate activity and appetite to seek a venue for trading shares. More specifically, we would pick out competition, regulation and technology as areas that are important for OTCM.
Competition: OTCM to some extent competes for corporate clients with national securities exchanges and for broker-dealer transactional flow has a direct competitor in the shape of Global OTC. Nevertheless, it has the advantage of an existing large market share and broker-dealer subscriber base for which switching or adding a platform entails increased costs.
Regulation: may have a positive or negative influence on OTCM. For example, regulation designed to facilitate new forms of equity fund-raising including crowdfunding could have a very positive effect on the potential pool of corporate clients. Negatively, Regulation Systems Compliance and Integrity (SCI) imposes additional costs of compliance on OTCM and future spending requirements may be material.
Technology: OTCM has successfully focused on increasing the resilience of its OTC Link ATS such that it has extended its 100% uptime record to over two years.
A provider of informed, reliable and efficient markets
The creation of OTCM in its current form began with the purchase of the National Quotation Bureau (NQB) in 1997 by a group of investors led by CEO, R Cromwell Coulson. NQB aggregated broker-dealer quotes for securities traded off exchange and published the resulting information in paper form: the Pink Sheets. Under new management the company employed technology to provide greater efficiency and improved transparency, beginning the move to a real-time electronic platform for broker-dealers to price and trade equities. Launched in 2003, this system evolved into the current, SEC-registered, OTC Link Alternative Trading System (ATS).
At the end of Q117 OTCM ATS had 99 active, broker-dealer participants and carried quotes in more than 9,600 securities. To help investors assess risk-pricing, companies are organised into three markets that are tiered based on the timeliness, quality and quantity of information they provide:
■
OTCQX Best Market: for investor-focused companies that meet high financial standards, are current in their disclosure and have third-party sponsors. At end Q117 there were 363 OTCQX companies and at the end of 2016, 60% were international and 40% US companies, approximately half of which were banks.
■
OTCQB Venture Market: for developing companies meeting standards that promote price transparency and facilitate public disclosure. OTCM believes many companies listed on TSX Venture, LSE AIM and other non-US venture exchanges could be served by the OTCQB Venture Market. At end Q117 there were 929 company clients on OTCQB.
■
Pink Open Market: for all types of companies that do not meet the criteria for OTCQX and OTCQB; the companies included are further organised based on the quantity and timeliness of disclosure (Current, Limited and No Information).
OTC Link ATS contributed 20% of revenue in the first quarter with Market Data Licensing and Corporate Services each contributing c 40%. For access to OTCM Link ATS, broker dealers pay subscription fees, quote fees for Pink securities and messaging fees. Market data licensing provides access to real-time and historical pricing data, together with corporate financial information and compliance data. Market data are disseminated through over 50 distributors such as Bloomberg, Interactive Data Corporation, Thomson Reuters and Fidessa and via enterprise-level licensing arrangements. Corporate services revenues are mainly generated from fixed application and annual charges to companies on the premium OTCQX and OTCQB markets (nearly 80% of segmental revenues). Pink companies may subscribe separately to disclosure, news and other services.
Revenues have grown at an annual compound rate of 13% between 2007 and 2016, with the most rapid growth (32% CAGR) seen in the Corporate Services business segment (Exhibit 1).
|
Exhibit 1: Gross revenue evolution and analysis |
|
|
Source: OTC Markets Group |
Q117 results: Revenue, margin and profit improvement
OTC Markets’ first-quarter figures showed net revenues up nearly 5% and pre-tax profit more than 12% ahead compared with the same period last year. Revenue growth was most marked in the corporate services area where the main driver was the implementation of a price increase at OTCQX, while OTC Link ATS saw a moderate decline as the contraction in the number of broker-dealer subscribers continued. Market Data Licensing reported a modest increase in revenue with a strong increase in the number of non-professional users and demand for compliance data products being positive factors, while the number of professional users was only marginally down.
Importantly, while the corporate client count was down versus the end of March last year, the rate of new additions has improved over the last two quarters, suggesting OTCM’s focus on client acquisition is bearing fruit (see comments below).
Key data points from the first-quarter results (Q117 versus Q116 unless stated) included:
■
Among the operating metrics by business line, for OTC Link ATS the number of active broker-dealer subscribers (99) was down 15%. The trading system has maintained its 100% uptime record, which now extends over more than two years. Total clients (1,967) for corporate services were 2% lower and down 7% for OTCQX to 363. OTCQX has tightened its eligibility criteria and as at 1/1/17 26 companies did not meet the requirements but, this aside, the retention rate for calendar 2017 has improved. Also positively, the rate of new additions at OTCQX increased from 13 to 16 and from 56 to 82 for OTCQB.
■
The overall revenue increase of 4.9% included a sharper 13.6% increase for corporate services. As noted, an important factor here was the increase in the annual fee for existing clients in OTCQX from $15,000 to $20,000.
■
Expenses increased by less than 2% with compensation and IT costs up by 5-6%, while consulting and marketing costs were down by 30% and 14% respectively, the latter partly reflecting a move towards digital marketing.
■
As a result, the operating margin increased from 31% to 33% and pre-tax profit was up by 12.2%. Changes in accounting for stock-based compensation resulted in a lower tax charge (an effective rate of 28% versus 39%) with the effect set to be concentrated in the first quarter each year in line with vesting schedules. This allowed diluted earnings per share to increase by 31% to $0.26.
■
A $0.14 quarterly dividend was declared, the eighth at this level.
Exhibit 2: Q117 results summary
($000s unless stated) |
Q116 |
Q316 |
Q416 |
Q117 |
% change vs Q116 |
% change vs Q416 |
OTC Link ATS |
2,754 |
2,530 |
2,631 |
2,618 |
(4.9) |
(0.5) |
Market data licensing |
5,325 |
5,274 |
5,218 |
5,450 |
2.3 |
4.4 |
Corporate services |
4,672 |
4,809 |
5,029 |
5,308 |
13.6 |
5.5 |
Gross revenues |
12,751 |
12,613 |
12,878 |
13,376 |
4.9 |
3.9 |
Re-distribution fees and rebates |
(593) |
(557) |
(583) |
(624) |
5.2 |
7.0 |
Net revenue |
12,158 |
12,056 |
12,295 |
12,752 |
4.9 |
3.7 |
Operating expenses |
(8,361) |
(7,658) |
(7,683) |
(8,514) |
1.8 |
10.8 |
Income from operations |
3,797 |
4,398 |
4,612 |
4,238 |
11.6 |
(8.1) |
Other income / net interest |
(8) |
11 |
2 |
14 |
N/A |
N/A |
Income before provision for income taxes |
3,789 |
4,409 |
4,614 |
4,252 |
12.2 |
(7.8) |
Taxes |
(1,474) |
(1,404) |
(1,921) |
(1,202) |
(18.5) |
(37.4) |
Net income |
2,315 |
3,005 |
2,693 |
3,050 |
31.7 |
13.3 |
Diluted EPS $ |
0.20 |
0.26 |
0.23 |
0.26 |
31.0 |
11.8 |
Operating margin |
31% |
36% |
38% |
33% |
Source: OTCM, Edison Investment Research
The following table provides a summary of key operating metrics, together with related revenue data. In addition to the points mentioned above, we note the increase in revenue per client within Corporate Services, reflecting the price increase at OTCQX and a degree of average revenue dilution per user in Market Data Licensing, reflecting the growth in non-professional users.
Exhibit 3: Operating and related revenue data
Q116 |
Q316 |
Q416 |
Q117 |
% chg |
% chg |
|
OTC Link ATS |
||||||
Number of securities quoted |
9,819 |
9,644 |
9,633 |
9,638 |
(1.8) |
0.1 |
Number of active participants |
116 |
108 |
106 |
99 |
(14.7) |
(6.6) |
Revenue per security quoted ($) |
280 |
262 |
273 |
272 |
(3.2) |
(0.5) |
Revenue per average active participant ($) |
23,741 |
23,000 |
24,589 |
25,541 |
7.6 |
3.9 |
Revenue bps of volume traded |
0.61 |
0.54 |
0.46 |
0.47 |
(23.5) |
1.8 |
Corporate Services |
||||||
Number of corporate clients |
||||||
OTCQX |
388 |
387 |
398 |
363 |
(6.4) |
(8.8) |
OTCQB |
929 |
869 |
872 |
928 |
(0.1) |
6.4 |
Pink |
686 |
693 |
665 |
676 |
(1.5) |
1.7 |
Total |
2,003 |
1,949 |
1,935 |
1,967 |
(1.8) |
1.7 |
Revenue per client ($) |
2,333 |
2,467 |
2,599 |
2,699 |
15.7 |
3.8 |
Market Data Licensing |
||||||
Market data professional users |
20,923 |
22,096 |
20,628 |
20,700 |
(1.1) |
0.3 |
Market data non-professional users |
11,418 |
11,472 |
12,839 |
16,022 |
40.3 |
24.8 |
Revenue per user (total) |
165 |
157 |
156 |
148 |
(9.9) |
(4.8) |
Source: OTCM, Edison Investment Research
Other business and regulatory developments
OTCM is continuing to work with the North American Securities Administrators Association and individual state regulators to increase the number of states that accept the disclosure provided by OTCQX and OTCQB for the purpose of Blue Sky recognitions, which generally allow investment professionals to recommend qualifying securities to investors or purchase them for managed portfolios. In Q117 one further state (Delaware) was added to the list that recognises OTCQX, taking the total to 21 while 18 recognise OTCQB. The pace of additions appears to have slowed (between its H116 announcement and the FY16 announcement 15 states were added to the list), but OTCM notes that a number of states have announced a proposed rule change and this tends to take longer than if the change were through no-action letters and administrative actions.
The enhancement of OTCQX rules implemented in January this year should not only increase investor appreciation of the tiering between the markets, but may also help in the process of securing Blue Sky recognitions. Further recognitions in turn seem likely to enhance the reputation of OTCM’s two premium markets and increase their appeal to corporates as a venue for trading.
Exhibit 4: Blue Sky recognition for OTCQX and OTCQB
State |
Recognition |
State |
Recognition |
Alaska |
Both |
New Mexico |
Both |
Arkansas |
Both |
Ohio |
Both |
Colorado |
Both |
Oregon |
Both |
Delaware |
Both |
Rhode Island |
Both |
Georgia |
Both |
South Dakota |
Both |
Idaho |
OTCQX only |
Texas |
Both |
Iowa |
Both |
Vermont |
OTCQX only |
Kansas |
OTCQX only |
Washington |
Both |
Mississippi |
Both |
Wisconsin |
Both |
Nebraska |
Both |
Wyoming |
Both |
New Jersey |
Both |
Source: OTCM
A further rule change for OTCQX implemented in January was the removal of the requirement for an annual certification from an OTCQX professional adviser and that corporates’ information should be published in a recognised securities manual, lightening the administrative burden. For OTCQB a proposed amendment to standards will allow companies to qualify by following OTCM’s Alternative Reporting Standard (for US companies not reporting to the SEC) and similar corporate governance standards to OTCQX companies.
The Transfer Agent Verified Shares Program is another initiative to improve transparency by giving timely information on share issuance/share count, which helps investors to monitor potential dilution of their interests. Following its launch last year, during which seven agents signed up, the number of agents participating has increased to 10.
A potentially significant change in the competitive landscape is the move by Global OTC, a subsidiary of NYSE, to remove its quotes from OTC Link ATS, and to start operating a more directly competing alternative trading system employing a fully automated trading platform with a lit limit order book and auctions. Global OTC also provides real-time trade and quote data to investors, broker-dealers and market data distributors. Global OTC trades approximately 4,000 OTC securities and plans to trade all 10,000 securities by the end of 2017. The current fee structure is an execution charge of $0.003 per share (share price above $1.00) for liquidity removal with no rebate for adding liquidity. From the beginning of June incentives for monthly executed liquidity provided will apply, giving lower execution charges of $0.002 (1m to 50m shares) and $0.001 (over 50m shares) per share for liquidity removed. Data feeds are provided free of charge currently but charges will apply from the beginning of July. Global OTC implemented its plan at the beginning of May and early data indicate an average market share of c 9%. Based on these data, we estimate that OTC Link ATS has a market share of approximately 50% and understand that the remaining activity is accounted for by trades negotiated directly between broker dealers. Global OTC remains a trade messaging subscriber to OTC Link ATS as most of the trading carried out on the platform is with OTC Link ATS liquidity providers.
In response to this development OTCM has enhanced its system to allow OTC Link ATS subscribers to see aggregated market data and to route orders to Global OTC, limiting any disruption for its clients that might otherwise arise. OTCM notes that the loss of Global OTC as a subscriber will have a minimal impact on revenue but that it is too early to determine the competitive impact of its order book-based offering. We would observe that volume on the Global OTC platform may generate activity on OTC Link ATS as broker-dealers offset trades while related messaging revenues are likely to continue to flow to OTCM given the position of OTC Link ATS subscribers in this market. The longer-term impact on OTCM revenues for both OTC Link ATS and data licensing will hinge on whether Global OTC or any other inter-dealer quotation system is able to take a substantially higher market share. Also uncertain are the possible implications for the participation of smaller broker-dealers in the OTC market given the increase in costs arising from market fragmentation.
The presence of a credible competitor with a live trading system may reduce the chances of FINRA pursuing its proposal for an over-the-counter display facility (ODF, August 2016). This would act as a back-up to OTC Link ATS and appears to reflect concerns at the SEC regarding the availability of alternative channels in the event of a system failure. The proposal has been through an initial consultation period that only elicited three responses, each arguing against the adoption of the rule, and FINRA has not made any further announcement or submitted the proposal to the SEC.
Current trading environment and outlook
We start by looking at recent trends in the equity capital markets background for OTCM. The volume of IPOs has been mixed across markets. At Nasdaq (Exhibit 5) the number of IPOs has been on a steep downtrend since a peak in 2014 and annualising the first quarter rate (giving 68 IPOs) would represent a further marked reduction. By contrast, the Canadian TMX markets’ year to date (end April) annualised run rate of IPOs is well ahead of 2016 (+55% for TSX and +83% for TSX Ventures – Exhibit 6).
|
Exhibit 5: Nasdaq – number of IPOs |
Exhibit 6: TSX and TSX Venture – number of IPOs |
|
|
|
Source: Nasdaq |
Source: TMX. Note: 2017 ytd is to end April. |
|
Exhibit 5: Nasdaq – number of IPOs |
|
|
Source: Nasdaq |
|
Exhibit 6: TSX and TSX Venture – number of IPOs |
|
|
Source: TMX. Note: 2017 ytd is to end April. |
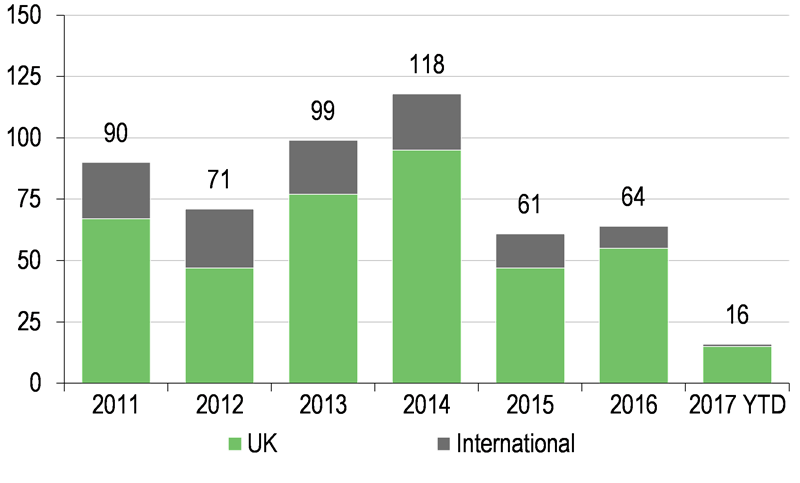
In the UK the level of IPOs has been subdued and year to date AIM IPOs are down 25% on an annualised basis compared with the 2016 level. Brexit-related concerns and, arguably, the announcement of an early general election may not be conducive to new issuance, but brokers report good pipelines of transactions.
The positive market response to the US election has dissipated to some extent as campaign statements have given way to the challenges of implementation. Nevertheless, the market performance in the US (and the UK and Canada) has generally been positive (see Exhibit 7), helped by resilient economic trends. If maintained this should create an increasingly favourable environment for IPOs.
|
Exhibit 7: AIM number of admissions |
Exhibit 8: Six-month index performance (US$ terms) |
|
|
|
Source: AIM. Note: To end April. |
Source: Bloomberg. Note: Total return, to 22 May 2017. |
|
Exhibit 7: AIM number of admissions |
|
|
Source: AIM. Note: To end April. |
|
Exhibit 8: Six-month index performance (US$ terms) |
|
|
Source: Bloomberg. Note: Total return, to 22 May 2017. |
For OTCM itself, as noted earlier, the trend in new client additions has improved in the last two quarters and the retention rate at OTCQX was higher at 93% for 2017 compared with 89% in 2016. OTCM continues its work to increase the number of Blue Sky recognitions and has refined its premium market requirements to enhance the reputation of its markets and to reduce the administrative burden on and contain costs for corporate clients.
The arrival of Global OTC ATS as a direct competitor for OTCM Link ATS does increase uncertainty in an area where the contracting number of broker-dealers is already pressuring revenues. However, as noted earlier, OTCM expects the initial impact on revenues to be limited and is focusing on enhancing its services to broker-dealers to address the challenge.
On a medium- to longer-term view, OTCM is positive on the potential impact of the development of online or crowdfunded capital-raising facilitated by the Jumpstart Our Business Startups (JOBS) Act (including Regulation A+ and Regulation Crowdfunding). As online funding matures OTCM sees good potential for these developing companies to be attracted to trading on its markets. OTCM aims for the costs for its corporate clients to be less than half the level of national securities exchanges, while companies would also benefit from a lower administrative burden. OTCM is joining others in pushing for Regulation A to be extended to SEC reporting companies to expand the number of developing companies that can take advantage of less burdensome means of raising capital. It may be the case that a contraction in the number of US-listed companies creates a favourable backdrop for this and other measures that ease the path for growing companies to raise fresh equity.
Our next two charts compare the number of professional and non-professional users of OTCM’s market data and users of UTP (Nasdaq). For professional users there are only small changes for both OTCM and UTP, although the OTCM figure is marginally up rather than down. For non-professional users there was a marked increase for both OTCM and UTP in Q117. OTCM’s professional user base is equivalent to less than 8% of the UTP number, a relatively low penetration of the potential market. If OTCM can continue to build the reputation of its premium markets and new capital raising techniques gain traction, providing an increasing flow of attractive potential clients, there should be significant potential to increase market data revenue.
|
Exhibit 9: OTCM and UTP (Nasdaq) professional users |
Exhibit 10: OTCM and UTP non-professional users |
|
|
|
Source: OTCM, UTP Plan, Edison Investment Research |
|
Exhibit 9: OTCM and UTP (Nasdaq) professional users |
|
|
Source: OTCM, UTP Plan, Edison Investment Research |
|
Exhibit 10: OTCM and UTP non-professional users |
|
|
Source: OTCM, UTP Plan, Edison Investment Research |
In summary, the economic background in the US, while still marked by some uncertainty, has shown resilience and is broadly positive. The pause in equity market strength following a buoyant post-presidential election period may detract from corporate activity in the near term, but on the other hand continued relatively low volatility should be favourable and markets have shown an ability to look through the ebb and flow of political developments. The competitive threat, highlighted by, but not confined to the Global OTC development, will need to be monitored but encouragement is provided by OTCM’s measures to address these and develop its premium markets. There is potential for negative regulatory measures but there is also scope for increased opportunities for OTCM if crowdfunding gains momentum, perhaps helped by further regulatory changes.
Financials
As shown in Exhibit 11 there are only minor changes in our estimates following the first quarter results, with revenues virtually unchanged, marginally lower pre-tax profit and modestly higher EPS reflecting the lower tax charge mentioned earlier. We look for revenue growth of between 5% and 6% this year followed by 4% for FY18. Segmentally, we have made more cautious assumptions for OTC Link ATS, reflecting the trading commentary earlier, balanced by slightly higher estimates in the other areas.
Exhibit 11: Earnings revisions
|
Gross revenue ($m) |
PBT ($m) |
EPS ($) |
Dividend ($) |
||||||||
|
Old |
New |
% change |
Old |
New |
% change |
Old |
New |
% change |
Old |
New |
% change |
2017e |
53.3 |
53.8 |
1 |
17.9 |
17.6 |
(2) |
0.93 |
0.96 |
4 |
1.20 |
1.20 |
0 |
2018e |
55.7 |
55.9 |
0 |
18.7 |
18.1 |
(3) |
0.96 |
0.97 |
2 |
1.22 |
1.22 |
0 |
Source: Edison Investment Research
Operating cash flows in the first quarter were $1.7m ahead of the prior year ($0.8m) and sufficient to cover the dividend payment in the period ($1.6m). In addition to the dividend payment, OTCM bought back $1.4m of shares into treasury and this, with other small net outflows, resulted in a $1.5m reduction in cash since the year end to $23.5m. On our estimates for FY17 and FY18 year-end cash would be around $22m after allowing for the payment of further special dividends such that the overall level of dividend increases.
Valuation
Our comparative P/E table (Exhibit 12) includes major information providers MSCI and Markit (in recognition of OTCM’s subscription-based fees and market data exposure), together with global exchange averages and values for the S&P 500 index. OTCM trades within the range for the information providers and is trading above the FY17e and FY18e average P/Es for the exchanges. Further Blue Sky recognitions and confirmation of a pick-up in the environment for corporate activity would help underpin this rating, while the likely earnings upgrades that would accompany this scenario would be positive for valuation.
Exhibit 12: OTCM comparative multiples
Estimated P/E ratios (x) |
||
FY17e |
FY18e |
|
MSCI |
27.2 |
23.4 |
Markit |
21.7 |
18.7 |
Average information providers |
24.5 |
21.1 |
Average global exchanges |
23.0 |
20.5 |
S&P 500 |
18.5 |
16.5 |
OTCM |
23.3 |
23.1 |
Source: Bloomberg, Edison Investment Research. Note: Prices as at 23 May 2017.
Using our discounted cash flow model to determine a set of assumptions that would match the current share price, we find that a discount rate of 9%, long-term cash flow growth of 3% and a terminal multiple of 16.5x (arguably not excessive in comparison to the current year value of c 20x) would align the valuation with the current share price ($22.50). A sensitivity table shows the variation in implied valuation with changes in growth and discount rate assumptions.
Exhibit 13: Discounted cash flow valuation sensitivity ($ per share)
Discount rate (right) |
7% |
8% |
9% |
10% |
11% |
2% |
24.4 |
22.8 |
21.3 |
20.0 |
18.7 |
3% |
25.9 |
24.1 |
22.5 |
21.1 |
19.8 |
4% |
27.5 |
25.6 |
23.9 |
22.3 |
20.9 |
5% |
29.2 |
27.1 |
25.3 |
23.6 |
22.1 |
Source: Edison Investment Research
Taking into account the comparative valuations shown above and the potential DCF outputs on a range of assumptions, we see a fair value of c $22, similar to the current share price, as reasonable (previously c $20) with potential for upside with increased evidence of favourable trends in the market background.
Exhibit 14: Financial summary
$000s |
2014 |
2015 |
2016 |
2017e |
2018e |
||
Year end 31 December |
|||||||
PROFIT & LOSS |
|||||||
OTC Link ATS |
12,019 |
11,796 |
10,573 |
10,343 |
10,136 |
||
Market Data Licensing |
20,334 |
20,610 |
21,054 |
21,900 |
22,557 |
||
Corporate Services |
9,862 |
17,503 |
19,254 |
21,508 |
23,229 |
||
Revenue |
42,215 |
49,909 |
50,881 |
53,751 |
55,922 |
||
Re-distribution fees and rebates |
(2,388) |
(2,379) |
(2,317) |
(2,514) |
(2,575) |
||
Net revenue |
|
|
39,827 |
47,530 |
48,564 |
51,237 |
53,347 |
Operating expenses |
(25,382) |
(28,972) |
(30,032) |
(32,119) |
(33,564) |
||
EBITDA |
|
|
14,445 |
18,558 |
18,532 |
19,118 |
19,782 |
Depreciation |
(1,543) |
(1,692) |
(1,606) |
(1,580) |
(1,650) |
||
Operating Profit |
12,902 |
16,866 |
16,926 |
17,538 |
18,132 |
||
Net Interest |
9 |
27 |
9 |
29 |
15 |
||
Profit Before Tax (norm) |
|
|
12,911 |
16,893 |
16,935 |
17,567 |
18,147 |
Tax |
(5,021) |
(6,635) |
(6,407) |
(5,995) |
(6,352) |
||
Profit After Tax (FRS 3) |
7,890 |
10,258 |
10,528 |
11,572 |
11,796 |
||
Profit After Tax (norm) |
7,638 |
9,971 |
10,826 |
11,260 |
11,484 |
||
Fully diluted av. No. of shares (m) |
11.1 |
11.3 |
11.3 |
11.7 |
11.8 |
||
EPS - normalised fully diluted (c) |
|
|
68.58 |
88.32 |
95.47 |
96.41 |
97.50 |
Fully diluted EPS - FRS 3 ($) |
|
|
70.50 |
90.58 |
97.60 |
98.52 |
99.61 |
Dividend per share (c) |
82.00 |
108.00 |
116.00 |
120.00 |
122.00 |
||
EBITDA Margin (%) |
36 |
39 |
38 |
37 |
37 |
||
Operating profit margin (%) |
32 |
35 |
35 |
34 |
34 |
||
BALANCE SHEET |
|||||||
Non-current assets |
|
|
|
|
|
|
|
Intangible Assets |
291 |
291 |
291 |
291 |
291 |
||
Property and other |
4,844 |
4,187 |
3,267 |
2,554 |
1,604 |
||
Current Assets |
|
|
|
|
|
|
|
Debtors |
5,674 |
6,082 |
6,262 |
5,853 |
5,853 |
||
Cash & cash investments |
20,272 |
23,925 |
25,034 |
21,761 |
22,154 |
||
Other current assets |
2,095 |
1,729 |
1,789 |
2,326 |
2,326 |
||
Current Liabilities |
|
|
|
|
|
|
|
Deferred revenues |
(9,521) |
(12,737) |
(14,664) |
(14,572) |
(14,572) |
||
Other current liabilities |
(4,450) |
(5,063) |
(5,372) |
(3,581) |
(3,581) |
||
Long Term Liabilities |
|
|
|
|
|
|
|
Tax, rent and other |
(954) |
(867) |
(1,101) |
(1,089) |
(1,089) |
||
Net Assets |
|
|
18,251 |
17,547 |
15,506 |
13,543 |
12,986 |
NAV per share ($) |
|
|
1.62 |
1.55 |
1.36 |
1.18 |
1.12 |
CASH FLOW |
|||||||
Operating Cash Flow |
|
|
16,985 |
22,400 |
21,752 |
17,109 |
21,433 |
Net Interest |
9 |
27 |
9 |
29 |
15 |
||
Tax |
(4,492) |
(5,320) |
(6,021) |
(4,541) |
(6,352) |
||
Capex |
(1,582) |
(940) |
(415) |
(602) |
(700) |
||
Financing / investments |
(475) |
(420) |
(1,157) |
(1,562) |
0 |
||
Dividends |
(9,109) |
(12,094) |
(13,059) |
(13,706) |
(14,004) |
||
Net Cash Flow |
1,336 |
3,653 |
1,109 |
(3,273) |
393 |
||
Opening net (debt)/cash |
|
|
18,936 |
20,272 |
23,925 |
25,034 |
21,761 |
Closing net (debt)/cash |
|
|
20,272 |
23,925 |
25,034 |
21,761 |
22,154 |
Source: OTC Markets Group accounts, Edison Investment Research
|
|||||||||||||||||||||||||||||||||||||||||
|
|
Research: Industrials
Trading in the first four months of FY17 has been in line with management expectations and our estimates are unchanged. Market commentary is cautious, but as outlined in our recent note Epwin has a number of internal initiatives underway to further improve the business and mitigate near-term input cost pressures. In our view, longer-term prospects are somewhat better than the current rating is implying.