Last close As at 05/08/2026
USD48.24
▲ 3.33 (7.41%)
Market capitalisation
USD20,120m
Research: Metals & Mining
Pan American Silver (PAAS) has seen an encouraging start to the year with Q124 silver and gold production in line with management expectations and costs for both segments below its quarterly guidance. Q1 is typically one of the slowest quarters for PAAS and the company’s maintained guidance points to significant improvements in production and costs in H224. This should be supported by the current strength in commodity prices. We have increased our FY24 EBITDA estimate by 25% and upgraded our valuation from US$22.2/share to US$23.4. We believe there could be further upside to the share price if commodity prices remain at elevated levels and the company delivers on its operational guidance in FY24.
Pan American Silver |
A taste of things to come |
Q124 results update |
Metals and mining |
14 May 2024 |
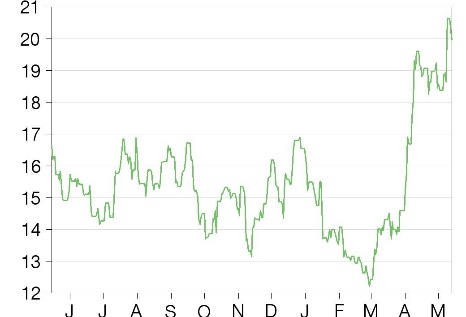
Share price performance
Business description
Next event
Analysts
Pan American Silver is a research client of Edison Investment Research Limited |
|||||||||||||||||||||||||||||||||||||||||||||||
Pan American Silver (PAAS) has seen an encouraging start to the year with Q124 silver and gold production in line with management expectations and costs for both segments below its quarterly guidance. Q1 is typically one of the slowest quarters for PAAS and the company’s maintained guidance points to significant improvements in production and costs in H224. This should be supported by the current strength in commodity prices. We have increased our FY24 EBITDA estimate by 25% and upgraded our valuation from US$22.2/share to US$23.4. We believe there could be further upside to the share price if commodity prices remain at elevated levels and the company delivers on its operational guidance in FY24.
Year |
Revenue |
EBITDA |
EPS* |
DPS |
EV/EBITDA |
Yield |
12/22 |
1,494.7 |
272.0 |
(0.54) |
0.45 |
25.6 |
2.3 |
12/23 |
2,316.1 |
680.6 |
0.19 |
0.41 |
10.2 |
2.1 |
12/24e |
2,743.8 |
958.6 |
0.58 |
0.40 |
7.3 |
2.0 |
12/25e |
2,400.4 |
827.9 |
0.54 |
0.40 |
8.4 |
2.0 |
Note: *EPS excludes exceptional items.
Q124 results: A good starting point
Q124 silver and gold production was in line with company expectations and cash costs for both segments were below its quarterly guidance. The silver segment cash cost was down 34% q-o-q to US$12.7/oz, while the gold cash cost increased 10% but remained at a very comfortable US$1,207/oz. The strength of the company’s cost performance should be viewed through the prism of a reduction in quarterly silver and gold sales, which sequentially fell 14% and 16%. The decline in sales was partly offset by the higher realised gold price. As a result, PAAS reported Q124 revenues of US$601m, down 10% q-o-q, and EBITDA of US$162m.
Maintained guidance points to strong H224
PAAS has maintained its 2024 operating guidance, which suggests a significant improvement in cost performance and production in H224. Coupled with the current strength in commodity prices, it implies a visible boost to financial performance this year. We have upgraded our FY24e EBITDA by 25% to US$959m.
Escobal consultation delay
PAAS reported a delay in the ILO 169 consultation process at Escobal since the new government took office in Guatemala in January 2024. The government remains committed to completing the consultation process but has not yet provided an update on the timeline. We have changed our approach to the valuation of Escobal and now value the project on a standalone NPV basis.
Valuation: Commodity prices remain supportive
We have upgraded our valuation of PAAS from US$22.2/share to US$23.4. The increase is mainly due to the higher FY24 commodity price assumptions. Despite the recent healthy rebound in the share price, we believe there could be a further upside if commodity prices remain at elevated levels and the company continues to deliver on its cost and production guidance throughout 2024.
Q124 results review: An encouraging start to the year
PAAS has had an encouraging start to the year, with Q124 silver and gold production in line with company expectations and cash costs for both segments remaining below its quarterly guidance (Exhibit 2). We note that the results are not directly comparable to Q423 due to seasonality and Q123 due to the timing of the Yamana asset consolidation. Nevertheless, the silver segment cash cost was down 34% q-o-q to US$12.7/oz, mainly because of the reduction in costs at Cerro Moro and La Colorada, while the gold cash cost increased 10% but stayed at a very comfortable level of US$1,207/oz. The strength of the company’s cost performance should be viewed through the prism of a visible reduction in quarterly silver and gold sales, which sequentially fell 14% and 16%, respectively, as Q4 is normally the seasonally strongest quarter. At the top-line level, however, the reduction in sales was partly offset by the higher realised gold price, which increased 5% q-o-q to US$2,078/oz. As a result, PAAS reported Q124 revenues of US$601m, down 10% q-o-q, with EBITDA of US$162m. The company’s adjusted EPS was US$0.01 compared to a loss of US$0.04 in Q423.
PAAS finished the quarter with net debt of US$475m compared to US$361m at end FY23. This increase includes the share buyback of US$21.5m, with an additional US$2.8m spent since the quarter end. The company declared a dividend of US$0.1/share with respect to Q124. Further, on 1 May, PAAS announced the sale of the producing La Arena gold mine and La Arena II project for US$245m in cash, US$50m in deferred consideration and 1.5% in gold royalty. Among other things (see our recent note), the divestment should strengthen the company’s balance sheet, with pro forma Q124 net debt of US$230m.
Exhibit 1: Q124 results summary, US$m
|
Q124 |
Q423 |
q-o-q, % |
Q123 |
Silver production, koz |
5,009 |
4,835 |
3.6 |
3,891.0 |
Gold production, koz |
223 |
248 |
(10.2) |
122.7 |
Silver segment cash cost, US$/oz |
12.7 |
19.3 |
(34.4) |
12.2 |
Silver segment AISC, US$/oz |
15.9 |
26.6 |
(40.3) |
14.1 |
Gold segment cash cost, US$/oz |
1,207 |
1,096 |
10.1 |
1,120.0 |
Gold segment AISC, US$/oz |
1,580 |
1,411 |
12.0 |
1,196.0 |
Revenue |
601 |
670 |
(10.2) |
390 |
Cash production costs |
(392) |
(441) |
(11.1) |
(231) |
D&A |
(124) |
(143) |
(13.1) |
(73) |
Royalties |
(14) |
(20) |
(31.5) |
(9) |
Mine operating earnings |
71 |
65 |
9.4 |
77 |
Care and maintenance |
(9) |
(9) |
(4.4) |
(22) |
Exploration |
(3) |
(4) |
(26.3) |
(1) |
G&A |
(22) |
(19) |
21.1 |
(10) |
EBITDA (Edison) |
162 |
201* |
(19.8) |
117 |
Reported PBT |
4 |
(48) |
N/A |
25 |
Reported EPS, US$ |
(0.08) |
(0.19) |
(55.4) |
0.08 |
Adjusted EPS (company), US$ |
0.01 |
(0.04) |
N/A |
0.10 |
Source: PAAS, Edison Investment Research. Note: *EBITDA includes US$25m in upwards PPA inventory adjustment.
PAAS reported a delay in the ILO 169 consultation process at Escobal since the new government took office in Guatemala in January 2024. The government has confirmed its commitment to completing the consultation process, but has not provided an update on the possible timeline. In light of these developments, we have changed our valuation approach to Escobal and now value the project on a standalone NPV basis (see below).
Revised earnings estimates
The company maintained its FY24 operational guidance and expects to produce 21–23Moz of silver and 880–1,000koz of gold at costs shown in Exhibit 2. Production is expected to be second-half weighted and costs are anticipated to reduce, especially in the silver segment due to the anticipated production recovery at La Colorada, towards the end of the year. Importantly, the company’s cost guidance is based on assumed gold and silver prices of US$1,950/oz and US$23.5/oz. If commodity prices continue to trade above these levels, cost estimates could look increasingly conservative. The spot gold and silver prices are currently c US$2,340/oz and US$28.2/oz, which from a cost point of view should be beneficial for the projects with large silver/gold by-product credits, in particular Cerro Moro and El Penon.
Exhibit 2: FY24 quarterly guidance
|
Q124 |
Q224 |
Q324 |
Q424 |
FY24 |
Silver production, Moz |
4.75–5.30 |
5.36–5.78 |
5.44–5.97 |
5.45–5.95 |
21.0–23.0 |
Gold production, koz |
204–231 |
221–252 |
229–258 |
226–259 |
880–1,000 |
Silver segment cash cost, US$/oz |
16.5–18.5 |
15.5–17.5 |
10.5–12.9 |
4.6–7.7 |
11.7–14.1 |
Silver segment AISC, US$/oz |
21.3–23.3 |
20.2–22.2 |
15.6–18.0 |
7.7–11.0 |
16.0–18.5 |
Gold segment cash cost, US$/oz |
1,270–1,370 |
1,170–1,240 |
1,140–1,220 |
1,080–1,160 |
1,165–1,260 |
Gold segment AISC, US$/oz |
1,500–1,700 |
1,500–1,590 |
1,460–1,570 |
1,400–1,500 |
1,475–1,575 |
Source: PAAS
We have updated our estimates for the Q124 results and made a number of project-related adjustments. While most of our underlying operational and cost assumptions at the project level remain broadly unchanged, we have made the following adjustments:
■
We have assumed that the La Arena sale will complete at the end of Q324 and that the project will only contribute for three quarters this year. We have reflected the cash payment of US$245m in our model’s cash flows. La Arena is a relatively high-cost mine and its sale should result in a marginal reduction in the gold segment costs.
■
At Dolores, we factored in the end of mining activities this year and have modelled the subsequent leaching operations for three years for gold and eight years for silver, in line with the company’s disclosure, based on 4.3Moz of silver and 35.4koz of gold inventory.
■
Finally, while we assume an improvement in production rates at La Colorada in H224 as ventilation issues are gradually resolved, we take a relatively cautious view and model the project’s FY24 cash cost at the top end of the company’s guidance range of US$16.6–19.3/oz.
Overall, our FY24 silver production estimate is broadly unchanged at 21.9Moz, while the gold production forecast of 922koz is 6% lower. We expect a further 8% reduction in gold production in FY25, mainly due to the La Arena divestment. Our FY24 gold and silver cash cost estimates are little changed and we model a gradual reduction in costs in FY25.
Exhibit 3: Changes to operational and cost estimates
|
FY24e |
FY25e |
FY24 |
|
|
New |
Old |
New |
Guidance |
Total silver production, Moz |
21.9 |
22.0 |
23.4 |
21–23 |
Total gold production, koz |
922 |
983 |
851 |
880–1,000 |
Silver segment cash cost, US$/oz |
12.7 |
12.4 |
10.5 |
11.7–14.1 |
Silver segment AISC, US$/oz |
16.8 |
16.6 |
14.6 |
16.0–18.5 |
Silver price, US$/oz |
26.2 |
23.5 |
25.0 |
23.5 |
Gold segment cash cost, US$/oz |
1,182 |
1,207 |
1,093 |
1,165–1,260 |
Gold segment AISC, US$/oz |
1,522 |
1,524 |
1,373 |
1,475–1,575 |
Gold price, US$/oz |
2,230 |
1,987 |
2,004 |
1,950 |
Source: PAAS, Edison Investment Research
We have also revised our commodity price estimates for the year, given the recent strength in gold and silver prices. Our updated gold price of US$2,230/oz is 12% above our previous estimate, while our silver price assumption of US$26.2/oz is 11% higher. We keep our commodity price assumptions beyond FY24 unchanged for now.
Overall, we are upgrading our FY24 revenue estimate by 6% to US$2,744m and our EBITDA estimate by 25% to US$959m. Both forecasts are somewhat above consensus, which currently points to FY24 EBITDA of US$884m. Importantly, we expect PAAS to sell 926koz of gold (0.4% above production vs 2.4% in Q124 and 1.2% in FY23) and 20.9Moz of silver in FY24. We have introduced FY25 estimates, excluding Escobal, which we had previously expected to start production in mid-2025. The anticipated sequential reduction in revenues and EBITDA is mainly due to our assumed lower commodity prices and estimated reduction in gold production.
Exhibit 4: Changes to financial estimates
|
FY24e |
FY25e |
||
US$m |
New |
Old |
% change |
New |
Revenue |
2,744 |
2,578 |
6.4 |
2,400 |
Cash production costs |
(1,603) |
(1,640) |
(2.3) |
(1,402) |
D&A |
(492) |
(496) |
(0.9) |
(396) |
Royalties |
(64) |
(62) |
4.5 |
(58) |
Exploration, care and maintenance |
(40) |
(39) |
3.3 |
(38) |
G&A |
(78) |
(73) |
7.6 |
(75) |
EBITDA |
959 |
765 |
25.4 |
828 |
Reported EPS, US$ |
0.55 |
0.24 |
128.5 |
0.54 |
Normalised EPS (Edison), US$ |
0.58 |
0.24 |
140.8 |
0.54 |
Source: Edison Investment Research
Valuation: Supportive commodity prices
We have upgraded our valuation of PAAS from US$22.2/share to US$23.4. The main increase in the valuation comes from our revised earnings estimates on the back of the higher commodity prices. We have also changed our approach to the valuation of Escobal. We previously assumed the project would start production in mid-2025. However, given the likely delay in completing the ILO 169 consultation process, we now value it on a standalone NPV basis using a real discount rate of 5%, which we increased by 1pp to account for the higher uncertainty introduced by the recent political changes in Guatemala, and our long-term silver price of US$24/oz. We make no changes to the operational assumptions for Escobal, which are based on the feasibility study and discussed in more detail in our PAAS initiation report. Our valuation now includes the sale of La Arena (the cash consideration only), which we assume will complete at the end of Q324, and the recent share buyback.
Despite the recent healthy recovery in the share price, which we believe was mainly driven by the strength in the commodity prices and the share buyback, on our estimates PAAS still trades at FY24 EV/EBITDA of 7.3x (7.9x consensus). We believe there is further upside to the share price if commodity prices remain at elevated levels and the company continues to deliver on its operational outlook throughout 2024. Any progress on bringing the Escobal project back into production could be an additional strong catalyst for the share price.
Exhibit 5: PAAS valuation summary
WACC – nominal (FY24-28e)/real (from FY28e) |
7.4%/5.0% |
|
Tax on EBIT |
40% |
|
Number of shares outstanding, including share buyback |
362.9m |
|
US$m |
US$/share |
|
Sum of discounted free cash flow, currently producing operations |
5,763 |
15.9 |
Add exploration/development assets |
748 |
2.1 |
Add Escobal |
2,087 |
5.8 |
Less FY23 net debt, adjusted for La Arena sale |
111 |
0.3 |
Implied equity value |
8,487 |
23.4 |
Source: Edison Investment Research
Exhibit 6: Financial summary
US$m |
2022 |
2023 |
2024e |
2025e |
||
Year end 31 December |
IFRS |
IFRS |
IFRS |
IFRS |
||
INCOME STATEMENT |
||||||
Revenue |
|
|
1,494.7 |
2,316.1 |
2,743.8 |
2,400.4 |
Cash production costs |
(1,094.4) |
(1,479.2) |
(1,602.6) |
(1,401.7) |
||
DD&A |
(316.0) |
(484.2) |
(491.9) |
(395.7) |
||
Royalties |
(35.9) |
(55.9) |
(64.3) |
(57.5) |
||
Gross Profit |
48.4 |
296.8 |
585.0 |
545.4 |
||
G&A |
(29.0) |
(61.4) |
(78.0) |
(75.0) |
||
Other operating costs |
(63.5) |
(96.8) |
(40.3) |
(38.3) |
||
Operating profit (before amort. and excepts.) |
|
|
(44.1) |
196.4 |
466.7 |
432.1 |
EBITDA |
|
|
272.0 |
680.6 |
958.6 |
827.9 |
Other operating expenses |
(6.4) |
3.4 |
0.0 |
0.0 |
||
Exceptionals |
(211.8) |
(103.9) |
0.0 |
0.0 |
||
Reported operating profit |
(262.3) |
38.1 |
466.7 |
432.1 |
||
Net Interest and other finance expense |
(22.5) |
(91.4) |
(92.0) |
(74.2) |
||
Profit Before Tax (norm) |
|
|
(73.0) |
108.4 |
374.7 |
358.0 |
Investment income (loss) |
(16.2) |
(5.5) |
(10.8) |
0.0 |
||
Profit Before Tax (reported) |
|
|
(301.0) |
(58.8) |
363.9 |
358.0 |
Reported tax |
(39.1) |
(46.1) |
(163.8) |
(161.1) |
||
Profit After Tax (norm) |
(112.1) |
62.3 |
211.0 |
196.9 |
||
Profit After Tax (reported) |
(340.1) |
(104.9) |
200.2 |
196.9 |
||
Minority interests |
1.7 |
(1.2) |
0.8 |
0.8 |
||
Net income (normalised) |
(113.8) |
63.5 |
210.2 |
196.1 |
||
Net income (reported) |
(341.8) |
(103.7) |
199.4 |
196.1 |
||
Average Number of Shares Outstanding (m) |
211 |
327 |
364 |
363 |
||
EPS - basic normalised ($) |
|
|
(0.54) |
0.19 |
0.58 |
0.54 |
EPS - normalised fully diluted ($) |
|
|
(0.54) |
0.19 |
0.58 |
0.54 |
EPS - basic reported ($) |
|
|
(1.62) |
(0.32) |
0.55 |
0.54 |
Dividend ($) |
0.45 |
0.41 |
0.40 |
0.40 |
||
BALANCE SHEET |
||||||
Fixed Assets |
|
|
2,444.1 |
5,823.1 |
5,456.7 |
5,339.5 |
Tangible assets |
2,226.4 |
5,675.1 |
5,308.7 |
5,191.5 |
||
Investments |
121.2 |
0.0 |
0.0 |
0.0 |
||
Other |
96.6 |
148.0 |
148.0 |
148.0 |
||
Current Assets |
|
|
804.4 |
1,389.9 |
1,745.5 |
1,863.4 |
Inventories |
471.6 |
711.6 |
746.4 |
710.4 |
||
Receivables |
136.6 |
138.0 |
142.8 |
131.5 |
||
Cash |
107.0 |
399.5 |
715.4 |
880.6 |
||
ST investments |
35.3 |
41.3 |
41.3 |
41.3 |
||
Other |
53.8 |
99.5 |
99.5 |
99.5 |
||
Current Liabilities |
|
|
(380.8) |
(624.2) |
(609.2) |
(587.0) |
Creditors |
(308.1) |
(498.0) |
(483.0) |
(460.8) |
||
Short term borrowings and leases |
(27.3) |
(52.4) |
(52.4) |
(52.4) |
||
Other |
(45.5) |
(73.8) |
(73.8) |
(73.8) |
||
Long Term Liabilities |
|
|
(666.0) |
(1,816.4) |
(1,786.4) |
(1,756.4) |
LT debt and leases |
(199.5) |
(749.2) |
(749.2) |
(749.2) |
||
Other long term liabilities |
(466.5) |
(1,067.2) |
(1,037.2) |
(1,007.2) |
||
Net Assets |
|
|
2,201.6 |
4,772.4 |
4,806.6 |
4,859.4 |
Minority interests |
(6.1) |
(11.8) |
(12.6) |
(13.4) |
||
Shareholders' equity |
|
|
2,195.5 |
4,760.6 |
4,794.0 |
4,846.0 |
CASH FLOW |
||||||
Operating Cash Flow |
(340.1) |
(104.9) |
200.2 |
196.9 |
||
D&A, exceptionals, other |
555.2 |
663.5 |
709.7 |
609.6 |
||
Working capital movement |
(42.0) |
68.9 |
(54.7) |
25.1 |
||
Tax |
(137.8) |
(149.4) |
(188.8) |
(191.1) |
||
Net Interest |
(3.4) |
(27.9) |
(54.1) |
(52.8) |
||
Net operating cash flow |
|
|
31.9 |
450.2 |
612.4 |
587.8 |
Capex |
(274.7) |
(379.0) |
(374.5) |
(277.5) |
||
Acquisitions/disposals |
8.7 |
759.3 |
0.0 |
0.0 |
||
Equity financing |
0.9 |
0.0 |
0.0 |
0.0 |
||
Dividends |
(94.7) |
(130.4) |
(145.5) |
(145.1) |
||
Other |
20.0 |
(15.3) |
223.5 |
0.0 |
||
Net Cash Flow |
(307.9) |
684.8 |
316.0 |
165.2 |
||
Opening net debt/(cash), including ST investments |
|
|
(289.4) |
84.5 |
360.7 |
44.8 |
FX and other |
(66.0) |
(961.0) |
0.0 |
0.0 |
||
Closing net debt/(cash) |
|
|
84.5 |
360.7 |
44.8 |
(120.4) |
Closing net debt/(cash), excluding ST investments |
119.9 |
402.0 |
86.1 |
(79.1) |
Source: Pan American Silver accounts, Edison Investment Research
|
|
Research: Financials
JDC Group (JDC) reported strong Q124 results. Revenue growth accelerated to 21.6% from 10% in FY23, driven by its Advisortech division (+22.6%). In terms of profitability, the EBITDA margin increased to 7.6% from 7.3% in Q123. JDC reiterated its FY24 revenue guidance of €205–220m, 24% y-o-y growth at the midpoint, partly driven by the acquisition of Top Ten Financial Network, which management expects to contribute more than €18m in revenues this year. EBITDA is also expected to increase to a guided range of €14.5–16.0m (FY23: €11.7m). We make no changes to our estimates. Our DCF provides a valuation of €34.0/share.