Last close As at 05/08/2026
—
— 0.00 (0.00%)
Market capitalisation
—
Research: Financials
Cenkos Securities maintained its record of unbroken profitability in 2016 despite tougher markets. The business model, based on relatively low basic remuneration and variable team rewards transparently linked to results, has proved resilient across the cycle and encourages an entrepreneurial approach, attracting clients and mandates, increasingly for substantial transactions. The level of profit is subject to market fluctuations but the current valuation appears to reflect cautious assumptions given the group’s historical performance.
Cenkos Securities |
A flexible model that rewards innovation |
2016 results |
Financial services |
3 April 2017 |
Share price performance
Business description
Next event
Analysts
Cenkos Securities is a research client of Edison Investment Research Limited |
|||||||||||||||||||||||||||||||||||||||||||||||
Cenkos Securities maintained its record of unbroken profitability in 2016 despite tougher markets. The business model, based on relatively low basic remuneration and variable team rewards transparently linked to results, has proved resilient across the cycle and encourages an entrepreneurial approach, attracting clients and mandates, increasingly for substantial transactions. The level of profit is subject to market fluctuations but the current valuation appears to reflect cautious assumptions given the group’s historical performance.
Year end |
Revenue (£m) |
PBT |
EPS |
DPS |
P/E |
Yield |
12/14 |
88.5 |
27.0 |
35.2 |
17.0 |
2.6 |
18.4 |
12/15 |
76.5 |
19.9 |
27.2 |
14.0 |
3.4 |
15.1 |
12/16 |
43.7 |
4.4 |
4.7 |
6.0 |
19.7 |
6.5 |
12/17e |
52.0 |
7.8 |
11.2 |
11.0 |
10.0 |
11.9 |
Note: All figures as reported.
2016 results
Despite a recovery in H2, full-year revenues declined noticeably (43%) from the high levels of 2014/15 in quieter markets and in the absence of the very large (£1bn plus) transactions that characterised those years. Excluding the BCA transaction from 2015, the revenue decline of 12% broadly matched the weaker trend in AIM equity issuance, which was 13% lower in the year at £4.8bn (with Cenkos taking a 13% market share). In response to lower revenues, costs were well controlled with performance-related pay reducing and non-staff costs falling slightly. Pre-tax profits were £4.4m (2015: £19.9m), ROE 10% and profits were again fully distributed (6p dividend).
Outlook
Markets have maintained a positive tone in recent months although as always uncertainties abound (Brexit negotiations, new US administration) both from an economic and political perspective. Cenkos describes its pipeline as encouraging with the potential to deliver a flow of transactions as opportunities present themselves. The number and range of clients provides diversity and Cenkos continues to demonstrate its ability to carry out larger deals following the BCA and AA fund-raisings in 2015 and 2014, respectively. In November 2016, it led the £350m Civitas Social Housing IPO and it was announced recently that Cenkos will be nomad and sole broker in the intended flotation of Eddie Stobart, with a speculated market valuation of more than £550m (FT, 23 March 2017).
Valuation: Strong potential from return to trend ROE
Applying our ROE/COE model assumptions suggests the market is assuming a sustainable return on equity of 14.5%. Although 10% last year, the average since 2008 is 24% (high of 60%, low of 10%) and we assume 24% (was 25%) giving an indicative value of 189p (was 212p). The sensitivity of near-term earnings to market trends and of the valuation model to the return on equity assumption are points to note when considering valuation.
Company description: Flexibility and entrepreneurship
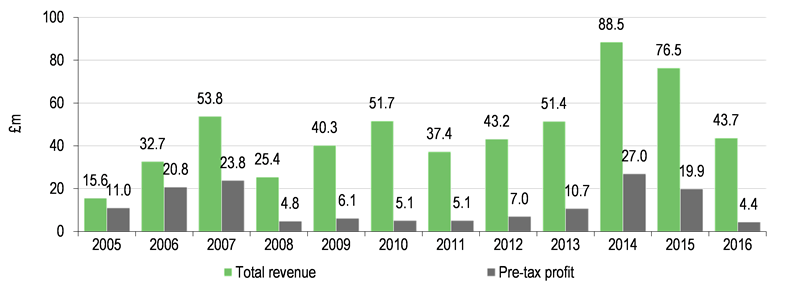
Cenkos is an independent, specialist institutional securities group with a focus on small- and mid-cap growth companies and investment companies. It was founded in 2004 and within the sector stands out for having been profitable in each year since (Exhibit 1).
Cenkos’s main business is institutional stockbroking, with services offered including corporate finance, corporate broking, research and execution. It is well diversified across sectors with a number of successful niches. It enjoys strong institutional relationships as evidenced by its fund-raising track record (£16bn raised since 2005, mainly acting as sole broker). It employs a total of approximately 120 staff across the London head office as well as offices in Edinburgh and Liverpool and a newly established subsidiary in Singapore, Cenkos Securities Asia.
Cenkos operates a business model that is characterised by flexible remuneration and other costs with relatively low basic remuneration and variable team rewards transparently linked to the net contribution made. The culture is client focused and entrepreneurial and the company aims to maintain experienced and stable teams who are aligned with the long-term growth objectives of the group.
|
Exhibit 1: Consistently profitable since formation |
|
|
Source: Cenkos Securities |
2016 results
■
Reflecting quieter equity markets, 2016 revenues, excluding the impact of one very large deal transacted in 2015 (a £1.029bn fund-raise for BCA Marketplace plc), were 12% lower at £43.7m. The overall revenue decline compared with the £76.5m reported revenues for 2015, including the impact of BCA, was 43%. The second half of the year showed a marked recovery with revenues of £28.4m. Reduced performance-related pay partly offset the fall in revenue but operational gearing extended the decline in PBT to 78% or to £4.4m, compared with £19.9m in 2015.
■
Funds raised on behalf of clients were more than £1.3bn (2015: £3.1bn), following the weaker trend in overall funds raised by AIM companies. AIM fund-raisings were down 13% to £4.8bn and Cenkos helped clients to raise 13% (2015: 17%) of this. The decline in Corporate Finance & Placing Fee revenue (down c 50% to £29.7m) was more muted than the decline in funds raised, benefiting from the mix of business and a lower average size of deals in particular.
■
Market making revenues of £3.5m (2015: £5.2m) reflect market activity and continued limits on the amount of capital committed so as to limit market exposure. This appears to have been achieved without adversely affecting service levels with Cenkos maintaining a top three market share position in trading activity for 73% of clients’ stock and the top market share in 48%.
■
Corporate Broking, Research & Commission revenues were robust at £10.5m (2015: £11.2m), although reflecting the impact of lower client numbers. The corporate client base (nomad, sponsor, broker, financial adviser appointments) decreased from 124 at the end of 2015 to 116 following the acquisition of a number of clients in M&A activity during the year and active client management that recognised that some smaller clients were better served by other nomads. Pressure on commission revenues continues, although this was offset in 2016 by new hires.
■
As noted above, performance related pay followed revenues lower, but was offset by continued investment in the business directed at facilitating the execution of larger and more complex deals going forward, the opening of the new office in Singapore, and adapting to regulatory changes such as MiFID II and MAR. The £0.5m FCA fine (in relation to Quindell, now known as Watchstone) was also expensed along with legal costs incurred in the year (and prior years) and expected insurance recovery was accrued. The recurring cost to income ratio was 90.1% (2015: 74.2%), a similar level to 2010.
■
The effective tax rate was unusually high at 42.2% (basic corporate tax rate 20%). The main reason is a non-cash decline in the value of the deferred tax asset that relates to the expected future cost of the CAP options, which has followed the share price lower. There was a much smaller impact from non-tax deductibility of the FCA fine.
■
Basic EPS fell to 4.7p (2015: 27.2p) and the ROE was 10% (2015: 43%) on average equity Closing NAV per share was 49.8p. A final dividend of 5p has been declared, taking the total for the year to 6p such that Cenkos continues to effectively distribute all of its earnings on a rolling basis.
■
The cash balance at year end was £23.8m, a £9.3m reduction from the end of 2015. Although reported earnings and dividends paid during the year were broadly in line, corporation tax payments were ahead of the annual charge and there was a £6.1m increase in trade & other receivables that mainly reflects equities trading in the course of settlement. As at the end of 2016 Cenkos had a £9.8m surplus of capital resources in excess of its Pillar 1 requirement. The main driver of capital requirement is operational risk, which is driven by the three-year rolling (audited) revenues, which still include the contributions to 2014 and 2015 revenues from large transactions in those years.
Market background and outlook
In this section we briefly review the trends in UK equity issuance, stock market level and trading volumes that have an influence on Cenkos’s performance. Given that Corporate Finance & Placing revenues typically account for around three-quarters of total revenues for Cenkos (75% on average in the past three years and 69% in the quieter 2016 year), we would particularly emphasise the importance of equity issuance volumes and stock market performance.
Market background – mixed
Trends in new and follow on issuance on the AIM and LSE Main markets have been mixed over the last year. Cenkos has a strong position on AIM (it has averaged a 15% share of all AIM fund-raisings in the past three years and was 13% in 2016). Ahead of the financial crisis new issuance on AIM peaked at over £16bn in 2007, followed by a dramatic slowdown in the volume of IPOs. Subsequently there was a recovery, but levels remained comparatively muted. In 2016 (Exhibit 2) new issuance was held back in part by uncertainty surrounding the Brexit vote but further issuance was more robust, notably in the second half.
The Main Market (Exhibit 3) has shown a broadly similar pattern but with a stronger second half for initial fund-raisings as well as follow-on issues.
|
Exhibit 2: LSE AIM issuance |
Exhibit 3: LSE Main Market issuance |
|
|
|
Source: London Stock Exchange |
|
Exhibit 2: LSE AIM issuance |
|
|
Source: London Stock Exchange |
|
Exhibit 3: LSE Main Market issuance |
|
|
Source: London Stock Exchange |
Turning to mergers and acquisitions (M&A) activity, the value of UK transactions collected by the Office for National Statistics saw a sharp increase in 2016 with the total value (Exhibit 4) more than three times the prior year, but this was primarily the result of a few very high value inward transactions. Looking at domestic and outward deals alone there was a strong rise of 25%, but the value was within the range seen in recent years.
|
Exhibit 4: UK merger and acquisition activity |
|
|
Source: Office for National Statistics |
While the market environment has an influence on the level of transactions of an individual firm, the incidence of activity among clients and the success of the Cenkos team in winning business are important. Exhibit 5 shows selected transaction highlights reported by the group. In 2016 Cenkos raised £1,325m, compared with £3,068m in 2015, which benefited from the £1,029m BCA Marketplace transaction.
Exhibit 5: Highlights of completed transactions for 2016 and 2017 year to date
2016 |
2017 |
|||||||||||||
February |
GVC Holdings Plc |
Fundraise/acq |
£150m |
Feb |
Kromek Group |
Placing |
£21m |
|||||||
Imperial Innovations |
Placing |
£100m |
Mercia Technologies Plc |
Placing |
£40m |
|||||||||
GCP Student Living |
Placing |
£19m |
GCP |
C share issue |
£79m |
|||||||||
March |
FairFX |
Placing |
£5m |
Cello Group Plc |
Placing |
£15m |
||||||||
April |
Medaphor |
Placing |
£3.2m |
UP Global Sourcing Hldg Plc |
IPO |
£53m |
||||||||
Salt Lake Potash Ltd |
Placing |
£1.7m |
March |
Callogen Solutions |
Placing |
£8m |
||||||||
88 Energy Ltd |
Placing |
£4.6m |
88 Energy Ltd |
Placing |
A$17m |
|||||||||
May |
Hurricane Energy |
Placing |
£52m |
Totally Plc |
Placing |
£18m |
||||||||
Corero |
Placing |
£8m |
Frontier IP Group Plc |
Placing |
£3m |
|||||||||
GCP Project Finance |
Placing |
£44m |
||||||||||||
Angle |
Placing |
£10m |
||||||||||||
June |
Rotala |
Placing |
£3.5m |
|||||||||||
Comptoir |
IPO |
£16m |
||||||||||||
Plexus |
Fundraise |
£10m |
||||||||||||
July |
Providence Resources |
Placing |
£52.5m |
|||||||||||
International Greetings |
Placing |
£5.3m |
||||||||||||
CloudCall |
Placing |
£4.0m |
||||||||||||
August |
Jaywing |
Placing |
£3.0m |
|||||||||||
Restore |
Placing |
£35.0m |
||||||||||||
September |
Marlowe Plc |
Placing |
£6m |
|||||||||||
November |
Filta |
IPO |
£6m |
|||||||||||
Hurricane Energy |
Placing |
£47m |
||||||||||||
GCP Asset Backed Income Fund |
Placing |
£16m |
||||||||||||
Civitas Social Housing |
IPO |
£350m |
||||||||||||
Inspiration Healthcare |
Placing |
£4m |
||||||||||||
December |
Creo Medical |
IPO |
£20m |
|||||||||||
Tasty Plc |
Placing |
£9m |
||||||||||||
Marlowe Plc |
Placing |
£10m |
||||||||||||
RedT Energy |
Placing |
£12.7m |
||||||||||||
Source: Cenkos Securities website
Equity returns as represented by the FTSE All-Share, FTSE AIM All-Share and FTSE Small Cap indices are shown in Exhibit 6. The strength of the rebound post Brexit vote and support from the ‘Trump bounce’ are evident. The chart also shows outperformance by small caps over the period and significant relative weakness of the AIM Index, explained in part by weakness in commodity stocks within the index.
As Exhibit 7 shows, there has been a moderate increase in the average daily value of trade on the LSE order book, although the increase in 2016, at 3.6%, was lower than in previous years.
|
Exhibit 6: FTSE AIM, All-Share and Small Cap indices |
Exhibit 7: Average daily value traded LSE order book |
|
|
|
Source: Thomson Datastream. Note: Total return series. |
Source: London Stock Exchange |
|
Exhibit 6: FTSE AIM, All-Share and Small Cap indices |
|
|
Source: Thomson Datastream. Note: Total return series. |
|
Exhibit 7: Average daily value traded LSE order book |
|
|
Source: London Stock Exchange |
Uncertainties but positive signals too
Looking ahead, newsflow on the terms of Brexit could cause fluctuations in market sentiment that would in turn have an impact on market level and corporate activity. However, while this will be a factor, the resilience shown by the UK economy and the fact that market levels are higher than might have been expected at the time of the vote creates a relatively positive backdrop for corporate activity including M&A, IPOs and follow-on issuance.
Cenkos management themselves note that there continues to be good institutional demand to fund high-quality companies and ideas and that Cenkos’s pipeline is encouraging.
Financials
2016 revenues of £43.7m were a little below our £46.0m assumption but staff costs were lower. PBT of £4.4m was ahead of our £4.1m estimate, but this was offset by the unusually high tax charge related to non-cash options related to the change in the value of the deferred tax asset, triggered by the share price decline.
Looking forward, although we are faced with the task of forecasting a specific financial outcome for Cenkos, it is in the nature of the industry in which it operates that over-reliance should not be placed on single point forecasts. For this same reason we restrict our estimates to the current year only. As noted above, revenue growth was stronger in H216 than in H1 and management describes the current pipeline of business as encouraging. Taking this into account, along with the market environment that we have described above, we have chosen to base our current year (2017) earnings forecast on estimated revenues of £52m but note that the timing of transactions, particularly large transactions, can make a material difference to the outturn in any given year, irrespective of the general market environment.
Our assumption of £52m for revenues, excluding any major transactions, is below the five-year average for reported revenue (a little over £60m) and a little ahead of the five-year average excluding the revenues earned on large AA and BCA Marketplace transactions in 2014 and 2015 (c £49m). Those transactions underline Cenkos’s ability to undertake larger transactions, and on a smaller scale but still significant is the November 2016 £350m Civitas Social Housing IPO. We note also that Cenkos is leading on the intention to float Eddie Stobart, with press speculation that the business could achieve a stock market valuation in excess of £550m (FT, 23 March 2017).
We have made no particular assumption about the make-up of revenues but stress the importance of deal flow and note that Corporate Finance & Placing fees have averaged 75% of all revenues in the past two years. Market Making activity represents an average 7.5% of revenues in the past two years and Corporate Broking, Research & Commission the remaining 17.5%. As noted above, the approach of MiFID II (1 January 2018 introduction) and the unbundling of research from dealing commissions in particular are maintaining pressure on secondary broking commissions. Although not separately identified, we believe that secondary brokerage is typically in the range of 5-10% of revenues (depending on the strength of other revenue streams in any one year) and on this basis Cenkos is less dependent on this sort of income than some competitors. In 2016, commission rate pressures were offset by new hiring and we believe that the Cenkos remuneration model, which transparently rewards analysts on their success in generating revenues, should continue to position it as an attractive employer to quality staff, in turn more likely to attract discretionary commission from clients.
We have assumed 2017 non-staff costs at £10.0m (2016: £9.2m), which allows for continuing investment. Staff costs (including bonus in lieu of dividend or BILD costs relating to the 8.8m Compensatory Award Plan 2009 options still outstanding) are forecast to decline as a share of revenues and the overall cost-income ratio to improve to 85.0% (2016: 90.1%). We assume a full payout of earnings or an 11p dividend for the year.
Valuation
Our valuation assessment includes peer valuations, a historical comparison of Cenkos’s own price to book value over time and the sensitivity of the output of a ROE/COE model to assumptions.
The peer valuation comparison (Exhibit 8) highlights the relatively small number of listed independent brokers that have survived in the UK market. Given significant differences between the companies, including differences in their business models, the noticeable variation in their sizes, as well as the wide spread of returns they currently generate in relation to the valuation multiples they command, we recommend that this data be treated with caution. What is not shown in the exhibit but highlighted above is Cenkos’s unbroken track record of profitability since its formation in 2004. What can be seen is that it is among the few companies reporting profits in their most recent results, and while its ROE reduced in 2016, its strong capital position and full distribution of profits means that its yield is currently the highest in the group
Exhibit 8: Quoted UK broker comparison (30 March 2017)
Price |
Market cap |
Last reported P/E |
Yield |
Price to book |
ROE |
|
Cenkos |
94.0 |
53.3 |
20.0 |
6.4 |
1.9 |
10.0 |
Arden |
34.5 |
6.7 |
0.0 |
1.0 |
-6.3 |
|
Numis |
246.3 |
279.4 |
10.5 |
4.9 |
2.3 |
21.6 |
Panmure Gordon |
98.0 |
15.2 |
0.0 |
0.9 |
-66.2 |
|
Shore Capital |
247.5 |
53.9 |
41.3 |
2.0 |
0.9 |
2.2 |
WH Ireland |
129.0 |
35.5 |
0.0 |
2.9 |
-22.3 |
|
Average |
23.9 |
2.2 |
1.6 |
-10.2 |
Source: Bloomberg, Edison Investment Research. Prices as at 30 March 3017. Note: P/E ratio, price to book, yield and ROE are based on last reported figures.
Exhibit 9 illustrates how Cenkos’s price to book ratio has moved since the end of 2006. Over the past 12 months this ratio moved from being towards the top of the long-term range to near the bottom. Despite an increase in the share price over the past three months, the current price to book remains just below 2x and noticeably below the long-term average of 2.6x.
|
Exhibit 9: Historical price to book ratio for Cenkos |
|
|
Source: Thomson Datastream, Edison Investment Research |
Exhibit 10 combines the ROEs and price to book ratios for our peer group in a scatter diagram. The results yield a mixed picture that reflects the current low profitability and strategic challenges facing some of the group together with an overlay of corporate action. Panmure Gordon recently agreed to a take-over approach by Atlas Merchant Capital (the private equity vehicle of Bob Diamond) and QInvest, the Qatari investment bank that already owned a 43% stake. In September 2016 WH Ireland confirmed that Kuwaiti European Holdings Group (KEH) had taken a 23% stake in the company. What is clear from the table is that the relatively high price to book ratio commanded by Cenkos is supported by an above-average ROE.
|
Exhibit 10: Comparing return on equity and price to book ratio |
|
|
Source: Bloomberg, Edison Investment Research |
We show the output from a simple ROE/COE model adjusted for different ROE and growth assumptions in Exhibit 11 (other assumptions include a cost of equity of 10% and a book value of 49.8p, as at the end of 2016). As for any broking/investment banking business, the potential volatility of earnings makes it difficult to assign a sustainable ROE, but for our central assumption we take a return of 24%. This is the average between 2008 and 2016, a period that includes global financial crisis-affected years as well as very strong returns in 2014 and 2015. We had previously assumed a sustainable ROE of 25% compared with an average of 29% between the years 2008 and 2015. Taking our 24% ROE assumption with growth of 5% would point to a valuation of 189p (previously 212p). Using the same cost of equity, growth and book value assumptions, the ROE/COE suggests that the current share price implies an assumed return on equity of 14.5% for Cenkos: cautious in view of its recent performance and on a longer view, but perhaps understandable in view of elevated recent market volatility.
Exhibit 11: ROE/COE valuation output variations (value per share, p)
Return on equity |
Growth rate |
||||
4.0% |
4.5% |
5.0% |
5.5% |
6.0% |
|
15% |
91 |
95 |
100 |
105 |
112 |
20% |
133 |
140 |
149 |
160 |
174 |
24% |
166 |
176 |
189 |
205 |
224 |
30% |
216 |
231 |
249 |
271 |
299 |
35% |
257 |
276 |
299 |
326 |
361 |
Source: Edison Investment Research
As noted earlier, Cenkos has been effectively distributing all its earnings in the form of dividends and share buybacks. This has contributed to the relatively high return on capital, which in turn supports further high dividend payments in periods of strong trading performance. Our estimates for 2017 assume substantially full payout of earnings in the current year or a dividend per share of 11p that would provide a yield of more than 10% at the current share price.
Exhibit 12 shows a price performance comparison for the UK-listed brokers. Cenkos has fared better than average over the past three months/the year to date, but has been a noticeable laggard over one year and from its 12-month high. 2016 revenues and profits were lower than we had hoped for a year ago and the FCA investigation and subsequent fine regarding Quindell/Watchstone may have had a negative impact on sentiment. The recent share price performances of Panmure Gordon and WH Ireland have been influenced by the corporate developments referred to above.
Exhibit 12: Share price performance comparison
(% change) |
1 month |
3 months |
1 year |
YTD |
From 12m high |
Cenkos |
-8.7 |
30.6 |
-31.4 |
30.6 |
-36.9 |
Arden |
-1.4 |
3.0 |
15.0 |
3.0 |
-2.8 |
Numis |
-7.8 |
0.2 |
22.2 |
0.2 |
-15.2 |
Panmure Gordon |
66.1 |
70.4 |
60.7 |
70.4 |
-3.4 |
Shore Capital |
1.0 |
10.0 |
-27.2 |
10.0 |
-29.8 |
WH Ireland |
3.6 |
5.7 |
39.5 |
5.7 |
-10.1 |
Average |
8.8 |
20.0 |
13.1 |
20.0 |
-16.4 |
Source: Bloomberg. Note: Prices as at 30 March 2017.
Exhibit 13: Financial summary
£000s |
2014 |
2015 |
2016 |
2017e |
||
Year end 31 December |
||||||
PROFIT & LOSS |
|
|||||
Revenue |
|
|
88,516 |
76,513 |
43,745 |
52,000 |
Cost of Sales (excl. amortisation and depreciation) |
(61,318) |
(56,510) |
(39,244) |
(44,015) |
||
EBITDA |
|
|
27,198 |
20,003 |
4,501 |
7,985 |
Depreciation |
|
|
(386) |
(241) |
(182) |
(200) |
Amortisation |
0 |
0 |
0 |
1 |
||
Operating Profit (before amort. and except.) |
|
26,812 |
19,762 |
4,319 |
7,786 |
|
Exceptionals |
0 |
0 |
0 |
1 |
||
Non-recurring items |
0 |
0 |
0 |
0 |
||
Investment revenues |
160 |
134 |
83 |
50 |
||
Profit Before Tax |
|
|
26,972 |
19,896 |
4,402 |
7,836 |
Tax |
(5,644) |
(4,525) |
(1,858) |
(1,724) |
||
Profit After Tax |
|
|
21,328 |
15,371 |
2,544 |
6,112 |
Minority Interests |
0 |
0 |
0 |
0 |
||
Average number of shares outstanding (m) |
60.5 |
56.5 |
54.7 |
54.6 |
||
EPS - normalised fully diluted (p) |
|
|
35.2 |
27.2 |
4.7 |
11.2 |
Fully diluted EPS (p) |
|
|
33.5 |
26.8 |
4.6 |
11.1 |
Dividend per share (p) |
17.00 |
14.00 |
6.00 |
11.00 |
||
NAV per share (p) |
0.65 |
0.53 |
0.50 |
0.52 |
||
ROE (%) |
60% |
43% |
10% |
22% |
||
Cost/income ratio |
69.7% |
74.2% |
90.1% |
85.0% |
||
Staff costs/Revenue |
64.8% |
58.8% |
60.1% |
69.2% |
||
BALANCE SHEET |
||||||
Non-current assets |
|
|
2,463 |
1,626 |
625 |
675 |
Intangibles and goodwill |
0 |
0 |
0 |
0 |
||
Property, plant and equipment |
421 |
296 |
389 |
439 |
||
Other non-current assets |
2,042 |
1,330 |
236 |
236 |
||
Current assets |
|
|
63,392 |
64,725 |
62,692 |
63,792 |
Other current assets inc Investments - long positions |
10,014 |
12,706 |
13,811 |
13,811 |
||
Cash |
32,932 |
33,106 |
23,795 |
27,421 |
||
Debtors and other |
20,446 |
18,913 |
25,086 |
22,560 |
||
Current liabilities |
|
|
(26,294) |
(37,432) |
(35,254) |
(35,254) |
Other current liabilities inc short positions |
(2,711) |
(2,551) |
(2,694) |
(2,694) |
||
Short-term borrowings |
0 |
0 |
0 |
0 |
||
Other current liabilities |
(23,583) |
(34,881) |
(32,560) |
(32,560) |
||
Non-current liabilities |
|
|
0 |
(351) |
(880) |
(880) |
Long-term borrowings |
0 |
0 |
0 |
0 |
||
Other long-term liabilities |
0 |
(351) |
(880) |
(880) |
||
Net assets |
|
|
39,561 |
28,568 |
27,183 |
28,333 |
CASH FLOW |
||||||
Operating Cash Flow |
|
|
24,137 |
15,538 |
(465) |
8,486 |
Working capital and other items |
(7,344) |
16,184 |
(1,387) |
2,526 |
||
Tax paid |
(4,815) |
(5,049) |
(2,533) |
(1,724) |
||
Net cash from operating items |
|
|
11,978 |
26,673 |
(4,385) |
9,288 |
Fixed asset investment |
(420) |
(174) |
(272) |
(250) |
||
Acquisitions/disposals |
0 |
0 |
0 |
0 |
||
Other investing activities |
173 |
191 |
93 |
50 |
||
Share (purchase)/issuance |
244 |
(16,823) |
(438) |
0 |
||
Ordinary dividends |
(9,386) |
(9,740) |
(4,367) |
(5,461) |
||
Other financing |
0 |
47 |
58 |
0 |
||
Other |
0 |
0 |
0 |
0 |
||
Net cash flow |
2,589 |
174 |
(9,311) |
3,626 |
||
Opening net (debt)/cash |
|
|
30,343 |
32,932 |
33,106 |
23,795 |
FX |
0 |
0 |
0 |
0 |
||
Closing net (debt)/cash |
|
|
32,932 |
33,106 |
23,795 |
27,421 |
Source: Cenkos Securities accounts, Edison Investment Research
|
|
Celyad has provided an update on its trial plans and announced 2016 preliminary results. The THINK Phase Ib trial is a major expansion of CAR therapy with five solid tumors plus AML and MM being explored. The THINK dose escalation results are expected in Q417 with six-month efficacy results possible from H218. The colorectal, SHRINK trial starting in Q2 will explore combining NKR-2 therapy with chemotherapy. The Q3 LINK trial will explore direct delivery of NKR-2 cells to metastatic liver tumors. The move into solid tumors puts Celyad in a leading position. Our interim indicative value remains at $50 per share. Cash remains strong at $91.7m.