Last close As at 05/08/2026
GBP10.22
— 0.00 (0.00%)
Market capitalisation
GBP954m
Research: Investment Companies
Murray Income Trust (MUT) aims to provide a high and growing income combined with capital growth, through investment in a diversified portfolio of mainly UK equities. It has achieved these objectives both recently and longer term, delivering 46 consecutive years of increasing annual dividends, and outperforming its benchmark (a broad UK stock market index) and most of its peers during the recent market turbulence and over the long term. Manager Charles Luke’s approach is based on identifying dependable stocks, which have the capacity to weather downturns, and on diversification across income, capital and sector. He focuses on high-quality companies, including mid-caps, which he believes produce less volatile income streams and are better placed to navigate uncertain times and capitalise on opportunities to create value over the longer term.
Written by
Murray Income Trust |
Quality stocks prove a safe haven in tough times |
Investment trusts |
12 May 2020 |
Share price/discount performance
Three-year performance vs index
Gearing
Analysts
|
|||||||||||||||||||||||||||||||||||||||||||||||||||||||||||||||||||||||||||||||||||||||||
Murray Income Trust (MUT) aims to provide a high and growing income combined with capital growth, through investment in a diversified portfolio of mainly UK equities. It has achieved these objectives both recently and longer term, delivering 46 consecutive years of increasing annual dividends, and outperforming its benchmark (a broad UK stock market index) and most of its peers during the recent market turbulence and over the long term. Manager Charles Luke’s approach is based on identifying dependable stocks, which have the capacity to weather downturns, and on diversification across income, capital and sector. He focuses on high-quality companies, including mid-caps, which he believes produce less volatile income streams and are better placed to navigate uncertain times and capitalise on opportunities to create value over the longer term.
|
MUT delivering outperformance (NAV TR relative to UK index) |
|
|
Source: Refinitiv, Edison Investment Research |
The market opportunity
The UK market was out of favour with global investors before the coronavirus crisis, and since the sell-off it has cheapened in absolute as well as relative terms. There are many undervalued, quality UK companies well placed to weather the current crisis and prosper as the economy recovers. There is particular value to be found among less well researched mid-cap stocks, which may present attractive opportunities for long-term investors.
Why consider investing in Murray Income Trust?
■
A high-quality portfolio able to weather market turbulence.
■
Diversification by income, capital and sector.
■
Excellent performance record, recently and over the long term.
■
An attractive, resilient dividend yield and a 46-year record of annual dividend growth.
Discount narrows and dividend yield rises
As at 5 May 2020, MUT’s shares traded at a 6.7% discount to cum-income NAV. This is wider than in recent times – it nudged into premium territory briefly in early March – but narrower than the average levels of 7.0% and 7.3% over the past three and five years respectively (see Exhibit 10). The discount has been in a broadly narrowing trend since mid-2018. MUT’s dividend yield currently stands at 4.8%.
Exhibit 1: Trust at a glance
Investment objective and fund background |
Recent developments |
||||||||||||||||||||||||||||||||||||||||||||||||||||||||||||||||||||||
Murray Income Trust (MUT) aims for a high and growing income combined with capital growth through investment in a portfolio principally of UK equities. Its investment policy is to invest in companies that have potential for real earnings and dividend growth, while also providing an above-average portfolio yield. The emphasis is on the management of risk and the absolute return from the portfolio. MUT measures its performance versus the broad UK stock market. |
■ 17 Feb 2020: Results for six months to 31 Dec 2020 showed TR of +7.7% (share price basis) and +9.0% (NAV basis), outperforming benchmark return of +5.5%. ■ November 2019: Declaration of three interim dividends of 8.25p per share for the year ending June 2020, to be paid on 20 Dec 2019, 20 March 2020 and 19 June 2020. Fourth interim dividend, announced in August 2020, will be at least 8.25p. |
||||||||||||||||||||||||||||||||||||||||||||||||||||||||||||||||||||||
Forthcoming |
Capital structure |
Fund details |
|||||||||||||||||||||||||||||||||||||||||||||||||||||||||||||||||||||
AGM |
November 2020 |
Ongoing charges |
0.65% |
Group |
Aberdeen Standard Investments |
||||||||||||||||||||||||||||||||||||||||||||||||||||||||||||||||||
Annual results |
September 2020 |
Net gearing |
7.1% |
Managers |
Charles Luke (lead), Iain Pyle (deputy) |
||||||||||||||||||||||||||||||||||||||||||||||||||||||||||||||||||
Year end |
30 June |
Annual mgmt fee |
Tiered (see page 8) |
Address |
1 George Street, |
||||||||||||||||||||||||||||||||||||||||||||||||||||||||||||||||||
Dividend paid |
Quarterly |
Performance fee |
None |
||||||||||||||||||||||||||||||||||||||||||||||||||||||||||||||||||||
Launch date |
1923 |
Trust life |
Indefinite |
Phone |
0808 500 0040 (retail)/0131 222 1863 |
||||||||||||||||||||||||||||||||||||||||||||||||||||||||||||||||||
Continuation vote |
No |
Loan facilities |
£40m loan notes/£20m bank loan |
Website |
|||||||||||||||||||||||||||||||||||||||||||||||||||||||||||||||||||
Dividend policy and history (financial years) |
Share buyback policy and history (financial years) |
||||||||||||||||||||||||||||||||||||||||||||||||||||||||||||||||||||||
MUT’s board aims to increase the total dividend each year. Four interim dividends are normally paid each year in March, June, September and December. |
Renewed annually, MUT’s board has the authority to allot shares up to the equivalent of 5% of the share capital, and buy back up to 14.99% of shares, in order to manage a premium or a discount. |
||||||||||||||||||||||||||||||||||||||||||||||||||||||||||||||||||||||
|
|
||||||||||||||||||||||||||||||||||||||||||||||||||||||||||||||||||||||
Shareholder base (as at 29 February 2020) |
Portfolio equity exposure by geography (as at 30 March 2020) |
||||||||||||||||||||||||||||||||||||||||||||||||||||||||||||||||||||||
|
|
||||||||||||||||||||||||||||||||||||||||||||||||||||||||||||||||||||||
Top 10 holdings (as at 31 March 2020) |
|||||||||||||||||||||||||||||||||||||||||||||||||||||||||||||||||||||||
|
|||||||||||||||||||||||||||||||||||||||||||||||||||||||||||||||||||||||
Source: Murray Income Trust, Edison Investment Research, Bloomberg, Morningstar. Note: *N/A where not in end-March 2019 top 10.
Market outlook: Low valuations may offer opportunity
A global recession seems inevitable in the wake of the coronavirus pandemic. Even once major economies emerge from lockdown, social distancing measures will remain a heavy burden for many businesses until a vaccine is available. Additionally, summer holiday and business travel plans will likely be curtailed. Many businesses, especially small ones and those burdened with debt, will not survive protracted restraints on trading. For UK investors, there are also significant uncertainties related to trade relations with the EU and US. Post-Brexit negotiations have been delayed by the onset of the virus, and the forthcoming presidential election will hamper British efforts to reach a rapid trade agreement with the US.
None of this bodes well for the near-term outlook for UK equity markets. However, valuations on quality UK stocks were relatively low before the coronavirus crisis, due to investor outflows since the 2016 EU referendum. They are even cheaper now, in absolute as well as relative terms. This arguably represents a great opportunity for long-term investors to purchase undervalued, quality UK stocks. These are the companies best placed to survive current challenges and prosper once the global economy eventually moves into recovery.
|
Exhibit 2: Market performance and valuation |
|
Performance vs index |
Forward P/E and P/E premium (discount) to World Index |
|
|
|
Source: Refinitiv, Edison Investment Research |
|
Fund profile: Aiming for high income and growth
Founded in Scotland in 1923, MUT has been part of the Aberdeen Asset Management (AAM, now Aberdeen Standard Investments, or ASI) stable since 2000. Charles Luke has been the trust’s portfolio manager since 2006. His deputy, Iain Pyle, joined the team in 2018. The Aberdeen/ Standard Life merger in 2017 saw the UK element of AAM’s Pan-European equity team (of which Luke was a member) merge with SLI’s UK team to create ASI’s 16-strong UK equity team.
MUT aims to realise a high and growing income, combined with capital growth, through investment in a diversified portfolio of mainly UK equities, although up to 20% may be invested in non-UK stocks. The trust has a longer-term investment focus and targets good-quality, well managed companies, with attractive valuations and strong ESG characteristics. Option writing on a modest scale is used to enhance portfolio income and diversification.
MUT has a 46-year record of annual dividend growth. It is a member of the Association of Investment Companies’ UK Equity Income sector and uses a broad UK stock market index as its benchmark. For comparison purposes in this note, we are using the CBOE UK All Companies index. Performance is also measured against peers in the UK Equity Income sector. Gearing of up to £60m (c 11.5% of net assets) is accessible via long-term, fixed-rate borrowings and a flexible multi-currency bank loan. Net gearing as at end-March 2020 was 7.1%.
The fund managers: Charles Luke and Iain Pyle
The manager’s view: Quality the key to weathering crisis
Manager Charles Luke views the coronavirus crisis as ‘a highly unusual episode for equity markets’, given that it represents a combination of a demand and supply shock leading to significant concerns about the financial viability of companies. However, he believes that in general, dependable companies with robust balance sheets and strong business models are best placed to trade their way through this very challenging environment. ‘These are the types of companies that we focus on,’ he says. Luke believes that while it is impossible to mitigate the impact of market falls entirely, MUT’s careful approach to capital allocation has held the portfolio in relatively good stead through this very challenging period.
Luke stresses that the team continues to closely monitor the financial strength of its holdings, with an emphasis on operational and financial leverage and cash generation. He also places particular value on remaining in close dialogue with the companies MUT holds, to understand their thoughts and plans. Luke says he is watching the market closely for opportunities to add to holdings where the team believes the market reaction has been too severe.
Looking ahead, the manager sees the evolution of the health crisis as key – news of a vaccine would be positive for investor sentiment, while evidence that the virus was mutating and becoming more virulent would trigger renewed market weakness. The team is also closely watching economic developments, in particular the impact of COVID-19 on the US economy. Luke does not share the concerns of some investors that the recent, very aggressive fiscal and monetary stimulus implemented by western governments will lay the basis for future inflation.
While the health and economic crises run their course, Luke says he is happy with the current positioning of the portfolio and does not intend to make significant changes. ‘These are difficult times for all, but the fund is in a relatively good position, with strong revenue reserves. We have adopted a cautious stance for some time and see little reason to shift from this conservative focus on higher-quality businesses,’ he concludes.
Asset allocation
Investment process: Diverse, quality stocks with long-run focus
Manager Charles Luke and his deputy, Iain Pyle, are part of a five-strong UK equity income team, which sits within Aberdeen Standard Investment’s (ASI) UK equity team. This team provides Luke with detailed research coverage on the UK’s 350 largest listed companies. Luke also has access to the work of ASI’s UK smaller companies team, while ideas on overseas stocks are drawn from ASI’s global research network. Investment ideas are tested against a quality filter, which includes assessments of the attractiveness of the industry, the durability of the company’s business model, its financial strength, management capability, and environmental, social and governance (ESG) risks. All ideas are subject to rigorous team scrutiny and debate. Fundamental research is supplemented by regular company meetings.
The team seeks undervalued companies with high margins and return on equity, low levels of net debt, above-average earnings and dividend growth potential, along with the capacity to react quickly to adverse developments. MUT typically invests in a portfolio of between 30 and 70 stocks, with a long-term timeframe, to give holdings time to realise their potential value. Portfolio turnover is therefore low, with stocks held for an average of about five years. However, if a company’s fundamentals deteriorate, the team will exit swiftly. All positions are kept under continuous review, supported by the UK equity team’s daily meetings to discuss company news and outlook changes.
Diversification is key to MUT’s approach. About 30% of the portfolio is invested in mid- and small-cap companies, while overseas stocks may represent up to 20% of holdings. This provides diversification by size and geography beyond that of some other UK equity income funds. Additionally, the team seeks to diversify holdings by income and capital (with a limit on each of 5% per holding) and by sector. Holdings in the top three sectors, as defined by Industry Classification Benchmark (ICB) classifications, are limited to 50% of the portfolio, and the top five holdings may not exceed 40%. Overseas holdings have also allowed MUT to benefit from currency gains thanks to the weakness of the pound.
The team uses option writing to augment the investment process in two ways. Firstly, it allows the team to optimise exposure to individual holdings, mainly via the writing of call options, to potentially reduce exposure to particular stocks. Additionally, option premium income provides a modest, uncorrelated supplement to portfolio income.
MUT actively engages with portfolio companies on ESG matters, based on the view that this helps foster stronger long-term performance. To this end, the manager draws on the expertise of ASI’s 30-strong, in-house ESG team.
Exhibit 3: MUT quantitative quality characteristics
MUT (%) |
Benchmark (%) |
|
Return on equity |
16.2 |
12.4 |
Operating margin |
17.6 |
16.4 |
Net debt (ex-financials) |
72.8 |
84.4 |
EPS growth three-year forward |
6.7 |
6.4 |
DPS growth three-year forward |
5.0 |
4.0 |
Source: Murray Income Trust, Edison Investment Research. Note: Calculated as weighted medians, as at 31 December 2019.
Current portfolio positioning
As at 31 March 2020, MUT’s portfolio held 58 stocks, unchanged since 30 September 2019. There were 50 UK and eight overseas stocks, compared to 51 UK stocks and 7 overseas stocks at end-September 2019. The top 10 holdings (Exhibit 1) comprise 33.4% of the portfolio, a little higher than 31.2% at end September 2019. Overseas holdings represent 13.5% of the portfolio, up from 11.2% at 30 September 2019 (Exhibit 4), following purchases of Telenor, a Norwegian telecommunications stock, and Mowi, a Norwegian food producer, and the sale of Scandinavian Tobacco. With the exception of Microsoft, all of the overseas holdings are listed in Switzerland and the Nordic countries.
Exhibit 4: MUT’s overseas holdings as at 31 March 2020
Company |
Country |
Sector |
% of portfolio end-March 2020 |
Roche Holdings |
Switzerland |
Pharmaceuticals & biotechnology |
3.2 |
Microsoft |
US |
Software & computer services |
2.1 |
Nestlé |
Switzerland |
Food producers |
1.7 |
VAT Group |
Switzerland |
Industrial engineering |
1.7 |
KONE |
Finland |
Industrial engineering |
1.5 |
Novo-Nordisk |
Denmark |
Pharmaceuticals & biotechnology |
1.5 |
Telenor |
Norway |
Telecommunications |
1.4 |
Mowi |
Norway |
Food producers |
0.4 |
Source: Murray Income Trust, Edison Investment Research. Note: Excludes options.
Recent significant market volatility has provided the opportunity to reassess the long-term attractions of various portfolio holdings and marginally reposition the portfolio in anticipation of a potential recovery. In March, the manager added to holdings of Rio Tinto, M&G, Coca-Cola Hellenic Bottling and Mondi, which were all viewed as attractively valued with sound long-term growth prospects. The manager also reduced exposure to a number of companies that are particularly exposed to the impact of COVID-19, closing small positions in Signature Aviation, Hostelworld, Compass, Diploma and HSBC.
MUT’s portfolio remains well diversified on a sectoral basis. The most significant active positions versus the benchmark are a 6.8pp underweight to financials, a 5.7pp underweight to oil and gas, a 4.3pp overweight to technology, a 2.6pp overweight to healthcare and a 2.3pp overweight to industrials (Exhibit 5). The portfolio also has modest overweights to utilities, consumer goods and telecommunications.
The manager continues to use option writing to modestly enhance portfolio income, selling a put on Mowi in February.
Exhibit 5: Portfolio industry exposure vs benchmark (% unless stated)
Portfolio end-March 2020 |
Portfolio end- March 2019 |
Change (pp) |
Index weight |
Active weight vs index (pp) |
Trust weight/ index weight (x) |
|
Financials |
19.2 |
24.7 |
(5.5) |
26.0 |
(6.8) |
0.7 |
Consumer goods |
17.2 |
16.0 |
1.1 |
15.6 |
1.6 |
1.1 |
Healthcare |
13.8 |
9.9 |
3.9 |
11.2 |
2.6 |
1.2 |
Industrials |
13.4 |
12.8 |
0.5 |
11.1 |
2.3 |
1.2 |
Consumer services |
11.4 |
10.9 |
0.5 |
11.3 |
0.1 |
1.0 |
Basic materials |
7.0 |
8.3 |
(1.3) |
7.4 |
(0.4) |
0.9 |
Technology |
5.3 |
4.7 |
0.7 |
1.0 |
4.3 |
5.2 |
Utilities |
5.2 |
2.4 |
2.8 |
3.7 |
1.5 |
1.4 |
Oil & gas |
4.6 |
6.8 |
(2.1) |
10.3 |
(5.7) |
0.4 |
Telecommunications |
2.9 |
3.4 |
(0.6) |
2.4 |
0.5 |
1.2 |
100.0 |
100.0 |
100.0 |
Source: Murray Income Trust, Edison Investment Research. Note: adjusted for cash.
Performance: Consistently strong, near & longer term
Exhibit 6: Five-year discrete performance data
12 months ending |
Share price |
NAV |
CBOE UK All Companies (%) |
MSCI UK High Dividend Yield (%) |
MSCI AC World |
31/04/16 |
(7.0) |
(7.5) |
(5.7) |
(5.8) |
(0.5) |
31/04/17 |
24.2 |
24.1 |
20.3 |
21.8 |
31.1 |
31/04/18 |
2.2 |
2.1 |
8.1 |
7.2 |
7.8 |
31/04/19 |
12.6 |
8.5 |
2.5 |
3.8 |
11.6 |
31/04/20 |
(4.5) |
(6.6) |
(17.2) |
(18.2) |
(1.2) |
Source: Refinitiv. Note: All % on a total return basis in pounds sterling.
|
Exhibit 7: Investment trust performance to 30 April 2020 |
|
Price, NAV and index total return performance, one-year rebased |
Price, NAV and index total return performance (%) |
|
|
|
Source: Refinitiv, Edison Investment Research. Note: Three-, five- and 10-year performance figures annualised. |
|
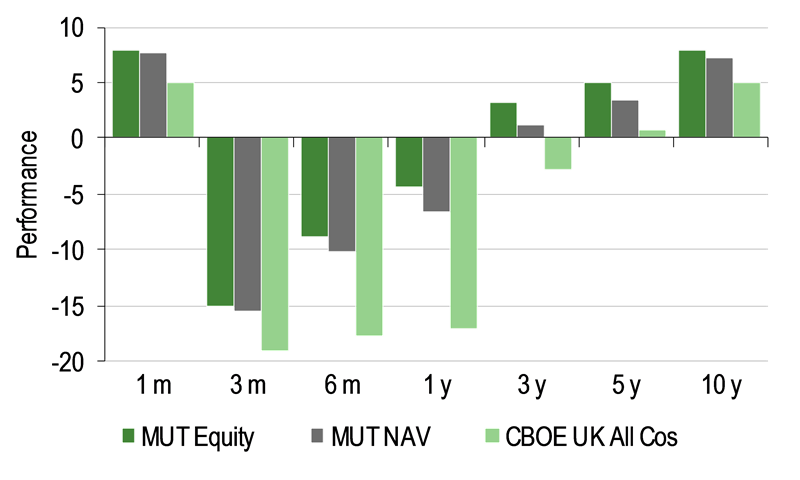
MUT’s performance has been consistently strong in relative terms during both the recent market turbulence and over the longer term. Its holdings of quality stocks have proved relatively resilient during the sell-off. The April return of 8.0% in share price terms and 7.8% on an NAV basis compare favourably with the CBOE UK All Companies index return of 5.0%. In the three months to end-April, returns in share price and NAV terms were -15.0% and -15.6% respectively, notably ahead of the CBOE UK All Companies index return of -19.1%. The trust also outperformed the index over six months and one, three, five and 10 years, recording positive absolute returns over three, five and 10 years (Exhibit 7, right-hand chart).
The MSCI UK High Dividend Yield Index could be viewed as a closer proxy than the broad UK stock market for the investment universe of a UK equity income fund. Exhibit 8 shows that MUT has also outperformed this index significantly in all periods, except for a slight underperformance in April 2020. However, it has underperformed the MSCI AC World index in all periods shown, not surprisingly given the strength in the US market, which dominates this index. Sterling’s weakness over recent years has also contributed to MUT’s underperformance against the global index, as it boosts returns from foreign investments.
Since the onset of the coronavirus crisis, performance has been helped by the portfolio’s sector positioning. Underweight positions in financials and oil & gas, and overweight positions in healthcare and utilities, have assisted returns. Stock selection has also contributed. In particular, the defensive qualities of Roche, SSE and Assura led to their outperformance and enhanced MUT’s relative returns, as did underweights to HSBC and Lloyds Bank, whose share prices declined.
|
Exhibit 8: Share price and NAV total return performance, relative to indices (%) |
||||||||
|
One month |
Three months |
Six months |
One year |
Three years |
Five years |
10 years |
|
Price relative to CBOE UK All Cos |
2.8 |
5.1 |
10.7 |
15.3 |
19.9 |
22.0 |
31.4 |
|
NAV relative to CBOE UK All Cos |
2.6 |
4.4 |
9.2 |
12.7 |
12.7 |
14.0 |
22.3 |
|
Price relative to MSCI UK High Div Yld |
(0.6) |
9.0 |
7.5 |
16.8 |
20.8 |
21.7 |
21.7 |
|
NAV relative to MSCI UK High Div Yld |
(0.8) |
8.3 |
6.1 |
14.2 |
13.6 |
13.8 |
13.2 |
|
Price relative to MSCI AC World |
(0.9) |
(7.8) |
(4.1) |
(3.3) |
(7.5) |
(18.1) |
(14.2) |
|
NAV relative to MSCI AC World |
(1.0) |
(8.4) |
(5.4) |
(5.4) |
(13.0) |
(23.4) |
(20.1) |
|
|
Source: Refinitiv, Edison Investment Research. Note: Data to end-April 2020. Geometric calculation. |
||||||||
|
Exhibit 9: NAV total return performance relative to CBOE UK All Cos index over three years |
||||||||
|
||||||||
|
Source: Refinitiv, Edison Investment Research |
||||||||
Discount: Recent events interrupt narrowing trend
Before the recent market turbulence, MUT’s discount to NAV had been diminishing steadily since the fourth quarter of 2018. It tightened more rapidly in February 2020 and the share price nudged briefly into premium territory in March, before moving back to a discount at the end of the month as the share price declined (Exhibit 9). As at 5 May 2020, the trust’s shares were trading at a 6.7% discount to cum-income NAV. This compares with historical average discounts of 4.7%, 7.0%, 7.3% and 4.0% over one, three, five and 10 years respectively.
|
Exhibit 10: Share price premium/discount to NAV (including income) over three years (%) |
|
|
Source: Refinitiv, Edison Investment Research |
Capital structure and fees
MUT is structured as a conventional investment trust, with one share class. As at end-March 2020, it had 66.1m shares in issue, with a further 2.5m in treasury. The board has authority to repurchase up to 14.99% of shares to manage a discount, or allot up to 5% to manage a premium. However, there have been no repurchases since end-October 2018, as the shares have benefited from the strong NAV performance. The managers have access to gearing of up to £60m (c 11.5% of net assets) via £40m of 10-year loan notes (issued in November 2017 with a coupon of 2.51%) and a £20m multi-currency borrowing facility with Scotiabank. At end-March, net gearing stood at 7.1%.
The trust pays Aberdeen Standard Fund Managers a tiered annual management fee based on net assets: 0.55% up to £350m, 0.45% from £350m to £450m and 0.25% above £450m. Fees are charged 70% to capital and 30% to revenue. There is no performance fee. Ongoing charges for FY19 were 0.65%, unchanged from the previous year and below the average fee of 0.90% for the AIC UK Equity Income peer group.
Dividend policy and record
MUT aims to provide investors with a high and growing dividend, paid quarterly. The 34.0p FY19 dividend was 2.3% higher than the 33.25p dividend paid for the previous 12 months, delivering the 46th successive year of dividend increases. At the AGM held in November 2019, shareholders approved a new dividend policy under which four interim dividends will be paid in December, March, June and September each year, for the years ending on or after 30 June 2020. This replaces the previous policy, which paid three interim dividends in January, March and June, and a final dividend following shareholder approval at the November AGM. The new policy thus ensures that investors will be paid dividends earlier and at more regular intervals. In November 2019, the trust announced that it would pay 8.25p per share on 20 December 2019, 20 March 2020 and 19 June 2020 for the first three interim dividends, with the board announcing the fourth interim dividend in August 2020, for payment the following month. Based on the current share price and the last four dividends, MUT has a yield of 4.8%.
In the current environment, some short-term cuts to company dividends are inevitable, in many cases because it would be politically inadvisable for companies to pay out while receiving government support. However, MUT’s quality portfolio holdings could reasonably be expected to return to the dividend list once economic activity resumes in the coming quarters, and in the meantime, MUT has sufficient revenue reserves to maintain its quarterly dividend payments for several quarters if need be and expects to be able to maintain its long-term record of increased annual dividends. The trust’s revenue reserve is currently c 29p per share, equivalent to c 85% of the full-year dividend, which provides a meaningful income cushion over coming quarters. Option writing is used as a source of additional revenue, to supplement income generated by the investment process.
Peer group comparison
MUT is a member of the Association of Investment Companies’ (AIC) UK Equity Income sector, which has 24 members. Its recent strong performance has ensured that its ranking within this sector continues to improve. Exhibit 11 shows that as at 4 May 2020, the trust now sits in the top three performers over one and three years, and the top four over five years on a total return NAV basis, and it is ranked fifth over 10 years, compared to 13th only six months previously. While none of the members of the peer group has escaped absolute losses during the recent sharp market sell-off, MUT’s return fell by 8.5%, a significantly smaller loss than the average return of -20.3% across the sector. The trust has recorded positive absolute returns over five and 10 years and is broadly flat over three years.
Exhibit 11 also shows that MUT’s ongoing charges are below the sector average and, in common with all but one of its peers, it does not charge a performance fee. Its discount is wider than the average of 5.1%, although several of MUT’s peers are trading at a premium to NAV. In common with most of its peers, MUT uses some net gearing, although less than average, while its dividend yield is somewhat below average, mainly due to the strong performance of its share price.
Exhibit 11: UK Equity Income peer group as at 5 May 2020*
% unless stated |
Market |
NAV TR |
NAV TR |
NAV TR |
NAV TR |
Ongoing |
Perf. |
Discount |
Net |
Dividend |
Murray Income Trust |
476.0 |
(8.5) |
(0.3) |
15.9 |
97.8 |
0.7 |
No |
(6.7) |
107 |
4.8 |
Aberdeen Standard Equity Inc Trust |
133.6 |
(30.1) |
(26.9) |
(17.7) |
54.5 |
0.9 |
No |
(9.8) |
110 |
7.8 |
BlackRock Income and Growth |
38.0 |
(15.9) |
(11.3) |
2.1 |
63.6 |
1.1 |
No |
1.0 |
102 |
4.3 |
BMO Capital & Income |
267.2 |
(21.9) |
(12.6) |
9.2 |
74.3 |
0.6 |
No |
2.2 |
108 |
4.6 |
BMO UK High Income Units |
100.0 |
(17.2) |
(15.2) |
(2.4) |
64.9 |
1.0 |
No |
(4.7) |
105 |
5.0 |
Chelverton UK Dividend Trust |
25.0 |
(38.6) |
(42.1) |
(20.8) |
115.4 |
2.0 |
No |
(1.5) |
169 |
10.1 |
City of London |
1,395.7 |
(19.2) |
(12.5) |
(1.0) |
93.7 |
0.4 |
No |
4.7 |
111 |
5.7 |
Diverse Income Trust |
291.3 |
(7.2) |
(4.3) |
20.6 |
-- |
1.2 |
No |
(10.6) |
100 |
4.7 |
Dunedin Income Growth |
364.5 |
(7.2) |
2.2 |
12.6 |
95.0 |
0.6 |
No |
(6.3) |
109 |
5.2 |
Edinburgh Investment Trust |
778.2 |
(25.2) |
(28.7) |
(14.6) |
91.8 |
0.6 |
No |
(12.6) |
110 |
6.4 |
Finsbury Growth & Income |
1,661.2 |
(10.8) |
14.8 |
45.1 |
246.6 |
0.7 |
No |
0.5 |
101 |
2.2 |
Invesco Income Growth |
130.6 |
(17.7) |
(16.0) |
(4.0) |
86.6 |
0.7 |
No |
(13.4) |
104 |
5.3 |
Investment Company |
12.9 |
(13.6) |
(5.2) |
(2.5) |
73.8 |
2.4 |
No |
(8.3) |
100 |
4.5 |
JPMorgan Claverhouse |
319.8 |
(22.6) |
(16.5) |
(2.4) |
68.8 |
0.7 |
No |
3.4 |
105 |
5.3 |
JPMorgan Elect Managed Income |
69.5 |
(19.6) |
(15.8) |
(5.2) |
67.9 |
0.9 |
No |
(1.9) |
100 |
5.5 |
Law Debenture Corporation |
580.3 |
(19.5) |
(11.6) |
3.0 |
97.1 |
0.3 |
No |
(3.1) |
122 |
5.3 |
Lowland |
252.4 |
(29.9) |
(31.1) |
(18.1) |
91.6 |
0.6 |
Yes |
(6.0) |
117 |
6.4 |
Merchants Trust |
435.3 |
(23.2) |
(15.5) |
(8.0) |
67.1 |
0.6 |
No |
0.3 |
118 |
7.4 |
Perpetual Income & Growth |
462.9 |
(31.0) |
(35.2) |
(28.8) |
55.5 |
0.7 |
No |
(13.7) |
116 |
6.9 |
Schroder Income Growth |
163.5 |
(20.8) |
(15.5) |
(4.5) |
81.6 |
0.9 |
No |
2.8 |
112 |
5.3 |
Shires Income |
67.2 |
(14.7) |
(7.5) |
7.4 |
102.0 |
1.4 |
No |
(1.9) |
123 |
6.0 |
Temple Bar |
478.8 |
(40.6) |
(33.2) |
(25.6) |
37.3 |
0.5 |
No |
(9.5) |
100 |
7.2 |
Troy Income & Growth |
243.8 |
(8.7) |
(1.6) |
16.2 |
111.0 |
0.9 |
No |
1.9 |
100 |
3.9 |
Value And Income |
75.6 |
(24.0) |
(19.5) |
(10.0) |
53.1 |
1.3 |
No |
(28.6) |
141 |
7.3 |
Sector average (24 funds) |
367.6 |
(20.3) |
(15.0) |
(1.4) |
86.6 |
0.9 |
(5.1) |
112 |
5.7 |
|
MUT rank in sector |
6 |
3 |
3 |
4 |
5 |
16 |
16 |
14 |
18 |
Source: Morningstar, Edison Investment Research. Note: *Performance to 4 May 2020 based on cum-fair NAV. TR = total return. Net gearing is total assets less cash and equivalents as a percentage of net assets (100 = ungeared).
The board
MUT’s board comprises six independent, non-executive directors. It is chaired by Neil Rogan, who joined the board in 2013 and assumed his current role in 2017. Jean Park was appointed in 2012 and became the senior independent director in 2018. Donald Cameron, MSP, also joined in 2012. The trust appointed Peter Tait in November 2017, and Stephanie Eastment, who chairs the audit committee, in August 2018. Merryn Somerset Webb became a director in August 2019. Between them, the directors have professional experience in accountancy, law, insurance, investment management and personal financial journalism.
|
|
Research: Healthcare
The NDA submission for illumet has been delayed slightly by COVID-19 but is expected to be submitted in Q220 (from March-April guidance). A European MAA has already been submitted. Telix’s clinical studies (including the ZIRCON Phase III study that recently opened enrolment in the US) are paused, but the company expects them to reopen in June and be back to normal around September. Telix is now guiding to ZIRCON full enrolment by the end of 2020.