Last close As at 05/08/2026
—
— 0.00 (0.00%)
Market capitalisation
—
Research: Investment Companies
Fidelity Special Values (FSV) employs a value-based, contrarian investment style aiming to achieve long-term capital growth primarily through investment in UK companies, which the managers believe are undervalued or where potential has not been recognised by the market. FSV has endured a challenging period of underperformance. However, lead manager Alex Wright and co-manager Jonathan Winton believe the Q120 market sell-off created many investment opportunities, which they have sought to exploit. In their view, UK value stocks, and FSV in particular, now offer great value, which is further amplified by the trust’s current discount making for a good valuation starting point for investment. The managers see significant scope for the trust to outperform not only growth strategies and UK equities in general, but also other asset classes.
Fidelity Special Values |
Opportunities and value in an undervalued market |
Investment trusts |
14 October 2020 |
Share price/discount performance
Three-year performance vs index
Gearing
Analysts
|
|||||||||||||||||||||||||||||||||||||||||||||||||||||||||||||||||||||||||||||||||
Fidelity Special Values (FSV) employs a value-based, contrarian investment style aiming to achieve long-term capital growth primarily through investment in UK companies, which the managers believe are undervalued or where potential has not been recognised by the market. FSV has endured a challenging period of underperformance. However, lead manager Alex Wright and co-manager Jonathan Winton believe the Q120 market sell-off created many investment opportunities, which they have sought to exploit. In their view, UK value stocks, and FSV in particular, now offer great value, which is further amplified by the trust’s current discount making for a good valuation starting point for investment. The managers see significant scope for the trust to outperform not only growth strategies and UK equities in general, but also other asset classes.
|
Regaining ground – NAV performance versus the UK market |
|
|
Source: Refinitiv, Edison Investment Research |
The market opportunity
Value-based investment strategies have been out of favour with investors for some time, especially since the onset of the coronavirus crisis, when the market has focused on growth stocks, irrespective of valuations. In addition, UK equities are under-owned and trade at a significant discount to other equity markets. While this means that recent months have been painful for UK value investors, it has created a very attractive opportunity set, with significant upside potential.
Why consider investing in Fidelity Special Values?
■
Recently improved performance and outperformance of the UK market over the long term.
■
A value-based, contrarian investment approach offering style diversification and the opportunity for investors to benefit when investor sentiment towards value stocks improves and/or individual holdings re-rate on improved fundamentals or perceptions.
Recent shift to a discount with a 3.1% yield
FSV is currently trading at a discount of 9.2% to NAV, which compares with an average discount of 3.1% over one year, 1.3% over three years, and 2.9% and 5.9% over five and 10 years respectively. Based on the current share price, the trust offers a yield of 3.1%.
Exhibit 1: Trust at a glance
Investment objective and fund background |
Recent developments |
||||||||||||||||||||||||||||||||||||||||||||||||||||||||||||||||||||||||||||||||||||||||||||||||
Fidelity Special Values’ investment objective is to achieve long-term capital growth, primarily through investment in the equities of UK companies that the managers believe to be undervalued or where potential has not been recognised by the market. Investments are only made in companies where the potential downside risk is understood, to limit the possibility of losses. The trust’s performance is measured against a broad index of UK companies. |
■ 24 June 2020: Interim dividend of 2.10p per share paid. ■ 28 April 2020: Six months results ended 29 February 2020. TR of -6.7% on a share price basis and -6.1% on an NAV basis, compared to -5.5% for the UK market. TR over five years was 42.5% on a share price basis and 29.8% on a NAV basis, compared to a benchmark return of 19.1%. |
||||||||||||||||||||||||||||||||||||||||||||||||||||||||||||||||||||||||||||||||||||||||||||||||
Forthcoming |
Capital structure |
Fund details |
|||||||||||||||||||||||||||||||||||||||||||||||||||||||||||||||||||||||||||||||||||||||||||||||
AGM |
December 2020 |
Ongoing charges |
0.97% |
Group |
|
||||||||||||||||||||||||||||||||||||||||||||||||||||||||||||||||||||||||||||||||||||||||||||
Final results |
November 2020 |
Net market gearing |
14% (as at 31 August 2020) |
Manager |
Alex Wright, Jonathan Winton |
||||||||||||||||||||||||||||||||||||||||||||||||||||||||||||||||||||||||||||||||||||||||||||
Year end |
31 August |
Annual mgmt fee |
Tiered: 0.85% up to £700m net assets, 0.75% thereafter |
Address |
Beech Gate, Millfield Lane, |
||||||||||||||||||||||||||||||||||||||||||||||||||||||||||||||||||||||||||||||||||||||||||||
Dividend paid |
June, January |
Performance fee |
None |
||||||||||||||||||||||||||||||||||||||||||||||||||||||||||||||||||||||||||||||||||||||||||||||
Launch date |
17 November 1994 |
Trust life |
Indefinite (subject to vote) |
Phone |
01732 361144 |
||||||||||||||||||||||||||||||||||||||||||||||||||||||||||||||||||||||||||||||||||||||||||||
Continuation vote |
Three-yearly (2022) |
Loan facilities |
None – CFDs used |
Website |
|||||||||||||||||||||||||||||||||||||||||||||||||||||||||||||||||||||||||||||||||||||||||||||
Dividend policy and history (financial years) |
Share buyback policy and history (financial years) |
||||||||||||||||||||||||||||||||||||||||||||||||||||||||||||||||||||||||||||||||||||||||||||||||
Since 2015, FSV has paid interim and final dividends, in order to smooth the dividend payment for the year. |
FSV has annually renewed authority to purchase up to 14.99% and allot up to 10% of its issued share capital. |
||||||||||||||||||||||||||||||||||||||||||||||||||||||||||||||||||||||||||||||||||||||||||||||||
|
|
||||||||||||||||||||||||||||||||||||||||||||||||||||||||||||||||||||||||||||||||||||||||||||||||
Shareholder base (as at 31 August 2020) |
Portfolio exposure by sector (as at 31 August 2020) |
||||||||||||||||||||||||||||||||||||||||||||||||||||||||||||||||||||||||||||||||||||||||||||||||
|
|
||||||||||||||||||||||||||||||||||||||||||||||||||||||||||||||||||||||||||||||||||||||||||||||||
Top 10 holdings (as at 31 August 2020) |
|||||||||||||||||||||||||||||||||||||||||||||||||||||||||||||||||||||||||||||||||||||||||||||||||
|
|||||||||||||||||||||||||||||||||||||||||||||||||||||||||||||||||||||||||||||||||||||||||||||||||
Source: FSV, Edison Investment Research, Morningstar. Note: *N/A where not in end-August 2019 top 10.
The fund managers: Alex Wright and Jonathan Winton
The managers’ view: Great value, with scope to outperform
FSV has a value-based, contrarian investment approach. Lead manager Alex Wright says that this investment style has been out of favour with investors for some time, but especially since the onset of the coronavirus. ‘The market’s focus during this pandemic has been very narrow, with attention primarily on companies with superior growth potential, seemingly irrespective of near-term uncertainty and certainly irrespective of valuations’ he says. The manager views this as a challenging backdrop for contrarian investors, especially those, like FSV, focused on UK equities, which remain under-owned and which trade at a significant discount to other equity markets. ‘Even steady companies with visible and relatively safe earnings are being overlooked’ he says. In fact, Wright views 2020 as ‘the worst year in history for value investing’.
However, he believes that current market conditions have a silver lining for value investors. ‘There are now lots of amazing opportunities in value land, across many sectors’, Wright says. He stresses that it is essential to be selective and focus on stocks with a margin of safety and evidence of positive change. But even in such cases, he believes that companies’ fundamentals are often not reflected in valuations. The manager cites as one example FSV’s holding in Sanofi, a pharmaceutical company, which has a credible COVID-19 vaccine under development yet has been overlooked by the market.
Wright also notes the unusually high level of uncertainty currently pervading financial markets in relation to the evolution of both the public health and associated economic crises. He expects the looming recession to be ‘massive’, despite the government’s efforts to support jobs and activity, and views an effective vaccine as key to getting households and businesses to resume normal activity. The manager believes this uncertainty is further compounded by the government’s failure to reach a deal with the EU over the UK’s departure from the Union. ‘A no-deal Brexit would be a negative outcome for the economy and financial markets, resulting in additional trade frictions and higher costs for companies’, he says. However, Wright stresses that UK supply chains have proved robust through the coronavirus crisis, giving him comfort that a no-deal Brexit represents a lower risk than previously perceived, as companies are better prepared. Nonetheless, Brexit risks still need close monitoring, he warns. On a more positive note, the manager expects a successful outcome to Brexit negotiations to boost investor sentiment towards UK equities, and thus begin to redress the underperformance of the UK market in recent years.
On the broader question of value strategies’ capacity to eventually reverse their underperformance against growth strategies, Wright notes that value stocks tend to experience sustained periods of outperformance in the early stages of economic recovery, as prices rise. ‘Improved clarity on the economic outlook and Brexit, as well as a possible recalibration of rate expectations, may well be the catalyst for investors to broaden their investment horizons beyond the narrow range of secular growth stocks currently in favour’, says Wright. A re-rating of value stocks may also be sparked by a shift in investor sentiment against growth stocks. ‘Investor expectations regarding some growth stocks are now extremely high and lofty valuations leave little room for error’, says Wright. ‘If these companies fail to deliver on growth expectations, the market reaction is likely to be aggressive, with the potential to trigger a broader violent and sustained re-rating of value stocks.’
While it is impossible to predict the exact turning point for value strategies, Wright holds a strong conviction that investing in companies with attractive valuations has proved a rewarding strategy over the long term and he sees no reason why this should change going forward. ‘At a time when not many assets are offering absolute returns, UK value stocks, and FSV in particular, look very attractive. The trust’s appeal is amplified by its current discount, making for a good valuation starting point for investment, with scope to outperform not only growth strategies and UK equities in general, but also other asset classes’ he concludes.
The portfolio
Early in the coronavirus crisis, Wright took action to increase the defensiveness of the portfolio, closing positions in airlines and highly leveraged stocks. He also reduced exposure to oil stocks, given a sharp decline in the oil price and in anticipation of dividend cuts by UK oil majors. He sold Shell outright and reduced the position in BP, but maintains a 3.2% exposure to oil (as at end-August), as he expects the oil price to rise over time, supported by recovering demand and a lack of new investment in exploration.
More recently, Wright has begun responding to the many opportunities created by the market’s uneven reaction to the pandemic. He has added several new names to the portfolio and topped up existing positions at attractive prices. Specifically, he has increased exposure to consumer spending in areas which have seen increased demand due to the pandemic, such as sportswear (Fraser Group), alternatives to public transport (Halfords and Inchape), online retailers (Studio Retail Group) and electronics and white goods suppliers (Dixons Carphone). Fraser and Halfords have both have seen a like-for-like sales increase of around 25% year-on-year and surprised the market with better than expected results.
The virus-induced increase in demand for larger homes has motivated a greater exposure to house builders, both in the UK and Ireland, primarily focused on the construction of suburban houses, rather than city flats, where demand has declined in response to widespread remote working. Wright has also purchased a residential property services company, LSL Property Services, and increased exposure to life insurers, which he views as ‘a very exciting sector’ due to their growing earnings, strong balance sheets and low valuations. He believes life insurers are less cyclical than they were and that solvency levels have improved since the financial crisis. Furthermore, Wright sees further scope for beneficial strategic developments in this sector, which are not currently reflected in valuations. He has exposure to the life insurance sector via holdings in Legal and General and Aviva, the portfolio’s two largest positions, which were increased during the sell-off, as well as in Phoenix and Just. The manager also added to other top 10 holdings in building materials company CRH and the fuel-to-medical products conglomerate DCC. Both were hit hard by the Q1 sell-off, but in Wright’s view, retain their positive long-term prospects. The manager also added to the position in Serco, another top 10 holding and a company he believes has rehabilitated itself after previous problems and increased its government work, including some COVID-related contracts. Serco is one of a few companies to have increased its profit expectations this year. Wright notes that many of the portfolio’s recent purchases have been smaller-cap companies, which he views as particularly attractive, as these have been more susceptible to uncertainty and have failed to benefit in the recent market recovery.
As a contrarian investor, Wright is not drawn to many of the high-profile technology and healthcare stocks that have become popular due to their perceived capacity to benefit from the coronavirus crisis. He views large pharma and medtech companies such as AstraZeneca, with valuations of around 25x earnings, as expensive. However, the portfolio does hold more attractively valued pharmaceutical names such as Sanofi and Roche (a top three holding), which trade at around 15x earnings, but have equally attractive drug pipelines and long-term prospects.
The manager has also reduced holdings in some stocks which have detracted from recent performance, including Meggitt, the aerospace equipment and maintenance supplier, and alcoholic drinks company C&C Group. Both these names were hit by the complete shutdown of their respective industries and face significantly reduced levels of activity while restrictions on movement and social gatherings continue. The manager has also sold Citigroup after a good performance, further reducing exposure to banks, whose near-term outlook is depressed by low interest rates.
|
Exhibit 2: Portfolio geographic and market cap exposure as at end-August 2020 |
|
Portfolio geographic exposure by company domicile |
Portfolio market cap exposure |
|
|
|
Source: Fidelity Special Values, Edison Investment Research. Note: Figures are adjusted for gearing and index futures. |
|
The portfolio presently has around 90–100 stocks – more than usual due to recent acquisitions. However, despite the increase in the number of holdings, portfolio concentration has remained unchanged since the beginning of the pandemic. At the end of August, the trust’s top 10 holdings comprised 36.5% of the portfolio, the same level as at end-February 2020 and lower than 39.1% at end-August last year (Exhibit 1). The top 10 holdings are a mix of financials and industrials and other defensive businesses.
Exhibit 3: Portfolio sector exposure vs benchmark index (% unless stated)
Portfolio end- August 2020 |
Portfolio end- August 2019 |
Change (pp) |
Index end-August 2020 |
Active weight vs index (pp) |
Trust weight/ index weight (x) |
|
Financials |
28.7 |
28.2 |
0.5 |
25.6 |
3.1 |
1.1 |
Industrials |
26.8 |
26.5 |
0.4 |
12.6 |
14.2 |
2.1 |
Consumer services |
10.0 |
10.2 |
(0.2) |
12.5 |
(2.5) |
0.8 |
Healthcare |
9.6 |
6.7 |
2.8 |
11.2 |
(1.6) |
0.9 |
Consumer goods |
8.7 |
8.3 |
0.4 |
15.1 |
(6.4) |
0.6 |
Basic materials |
6.5 |
7.2 |
(0.7) |
8.9 |
(2.4) |
0.7 |
Oil & gas |
3.2 |
9.2 |
(6.0) |
7.4 |
(4.2) |
0.4 |
Utilities |
3.1 |
2.9 |
0.2 |
3.3 |
(0.2) |
0.9 |
Telecommunications |
2.2 |
0.5 |
1.7 |
2.2 |
0.0 |
1.0 |
Technology |
1.3 |
0.4 |
0.9 |
1.2 |
0.1 |
1.1 |
100.0 |
100.0 |
100.0 |
Source: Fidelity Special Values, Edison Investment Research. Note: Figures are adjusted for gearing and index futures. Numbers subject to rounding.
In terms of sectoral exposure, as shown in Exhibit 3, the portfolio’s largest position is in financials (28.7%, representing an overweight of 3.1pp). This comprises mainly insurers, where the portfolio is overweight by about 8pp. Conversely, the portfolio is underweight banks, thanks in part to the recent disposal of Citigroup, as the manager sees the low interest rate environment as detrimental to banks’ ability to generate interest income. Industrials are FSV’s second largest position (26.8%) and the heaviest overweight (14.2pp), comprising a mix of aerospace, defence and support services and construction-related companies. The main sectoral underweight is to consumer goods (8.7% and 6.4pp underweight), partly because FSV’s contrarian manager views many consumer staples such as Unilever, Diageo and Reckitt Benckiser as too expensive, compared to other defensive stocks. The trust is also underweight oil and gas (a 3.2% exposure, 4.2pp underweight) following the disposals discussed above. It has lesser underweights to consumer services, where the near-term outlook for many consumer-facing businesses such as restaurants, pubs and tourist venues is very poor, and to basic materials.
Portfolio net market gearing has increased to 14% at end-August 2020, from 2% at the same time last year, as the manager views gearing as a further means of capitalising on an usually broad set of superior quality opportunities. However, given the development of a second wave of the coronavirus and the unusual degree of uncertainty pervading the economic outlook, Wright is keen to stress the well diversified nature of FSV’s portfolio positioning, which he expects to show resilience in the event of worse than expected public health or economic outcomes.
Performance: Improving, outperforming longer-term
Exhibit 4: Five-year discrete performance data
12 months ending |
Share price |
NAV |
CBOE UK All Cos |
CBOE UK 100 (%) |
CBOE UK 250 |
CBOE UK Small Cos (%) |
30/09/16 |
5.0 |
14.3 |
17.4 |
0.9 |
11.1 |
3.8 |
30/09/17 |
24.9 |
20.0 |
12.0 |
0.9 |
14.2 |
23.6 |
30/09/18 |
14.7 |
7.0 |
5.9 |
0.8 |
4.6 |
1.4 |
30/09/19 |
(2.7) |
(1.9) |
2.7 |
0.8 |
(0.3) |
(7.3) |
30/09/20 |
(30.7) |
(22.3) |
(17.9) |
(3.8) |
(16.1) |
(13.8) |
Source: Refinitiv. Note: All % on a total return basis in pounds sterling.
FSV’s performance has been challenged for some time as its value-focused style has underperformed growth and momentum strategies. The coronavirus crisis caused this trend to accelerate. However, after what manager Alex Wright describes as an extremely painful Q120, where the portfolio was down 35.7% in NAV terms versus a market decline of 25.1%, the six-month period from 1 April to end September 2020 has seen performance improve. The fund made absolute gains of 3.9% on a share price basis and 13.5% in NAV terms, compared to a market return of 6.2%, as some of the portfolio’s defensive holdings demonstrated their resilience by surprising the market with stronger than expected results (Exhibit 5).
|
Exhibit 5: Investment trust performance to 30 September 2020 |
|
Price, NAV and index total return performance, one-year rebased |
Price, NAV and index total return performance (%) |
|
|
|
Source: Refinitiv, Edison Investment Research. Note: Three-, five- and 10-year performance figures annualised. |
|
The portfolio’s overweight to ContourGlobal, a global utility business, which is a top 10 holding, has been one of the most significant contributors to performance over the last six months. While the manager expected it to do well in Q120, it took the market until Q2 to understand the nature of the business, particularly the fact that it has mainly fixed-price contracts. Wright has been engaged with this company for some time and was also aware that its attitude to environmental, social and governance (ESG) matters is changing. It recently announced that it has scrapped plans to build a coal-fired power station in Kosovo and committed to making no further coal plant investments globally. These announcements have seen the stock re-rating supported by ESG-conscious investors. FSV’s performance has also been assisted since April by the recovery in overweight positions in top 10 industrial companies CRH and DCC. Returns were also supported by an improvement in some small, idiosyncratic positions such as SEMAFO, a gold mining company which benefited from a takeover by Endeavour Mining and Indivior, a drug company whose stock price rallied after a court case was resolved in its favour. Recent performance has also been assisted by underweights in HSBC and oil companies Royal Dutch Shell and BP. The most significant detractors from performance over the last six months included overweight positions in infrastructure company John Laing Group, tobacco company Imperial Brands and Roche, a pharmaceutical firm, which are all top 10 holdings, and Babcock International, an engineering services firm.
|
Exhibit 6: Share price and NAV total return performance, relative to indices (%) |
|||||||
|
One month |
Three months |
Six months |
One year |
Three years |
Five years |
10 years |
Price relative to CBOE UK All Companies |
(1.9) |
(3.7) |
(2.1) |
(15.6) |
(13.4) |
(13.6) |
21.1 |
NAV relative to CBOE UK All Companies |
(0.0) |
2.5 |
6.9 |
(5.3) |
(8.6) |
(4.7) |
19.7 |
Price relative to CBOE UK 100 |
(2.1) |
(2.9) |
8.5 |
(28.0) |
(20.9) |
2.0 |
89.9 |
NAV relative to CBOE UK 100 |
(0.3) |
3.3 |
18.5 |
(19.2) |
(16.6) |
12.4 |
87.7 |
Price relative to CBOE UK 250 |
(0.4) |
(7.9) |
(8.8) |
(17.4) |
(11.7) |
(8.7) |
(7.2) |
NAV relative to CBOE UK 250 |
1.4 |
(2.1) |
(0.4) |
(7.3) |
(6.8) |
0.7 |
(8.2) |
Price relative to CBOE UK Small Companies |
(0.3) |
(7.3) |
(9.5) |
(19.7) |
(4.7) |
(2.5) |
74.1 |
NAV relative to CBOE UK Small Companies |
1.5 |
(1.4) |
(1.2) |
(9.9) |
0.6 |
7.5 |
72.1 |
|
Source: Refinitiv, Edison Investment Research. Note: Data to end-30 September 2020. Geometric calculation. |
|||||||
This improvement in recent absolute and relative performance has so far been insufficient to make up for earlier underperformance and FSV’s returns have lagged the broad UK market over one, three and five years. However, the trust has markedly outperformed the UK market in both share price and NAV terms over 10 years. The trust has also outperformed large-cap UK companies in both share price and NAV terms over five and 10 years, and small-cap UK companies over 10 years, as shown in Exhibit 6.
|
Exhibit 7: NAV total return performance relative to CBOE UK All Cos over three years |
|
|
Source: Refinitiv, Edison Investment Research |
Valuation: Discount management policy in action
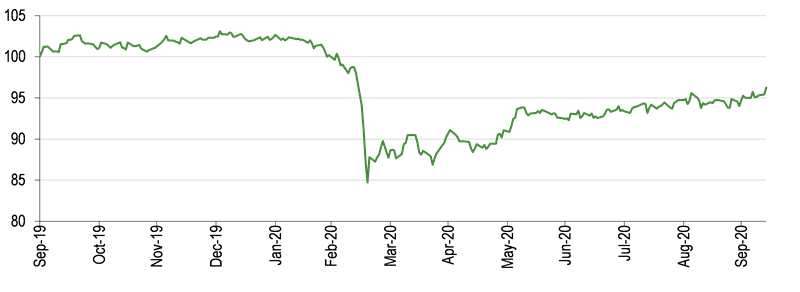
As has been the case with many investment trusts, FSV’s valuation has been volatile since the onset of the coronavirus pandemic. Its share price is currently trading at a discount of 9.2% to NAV, which compares with average discounts of 3.1%, 1.3%, 2.9% and 5.9% over the past one, three, five and 10 years respectively.
The trust’s board seeks to maintain a single-digit discount or a small premium to NAV in normal market conditions. It has the authority to purchase up to 14.99% of shares in issue, which it believes gives shareholders a level of comfort. The board can also allot up to 10% of issued share capital. In FY19, c 9.6m shares (c 3.6% of the end-FY18 share base) were issued and, as shown in the share buyback chart in Exhibit 1, allotments accelerated in FY20 (ended 31 August 2020) with a total of 13.9m shares issued (c 5.0% of end-FY19 share base). So far in FY21, the board has repurchased c 1.0m shares into treasury.
The manager believes that the trust’s move to a discount is not a surprise given its disappointing performance in Q120. He views the discount as offering an extra leg of performance potential as and when value strategies return to favour with investors.
|
Exhibit 8: Share price premium/discount to NAV (including income) over three years (%) |
|
|
Source: Refinitiv, Edison Investment Research |
Peer group comparison
FSV remains the second largest fund within the AIC UK all Companies sector. Its peers follow a variety of investment strategies. As shown in Exhibit 9, the trust’s NAV total returns are below average across all periods shown, ranking 11th over one and three years, and 10th and 8th over five and 10 years respectively. Its share price discount to NAV is somewhat narrower than the average among its peers and its ongoing charge is higher. Like the majority of its peers, the trust does not pay a performance fee. The trust’s level of gearing (14%) is second highest in the sector and its yield is slightly below the average, which is not surprising given that it is focused on capital growth rather than income.
Exhibit 9: AIC UK All Companies sector as at 13 October 2020*
% unless stated |
Market |
NAV TR |
NAV TR |
NAV TR |
NAV TR |
Discount |
Ongoing charge |
Perf. |
Net |
Dividend |
Fidelity Special Values |
532.0 |
(19.7) |
(18.2) |
9.6 |
95.4 |
(9.2) |
1.0 |
No |
114 |
3.1 |
Artemis Alpha Trust |
115.8 |
3.1 |
2.7 |
22.7 |
43.7 |
(18.2) |
1.0 |
No |
100 |
1.8 |
Aurora |
123.9 |
(13.9) |
(11.1) |
15.5 |
(21.5) |
(3.7) |
0.4 |
Yes |
100 |
2.7 |
Baillie Gifford UK Growth |
284.5 |
8.8 |
10.0 |
33.1 |
98.9 |
(5.4) |
0.7 |
No |
100 |
3.3 |
Henderson Opportunities |
68.6 |
(0.3) |
(6.3) |
17.2 |
143.4 |
(19.0) |
0.9 |
Yes |
115 |
2.9 |
Independent |
245.6 |
(2.6) |
(9.7) |
52.8 |
177.5 |
(11.0) |
0.2 |
No |
100 |
1.8 |
Invesco Perp Select UK Equity |
42.5 |
(10.4) |
(10.7) |
10.3 |
136.9 |
(3.8) |
0.9 |
Yes |
113 |
4.6 |
JPMorgan Mid Cap |
219.6 |
(6.5) |
(3.9) |
29.2 |
194.1 |
(14.1) |
0.9 |
No |
108 |
3.1 |
Jupiter UK Growth |
28.5 |
(21.9) |
(33.0) |
(25.2) |
11.2 |
(5.3) |
1.2 |
Yes |
99 |
4.4 |
Keystone |
160.9 |
(12.8) |
(13.6) |
(2.1) |
83.0 |
(17.5) |
0.5 |
Yes |
110 |
4.3 |
Mercantile |
1,535.6 |
(2.8) |
4.5 |
36.7 |
162.4 |
(8.8) |
0.5 |
No |
110 |
3.4 |
Schroder UK Mid Cap |
177.1 |
(1.4) |
1.5 |
31.2 |
169.8 |
(14.2) |
0.9 |
No |
106 |
3.7 |
Average (12 funds) |
294.5 |
(6.7) |
(7.3) |
19.3 |
107.9 |
(10.9) |
0.8 |
106 |
3.3 |
|
Trust rank in sector |
2 |
11 |
11 |
10 |
8 |
6 |
2 |
2 |
8 |
Source: Morningstar, Edison Investment Research. Note: *Performance to 12 October 2020 based on ex-par NAV. TR = total return. Net gearing is total assets less cash and equivalents as a percentage of net assets.
|
|
Research: Investment Companies
In recent years, NB Private Equity Partners (NBPE) has largely become a play on direct co-investments (currently 87% of the portfolio, largely in North America). This positioning provides access to investments alongside top general partners (GPs) with a single-layer fee structure while at the same time allowing NBPE to be selective in terms of investments, with its direct co-investment portfolio achieving three- and five-year gross IRRs to end-August 2020 of 12.0% and 13.6% pa in US dollar terms, respectively. It also allows NBPE to keep a lower level of unfunded commitments, which are currently fully covered by available liquidity (184% adjusted coverage).