WYG
Written by
WYG |
Good UK and order momentum going into H2 |
H116 results |
Industrial support services |
15 December 2015 |
Share price performance
Business description
Next events
Analysts
WYG is a research client of Edison Investment Research Limited |
|||||||||||||||||||||||||||||||||||||||||||||||||||
In the last year, WYG has completed a strategic review, put a new incentive scheme in place and refreshed the board composition. This has not distracted from the ongoing delivery of profit progress. In H116, UK operations moved strongly ahead and the order position both here and in international regions is improving. Hence, medium-term prospects appear to be encouraging and translating them into results that allow a narrowing of the gap between market estimates and management aspirations is likely to be an important determinant of share price performance.
Year end |
Revenue (£m) |
PBT* |
EPS* |
DPS |
P/E |
Yield |
03/14 |
126.9 |
4.3 |
6.4 |
0.5 |
20.1 |
0.4 |
03/15 |
130.5 |
5.7 |
8.6 |
1.0 |
14.9 |
0.8 |
03/16e |
134.0 |
6.9 |
8.8 |
1.5 |
14.6 |
1.2 |
03/17e |
151.7 |
8.3 |
10.4 |
1.7 |
12.3 |
1.3 |
Note: *PBT and EPS are normalised, excluding intangible amortisation, exceptional items and share-based payments.
Strong UK performance drives H116 progress
First half results were mixed, comprising a very strong UK uplift, partly offset by weaker contributions from the two international regions reflecting near-term funding inertia as previously flagged. These respective movements demonstrate both positive operational gearing effects in the UK and the flexible cost model overseas, which cushions the impact of short-term revenue dips on profitability. At group level, WYG delivered a c 15% increase in adjusted PBT to £2.2m, with FD EPS of 3.3p c 24% higher (including a larger tax credit y-o-y) and DPS of 0.5p, +67% (six times covered) on broadly comparable revenue to H115. H116 investment in working capital and acquisitions contributed to a c £9m reduction in net cash to £3.4m.
Faster pick-up in H2 and positive prospects
Group EBIT looks set to be more than double the H1 figure on our unchanged estimates (albeit with a different mix). A growing order book in all regions with positive public sector funding indicators among UK and EU agencies bodes well for business prospects in the short and medium term. While the contribution from international operations is something of a laggard currently, management emphasises their importance in a group context, flagging greater prospects relative to a still growing UK business.
Valuation: Order flow to drive estimates
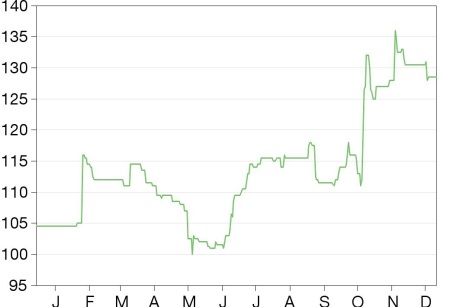
WYG’s share price moved up at the beginning of October – trading around the 130p level subsequently – and is now up c 26% ytd. On our estimates, the FY16e P/E and EV/EBITDA are 14.6x and 9.2x and, in our third forecast year, these measures are 10.7x and 6.9x respectively. Successfully converting prospects and pipeline into a rising order book on acceptable margins and the likely addition of further complementary consulting businesses are the key drivers of estimates rising towards management’s FY18 target of £15m PBT in our view.
H116: UK profit and regional order book development
We had expected H116 profitability to be in line with the previous year, but group PBT came in almost £0.3m (and c 15%) higher, with EPS up c 24% and DPS increased by two-thirds (to 0.5p, covered more than six times). Regional performance polarised in the period, with a strong UK uplift partly offset by reduced contributions from international operations, as had been flagged. FX movements had a £2-3m adverse impact on revenue and a negligible impact on profit. WYG ended H116 with £3.4m net cash (of which £2.6m was unrestricted) after a larger than usual working capital increase and further acquisition activity.
Exhibit 1: WYG – regional and interim splits
£m |
IAS19R |
Reported |
Order book as at Sept 2015** |
|||||
H115 |
H215 |
2015 |
H116 |
change (%) |
Total |
FY16 |
FY17 |
|
Group revenue* |
63.2 |
67.3 |
130.5 |
62.6 |
-0.9% |
123.4 |
46.1 |
77.3 |
UK |
40.0 |
43.9 |
83.9 |
46.2 |
15.4% |
60.9 |
29.1 |
31.8 |
EAA* |
15.6 |
14.8 |
30.4 |
10.9 |
-30.2% |
43.0 |
11.9 |
31.1 |
MENA |
7.5 |
8.6 |
16.1 |
5.5 |
-27.0% |
19.5 |
5.1 |
14.1 |
Group EBIT* |
2.1 |
3.7 |
5.8 |
2.2 |
8.4% |
|||
UK |
2.7 |
5.0 |
7.7 |
4.5 |
66.8% |
|||
EAA* |
0.7 |
0.9 |
1.6 |
-0.0 |
-100.7% |
|||
MENA |
0.6 |
-0.2 |
0.5 |
-0.2 |
-128.4% |
|||
Central |
-2.0 |
-1.9 |
-3.9 |
-2.1 |
5.6% |
|||
Source: WYG. Note: *Including H116 JV £0.3m turnover (H115 £0.9m, FY15 £1.8m) and £2k PAT (H115 £0.2m, FY15 £0.4m). **The group order book stood at £130m as at 30 November.
UK: The standout performer in H116
As Exhibit 1 shows, the UK operations generated a good increase in revenue, together with a strong EBIT uplift. WYG’s core project and cost management and planning and design consultancy services are applicable to both the creation and support of assets in a wide range of sectors. House building-related development (both private and social) has seen consistently good levels of demand in the last two years. WYG has added resource here and the recent Autumn Statement outlined ongoing UK government support here and for infrastructure projects. From a lower base, transport – including HS2 and highways improvement – has also been highlighted as a growing source of revenue, including a three-month contribution from FMW Consultancy (acquired in H116). There appears to have been a good spread of projects elsewhere in the education, defence and justice sectors, some as standalone contracts, others under ongoing framework agreements. We estimate that just over half of revenue was public sector funded and the remainder for private sector clients.
At the beginning of FY16, the UK order position for the year ahead was well above of that of the previous year (at c £43m and c £31m respectively). This flowed through into £42.6m H116 revenue, up 15.4% y-o-y, which was slightly more than we had anticipated. Moreover, the profit drop-through rate on incremental revenue at almost 30% was around double what we had expected. This led to a significant EBIT margin uplift of 300bp to 9.8%. WYG’s multidiscipline capability typically means that contracts can be substantially executed in house. Consequently, we believe that the margin expansion delivered reflects rising utilisation levels and/or improving mix in favour of more technical projects. Given that there will have been upward pressure on personnel costs (both through salary inflation and new hires), the margin performance is particularly notable and illustrates the operational gearing effects of good overall control of a relatively fixed cost base. There will also have been some benefit from acquisitions, ie an additional c 15 weeks contribution from Alliance Planning (September 2014) and a maiden three months from FMW Consultancy (June 2015). We estimate that the combined y-o-y uplift was c £1m in revenue terms and c £0.2m to EBIT.
As at the end of September, the UK order book stood at £60.9m, c 15% higher than the start of FY16. Split broadly equally between current year and subsequent years, both elements are well ahead of their equivalent levels a year ago (+17% and +36% respectively). Shortly after the period end, WYG announced the acquisition of North Associates (in October; £2.3m initial consideration, with further deferred payments of up to £2.7m in total over the next three years). This deal adds to WYG’s position in planning, particularly in the nuclear sector, but also enhances asset management activities, raising the profile of technical services offered on clients’ existing property estates.
EAA: Affected by slow EU budget transition
Headline reported figures showed a c 30% y-o-y reduction in revenue, with Europe, Africa & Asia (EAA) to £10.9m, breaking even compared to a £0.7m EBIT contribution last time. An understandably weaker performance from a Russian JV focusing on the mining and minerals sector accounted for just over 10% and one-third of the respective declines. Wholly owned operations saw revenue c £4m lower – £2-3m of which was FX related – and EBIT down almost £0.5m. Allowing for increased business development costs here (unquantified), we suggest that underlying trading in H116 was characterised by a slightly softer revenue and profit performance.
Most obviously, delayed transition to the new EU 2014-20 budget period led to a slowdown in project awards, as was also seen in H215. Some country activities (such as the multi-agency Western Balkans Investment Framework and the DFID’s climate resilience programme in Africa) continued to see funding released but others were impacted. The overall revenue performance comprised weaker overall contributions across the regions with some reorganisation activity having taken place in Central and Eastern Europe as a consequence.
In headline terms, the c £43m EAA order book at the end of September was similar to that at the beginning of FY16. While the current year element of this still appears relatively subdued (at c £12m), the value beyond this has increased markedly to c £31m (+26% since March and +81%
y-o-y). This is consistent with the view that EU budget inertia has eased and management’s assertion that that contract and bidding activity has increased. For example, WYG specifically mentioned wins with European Structural Funds (EU member countries projects) and EuropeAid (non-EU members), in addition to other development aid projects with the DFID. In the latter case, the UK government recently affirmed that it would maintain the overseas aid budget at 0.7% of GDP, with real growth expected between 2015 and 2020. We believe that international support for EU and non-EU member countries affected by developments in fragile states will translate to funding consistent with wider aid aims (eg regional stability, socioeconomic integration, infrastructure development). Although opportunities have not been explicitly highlighted by WYG, it clearly has strong credentials in these areas.
Middle East, North Africa (MENA): Focus on Turkey
As seen with EAA, the MENA region experienced a significant step down in revenue and profitability compared to the previous year. We believe that EU agencies are the leading clients and source of fee revenue. Consequently, WYG’s revenue will have been affected by similar funding inertia (and, to some extent, adverse £/€ rate movements) as in EAA. Turkey is the dominant country in this WYG division and a significant beneficiary of pre-EU accession funding. WYG has extended its portfolio of water and wastewater projects undertaken and has broadened this into both transport and social inclusion or integration project work. The latter included an €8.8m two-year contract win announced in October in addition to the £19.5m order book position recorded at the end of H116 (again with around three-quarters of this for FY17 and beyond). Ongoing tendering activity is also considered to be active. We see instability and conflict in this region generally as something of a double-edged sword for WYG’s operations; there is scope for business disruption, but also a strong likelihood of increased international aid and development funding. Turkey has a strategically important geo-political position and recent talks involving migrant flows and EU accession negotiations endorse this view.
Investing cash in acquisitions
WYG ended H116 in a £3.4m net cash position (of which £0.9m was restricted, ie tied into specific contracts) following a cash outflow of £8.9m over the first six months of the year. The primary elements of this were a £5.1m trading cash outflow, £2.5m acquisition consideration and £1.1m capex. Taking each of these in turn:
■
Trading cash flow (ie cash from operating activities): the underlying performance is somewhat masked by payments related to legacy items (chiefly property and PII provisions), which are typically captured in working capital movements and, in H116, the receipt of cash arising from separately disclosed items. We believe these aspects broadly cancelled each other out. Adjusting for this, the overall trading cash movement was the result of a c £8.1m working capital outflow more than absorbing c £3m EBITDA in the period. Investment in work in progress and debtors taken together was similar to the previous year (albeit with a different mix) and with a higher underlying trade creditor outflow from unwinding accruals on EU work.
■
Acquisitions: the outflow was attributable to initial consideration for FMW Consultancy (£1.1m, June) and a deferred £1.6m for Alliance Planning (September 2014, initial £1.6m).
■
Capex: no major items of spend were identified and the total investment was in line with that in H115 and compared to H116 depreciation and amortisation of internal intangibles of £0.85m.
Cash interest, tax and dividend payments were not material. (Note: the prior year final and current year interim dividends are both paid in the second half; in H216 this will be c £0.8m.)
Looking ahead, our higher implicit profit contribution in H2, together with an expected reduction in working capital by year end, translates into trading cash inflow of £4-5m for FY16 as a whole. In H216, a further £2.5m consideration is in our model currently (ie North Associates initial payment, acquired in October) with a similar amount in FY17 and c £0.5m in FY18, both being deferred cash on acquisitions already announced. Regarding capex, potential IT infrastructure spend of c £2m over two years has been flagged and included in our model across FY17 and FY18. Factoring in all of the above, we see WYG ending FY16 with net cash of c £8.0m. We expect FY17 to be broadly cash neutral before WYG becomes cash positive again overall in FY18, resulting in expected net cash of c £10m at the end of that year.
Mix change to estimates with positive medium-term outlook
In overall terms, our estimates are effectively unchanged save for a small increase in FY18 profit. This is the net result of rebalancing regional profit expectations between a higher UK contribution and a slower rate of increase in that from international operations in all three forecast years. These changes are based on the reported H116 performance, current order positions (for this year and next) and acquisition effects. In the UK, FMW and North Associates add c £5m annualised revenue and c £0.9m EBIT and we have also factored in a higher revenue run rate and margin expectation for the existing operations. For the EAA region, approaching half of the change to our regional EBIT estimate relates to a step down in expectations for the Russian JV (focused on mining and minerals) and the remainder reflecting a lower near-term order position. MENA has been adjusted to reflect H116 performance, with a modest change to FY17 expectations also. Note that we have increased our group dividend expectation (effectively pulling previous estimates forward by one year) based on the H116 declaration (with coverage in excess of 6x).
We should reiterate that our medium-term view is positive for all three reported regions based on the outlook for UK GDP and visible funding positions and programmes for WYG’s leading public sector agencies (ie several UK government departments and a number of different EU funds). Recent order intake has been very healthy. We accept that the company’s view of prospects based on its visible pipeline and current tender activity may be somewhat better than our estimates. We will continue to track order book trends by region.
Exhibit 2: Financial summary
£'ms |
2013 |
2014 |
2015 |
2016e |
2017e |
2018e |
||
March |
IFRS |
IFRS |
IFRS |
IFRS |
IFRS |
IFRS |
||
PROFIT & LOSS |
|
|
IAS19R |
IAS19R |
IAS19R |
IAS19R |
IAS19R |
IAS19R |
Revenue |
|
|
125.7 |
126.9 |
130.5 |
134.0 |
151.7 |
164.6 |
EBITDA |
|
|
3.3 |
6.4 |
7.2 |
9.0 |
10.4 |
11.8 |
Operating Profit (before GW and except.) |
1.5 |
4.8 |
5.4 |
7.2 |
8.6 |
10.0 |
||
Net Interest |
|
|
(0.8) |
(0.6) |
(0.1) |
(0.3) |
(0.4) |
(0.4) |
JV / Associates |
|
|
0.0 |
0.0 |
0.4 |
0.0 |
0.0 |
0.0 |
Intangible Amortisation |
|
|
(1.0) |
(1.2) |
(1.3) |
(1.5) |
(1.5) |
(1.5) |
Other |
|
|
(2.5) |
(3.7) |
(2.9) |
(1.0) |
(1.0) |
(1.0) |
Exceptionals |
|
|
(0.6) |
2.4 |
0.0 |
1.3 |
0.0 |
0.0 |
Profit Before Tax (norm) |
|
|
0.7 |
4.3 |
5.7 |
6.9 |
8.3 |
9.6 |
Profit Before Tax (FRS 3) |
|
|
(3.3) |
1.8 |
1.4 |
5.7 |
5.8 |
7.0 |
Tax |
|
|
(0.1) |
0.3 |
0.5 |
(0.7) |
(0.8) |
(0.9) |
Minorities |
|
|
0.0 |
0.0 |
0.0 |
0.0 |
0.0 |
0.0 |
Profit After Tax (norm) |
|
|
0.7 |
4.5 |
6.2 |
6.3 |
7.5 |
8.7 |
Profit After Tax (FRS 3) |
|
|
(3.4) |
2.1 |
1.9 |
5.0 |
5.0 |
6.1 |
|
|
|
|
|
|
|
|
|
Average Number of Shares Outstanding (m) |
|
64.5 |
64.6 |
65.8 |
69.8 |
68.4 |
68.4 |
|
EPS - normalised fully diluted (p) |
|
|
0.8 |
6.4 |
8.6 |
8.8 |
10.4 |
12.0 |
EPS - FRS 3 (p) |
|
|
(5.2) |
3.2 |
2.9 |
7.2 |
7.3 |
9.0 |
Dividend per share (p) |
|
|
0.0 |
0.5 |
1.0 |
1.5 |
1.7 |
1.9 |
|
|
|
|
|
|
|
|
|
EBITDA Margin (%) |
|
|
2.6 |
5.1 |
5.5 |
6.7 |
6.9 |
7.2 |
Operating Margin (before GW and except.) (%) |
1.2 |
3.8 |
4.1 |
5.4 |
5.7 |
6.1 |
||
|
|
|
|
|
|
|
|
|
BALANCE SHEET |
|
|
|
|
|
|
|
|
Fixed Assets |
|
|
18.6 |
19.8 |
22.0 |
24.4 |
26.4 |
26.4 |
Intangible Assets |
|
|
16.3 |
17.6 |
18.7 |
21.1 |
21.9 |
20.7 |
Tangible Assets |
|
|
2.4 |
2.2 |
2.3 |
2.5 |
3.7 |
4.8 |
Investments |
|
|
0.0 |
0.0 |
0.9 |
0.8 |
0.8 |
0.8 |
Current Assets |
|
|
66.8 |
60.0 |
54.6 |
56.0 |
58.6 |
64.6 |
Stocks |
|
|
20.2 |
21.6 |
21.1 |
20.9 |
23.7 |
25.7 |
Debtors |
|
|
23.0 |
18.5 |
18.5 |
23.0 |
23.0 |
24.9 |
Cash |
|
|
19.597 |
15.9 |
12.3 |
8.0 |
7.9 |
9.9 |
Current Liabilities |
|
|
(45.7) |
(42.9) |
(40.8) |
(42.6) |
(46.4) |
(49.9) |
Creditors |
|
|
(44.8) |
(42.3) |
(40.8) |
(42.6) |
(46.4) |
(49.9) |
Short term borrowings |
|
|
(0.953) |
(0.7) |
0.0 |
0.0 |
0.0 |
0.0 |
Long Term Liabilities |
|
|
(23.3) |
(16.9) |
(13.2) |
(10.0) |
(6.9) |
(4.4) |
Long term borrowings |
|
|
0.0 |
0.0 |
0.0 |
0.0 |
0.0 |
0.0 |
Other long term liabilities |
|
|
(23.3) |
(16.9) |
(13.2) |
(10.0) |
(6.9) |
(4.4) |
Net Assets |
|
|
16.4 |
20.1 |
22.5 |
27.8 |
31.7 |
36.7 |
|
|
|
|
|
|
|
|
|
CASH FLOW |
|
|
|
|
|
|
|
|
Operating Cash Flow |
|
|
(2.6) |
(0.1) |
2.4 |
4.5 |
7.2 |
7.7 |
Net Interest |
|
|
(0.8) |
(0.5) |
(0.1) |
(0.3) |
(0.4) |
(0.4) |
Tax |
|
|
(0.2) |
(0.0) |
(0.3) |
(1.0) |
(0.7) |
(0.8) |
Capex |
|
|
(1.3) |
(1.4) |
(1.7) |
(1.8) |
(2.8) |
(2.8) |
Acquisitions/disposals |
|
|
(0.8) |
(1.4) |
(1.6) |
(5.0) |
(2.5) |
(0.5) |
Financing |
|
|
(0.0) |
0.0 |
(0.2) |
0.0 |
0.0 |
0.0 |
Dividends |
|
|
0.0 |
0.0 |
(0.5) |
(0.8) |
(1.1) |
(1.1) |
Net Cash Flow |
|
|
(5.6) |
(3.3) |
(2.0) |
(4.4) |
(0.2) |
2.0 |
Opening net debt/(cash) |
|
|
(23.0) |
(18.6) |
(15.2) |
(12.3) |
(8.0) |
(7.9) |
HP finance leases initiated |
|
|
(0.0) |
0.0 |
0.0 |
0.0 |
0.0 |
0.0 |
Other |
|
|
1.3 |
(0.2) |
(0.9) |
0.0 |
(0.0) |
0.0 |
Closing net debt/(cash) |
|
|
(18.6) |
(15.2) |
(12.3) |
(8.0) |
(7.9) |
(9.9) |
Source: Company accounts, Edison Investment Research
|
Research: Investment Companies
The Biotech Growth Trust