Templeton Emerging Markets Investment Trust — Under-owned, undervalued & under-appreciated

Templeton Emerging Markets Investment Trust (LSE: TEM)

Last close As at 27/04/2024

GBP1.54

0.00 (0.00%)

Market capitalisation

GBP1,713m

More on this equity

Research: Investment Companies

Templeton Emerging Markets Investment Trust — Under-owned, undervalued & under-appreciated

Templeton Emerging Markets Investment Trust’s (TEMIT’s) co-managers Chetan Sehgal (lead manager) and Andrew Ness consider that the case for emerging markets is not well understood. Hence, they believe that the regions remain under-owned, undervalued and under-appreciated, which provides an interesting opportunity for global investors. There are several powerful trends supporting the superior economic growth prospects of emerging markets versus those in developed regions, including demographics, urbanisation, higher consumption and technological innovation. Emerging markets also remain relatively attractively valued. TEMIT’s performance versus the MSCI Emerging Markets Index troughed in April 2022 and is in a steadily improving trend. The trust’s results tend to be better when investors focus on company fundamentals, which drive equity returns over the long term, rather than considering near-term macroeconomic events.

Melanie Jenner

Written by

Mel Jenner

Director, Investment Trusts

Investment Companies

Templeton Emerging Markets IT

Under-owned, undervalued & under-appreciated

Investment trusts
Emerging markets equities

13 December 2023

Price

147.6p

Market cap

£1,659m

Total assets

£1,914m

NAV*

170.3p

Discount to NAV

13.3%

*Including income. At 11 December 2023.

Yield

3.4%

Ordinary shares in issue

1,124.1m

Code/ISIN

TEM/GB00BKPG0S09

Primary exchange

LSE

AIC sector

Global Emerging Markets

Financial year end

31 March

52-week high/low

164.6p

142.0p

NAV* high/low

185.1p

164.3p

*Including income

Net debt (at 31 October 2023)

0.0%

Fund objective

Launched in June 1989, Templeton Emerging Markets Investment Trust was one of the first emerging markets funds in the UK. The trust seeks long-term capital appreciation through investment in companies operating in emerging markets or listed on the stock markets of such countries. This may include companies that have a significant amount of their revenues in emerging markets but are listed on stock exchanges in developed countries. Performance is benchmarked against the MSCI Emerging Markets Index.

Bull points

Large, diversified fund run by two experienced managers, who are part of a well-resourced team of more than 75 investment professionals based in 13 countries around the world.

The fund is positioned for a rebound in consumption as emerging market monetary policies ease.

Relative performance is improving.

Bear points

Emerging markets can be more volatile than developed markets.

Modest absolute returns from emerging market equities over the last decade.

Stubbornly wide discount.

Analyst

Mel Jenner

+44 (0)20 3077 5700

Templeton Emerging Markets Investment Trust is a research client of Edison Investment Research Limited

Templeton Emerging Markets Investment Trust’s (TEMIT’s) co-managers Chetan Sehgal (lead manager) and Andrew Ness consider that the case for emerging markets is not well understood. Hence, they believe that the regions remain under-owned, undervalued and under-appreciated, which provides an interesting opportunity for global investors. There are several powerful trends supporting the superior economic growth prospects of emerging markets versus those in developed regions, including demographics, urbanisation, higher consumption and technological innovation. Emerging markets also remain relatively attractively valued. TEMIT’s performance versus the MSCI Emerging Markets Index troughed in April 2022 and is in a steadily improving trend. The trust’s results tend to be better when investors focus on company fundamentals, which drive equity returns over the long term, rather than considering near-term macroeconomic events.

Higher growth potential in emerging markets

Source: International Monetary Fund World Economic Outlook October 2023 data, Edison Investment Research. Note: p is projected.

Why consider TEMIT?

Looking at a range of TEMIT’s quality, growth and valuation factors, the trust could be considered as a ‘quality value’ fund. This ties in with the managers’ approach of seeking companies with sustainable earnings growth potential that are trading at a discount to their intrinsic values. When required, they can draw on the resources of Franklin Templeton’s large, locally based emerging markets investment team.

TEMIT’s portfolio is actively managed, and bottom-up stock selection means that industry and geographic allocations are differentiated from those of the benchmark. The trust’s largest overweight sector is technology, while its largest underweights are consumer staples and utilities, which are both defensive. This suggests that the trust should be well positioned for an economic recovery.

As a result of economic uncertainty and macroeconomic events in recent years, investor risk aversion is elevated. This is reflected in TEMIT’s double-digit 13.3% discount, which is wider than the trust’s historical averages. There is significant scope for TEMIT to be afforded a higher valuation if investors become more interested in the positive growth and valuation attributes of emerging markets and/or the trust’s relative performance continues to improve.

TEMIT: Broad EM exposure from a well-resourced team

When required, TEMIT’s managers can draw on the deep resources of Franklin Templeton, which is the sixth-largest independent asset manager in the world with more than £1tn of assets under management. The company has been investing in emerging markets for more than 35 years and its emerging markets team of 75+ investment professionals research more than 700 securities. Franklin Templeton views its local presence in 13 emerging market countries as a competitive advantage in terms of building relationships and gaining valuable insights.

TEMIT’s managers seek to capitalise on long-term structural opportunities by identifying companies with sustainable earnings power that are trading at a discount to their intrinsic worth. ESG analysis is an integral part of the investment process.

Looking over the long term, from the date of TEMIT’s launch in June 1989 to end H124 (30 September 2023), the trust’s NAV total return of +3,832.7% is substantially higher than the benchmark’s +1,698.1% total return.

Why emerging markets?

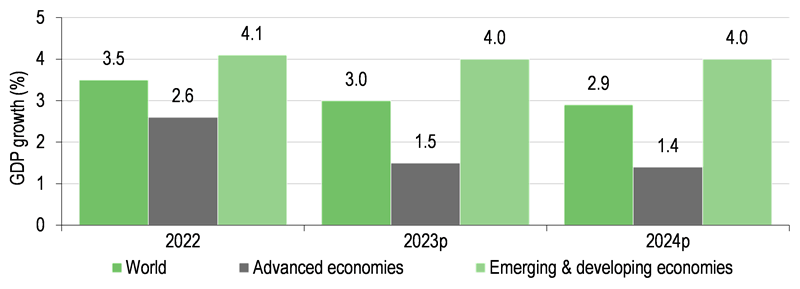
Four important trends in emerging markets contribute to their above-average economic growth potential: favourable demographics, the continued shift towards urbanisation, higher consumption helped by a rising middle class and technological innovation.

Emerging market institutions have made policy improvements. Despite shocks within the US and European banking sectors earlier in 2023, emerging markets’ banking systems have generally been more resilient. This is due to a more conservative approach in response to prior periods of stress such as the 1997–98 Asian financial crisis. Historically, emerging markets were sources of commodities and inexpensive manufacturing. This has shifted to higher demand for premium products and increased technology penetration in the regions. In terms of innovation, some emerging market technology companies have leapfrogged over their developed market peers to become global leaders, such as Taiwan Semiconductor Manufacturing Company, which is the world's largest contract manufacturer of semiconductor chips.

Data from Franklin Templeton show that from January 2008 to December 2022, average annualised rolling five-year total returns in emerging markets were 7.3%. The largest contributor at 5.4% was earnings growth, with dividends contributing 2.7% and higher valuations 0.6%. The combined 8.7% was partially offset by a 1.4% drag from currency movements.

Exhibit 1: Market performance and valuation

Performance of indices in £ (last five years)

Valuation of MSCI indices (at 30 November 2023)

Source: Refinitiv, MSCI, Edison Investment Research

In terms of performance over the last five years (Exhibit 1, left-hand side), both emerging markets and the UK have woefully lagged the performance of the world market. However, a large part of this is due to the outperformance of the US, which dominates global indices (70% of the MSCI World Index). The shares of large-cap US technology companies have performed particularly well, although there is no guarantee that this will continue. A shift in investor preferences towards markets/sectors that have lagged in recent years could be beneficial for the performance of emerging market stocks.

Emerging market shares continue to look very attractively valued versus their global peers (Exhibit 1, right-hand side). On a forward P/E basis at the end of October 2023, the MSCI Emerging Market Index was around 30% less expensive than the MSCI World Index and offered a higher dividend yield.

TEMIT versus the MSCI Emerging Markets Index

Comparing TEMIT with the benchmark in Exhibit 2, in terms of quality attributes it generates better returns and a has higher net margin, but a modestly lower operating margin than the MSCI Emerging Markets Index. Looking at forward EPS estimates, the trust has a lower growth profile, but is more attractively valued on multiple metrics, while offering a modestly higher dividend yield. Taken in aggregate, TEMIT could be considered as a ‘quality value fund’, which has potential to perform well in a variety of market environments, although it is likely to struggle in a market led by highly valued growth stocks or deep-value cyclical names.

Exhibit 2: Portfolio versus the benchmark (at 31 October 2023)

TEMIT’s portfolio

Benchmark

Quality

Return on assets (%)

9.6

8.5

Return on equity (%)

19.5

17.8

Return on invested capital (%)

14.3

13.4

Operating margin (%)

19.6

20.5

Net margin (%)

19.9

17.5

Net debt to equity (ex-banks, x)

0.8

20.3

Growth

Last 3-year sales growth (%)

17.6

18.7

Last 3-year EPS growth (%)

22.6

17.4

Estimated 3–5-year EPS growth (%)

11.3

14.9

Valuation

12-month trailing P/E (x)

10.0

11.8

Price-to-cash flow (x)

5.1

6.0

Price-to-book (x)

1.3

1.5

Dividend yield (%)

3.3

3.1

Source: TEMIT

Current portfolio breakdown

TEMIT offers investors a broad and differentiated emerging markets exposure. At 30 September 2023, 34 distinct names representing 21% of the portfolio were not held by its major peers. Also, the fund had 30 names that are not represented in its benchmark and made up 17% of the fund.

Exhibit 3: Top 10 holdings (at 31 October 2023)

Company

Country

Sector

Portfolio weight %

31 Oct 2023

31 Oct 2022*

Taiwan Semiconductor Manufacturing Co

Taiwan

Semiconductors & semi equip

10.5

9.6

Samsung Electronics

South Korea

Technology hardware & equip

5.6

6.6

ICICI Bank

India

Banks

5.5

7.0

Alibaba Group Holding

China

Retailing

5.0

4.4

Petroleo Brasileiro (Petrobras)

Brazil

Energy

3.2

3.0

Naver Corporation

South Korea

Media & entertainment

3.1

2.9

Tencent Holdings

China

Media & entertainment

3.0

3.2

Samsung Life Insurance

South Korea

Insurance

2.8

N/A

Prosus

China

Retailing

2.7

N/A

LG Corporation

South Korea

Capital goods

2.5

2.9

Top 10 (% of portfolio)

43.9

46.1

Source: TEMIT, Edison Investment Research. Note: *N/A where not in October 2022 top 10.

At end-October 2023, TEMIT’s top 10 holdings, across a range of countries and sectors, made up 43.9% of the portfolio, which was a lower concentration compared with 46.1% 12 months earlier; eight positions were common to both periods.

The trust has exposure across the market cap spectrum. At end-October 2023, the portfolio was broken down as follows: market cap above $50bn (44.9%); $25–50bn (8.4%); $10–25bn (16.4%); $5–10bn (15.5%); $2–5bn (6.4%) and less than $2bn (8.4%).

There is a new position in the fund: Hypera (formerly known as Hypermarcas) is a leading Brazilian pharmaceutical company that sells prescription, generic and over-the-counter medicines as well as consumer health products. Brazil’s ageing population is a positive growth driver for its pharma industry. Hypera has a portfolio of well-known brands and a good record of new product launches, along with robust cash generation and a strong balance sheet.

TEMIT’s sector and geographic weightings are a result of bottom-up stock selection. As shown in Exhibit 5, over the 12 months to the end of October 2023, the largest changes in the trust’s sector exposure were higher weightings in industrials (+3.8pp) and healthcare (+2.5pp), with lower allocations to financials (-2.4pp) and materials (-2.1pp). In terms of active positioning versus the benchmark, IT remained the largest overweight (+5.8pp), while the largest underweight was consumer staples (-3.4pp).

Exhibit 4: TEMIT’s sector weights versus the benchmark (at end-October 2023)

Source: TEMIT, Edison Investment Research. Note: Excludes other net assets.

Exhibit 5: Portfolio sector changes and active weights versus benchmark (% unless stated)

Portfolio
end-Oct 2023

Portfolio
end-Oct 2022

Change
(pp)

Active weight
vs index (pp)

Information technology

26.4

28.2

(1.8)

5.8

Financials

25.2

27.6

(2.4)

2.7

Consumer discretionary

12.1

12.5

(0.4)

(1.5)

Communication services

9.2

8.0

1.2

(0.2)

Industrials

8.4

4.6

3.8

2.0

Materials

6.2

8.3

(2.1)

(1.6)

Healthcare

4.4

1.9

2.5

0.4

Energy

3.5

3.4

0.1

(1.8)

Consumer staples

2.9

3.7

(0.8)

(3.4)

Utilities

0.5

0.0

0.5

(2.1)

Real estate

0.4

0.4

0.0

(1.3)

Other net assets

0.7

1.4

(0.7)

0.7

100.0

100.0

Source: TEMIT, Edison Investment Research. Note: Numbers subject to rounding.

Looking at TEMIT’s geographic breakdown in Exhibit 7, the largest country weighting is China, although the fund has an underweight position versus the benchmark (-4.3pp). Over the 12 months to the end of October 2023, the largest changes are a higher weighting to China (+2.0pp) and a lower allocation to Brazil (-2.1pp). The largest active weights are an above-index allocation to South Korea (+8.2pp) and below-index allocation to ‘the rest of the world’ (-9.4pp).

Exhibit 6: TEMIT’s geographic weights versus the benchmark (at end-October 2023)

Source: TEMIT, Edison Investment Research. Note: Excludes net other assets.

Exhibit 7: Portfolio geographic changes and active weights vs benchmark (% unless stated)

Portfolio
end-Oct 2023

Portfolio
end-Oct 2022

Change
(pp)

Active weight
vs index (pp)

China

25.6

23.6

2.0

(4.3)

South Korea

20.0

19.6

0.4

8.2

Taiwan

14.9

14.3

0.6

(0.2)

India

13.0

13.5

(0.5)

(2.9)

Brazil

9.4

11.5

(2.1)

4.0

US

3.3

4.2

(0.9)

3.3

Thailand

2.5

2.7

(0.2)

0.6

Rest of the world

10.6

9.2

1.4

(9.4)

Other net assets

0.7

1.4

(0.7)

0.7

100.0

100.0

Source: TEMIT, Edison Investment Research. Note: Numbers subject to rounding.

Performance: Building on a positive relative record

TEMIT is a member of the AIC Global Emerging Markets sector. In Exhibit 8, we exclude the specialist funds to enable a more relevant comparison. TEMIT is the largest of the selected peers by a considerable margin. Its NAV total return is above average over the last 12 months, ranking third out of five funds and broadly in line over the last decade, ranking third out of four funds.

Exhibit 8: Selected emerging markets peer group at 12 December 2023*

% unless stated

Market cap (£m)

NAV TR
1 year

NAV TR
3 year

NAV TR
5 year

NAV TR
10 year

Discount (cum fair)

Ongoing charge

Perf.
fee

Net gearing

Dividend yield

Templeton Emerging Mkts Inv Trust

1,659.2

5.3

(15.5)

20.6

74.3

(13.5)

1.0

No

100

3.4

Fidelity Emerging Markets

537.7

1.3

(27.2)

(1.1)

34.8

(11.4)

0.8

No

100

2.7

JPMorgan Emerging Markets Inv Tr

1,163.9

(0.6)

(12.7)

28.6

109.0

(10.1)

0.9

No

103

1.6

JPMorgan Global Emerging Mkts Inc

360.5

5.4

1.1

31.6

81.6

(12.5)

0.9

No

109

4.3

Mobius Investment Trust

151.8

12.6

30.0

49.2

(8.9)

1.5

No

100

0.9

Average (5 funds)

774.6

4.8

(4.8)

25.8

74.9

(11.3)

1.0

102

2.6

TEMIT rank in peer group

1

3

4

4

3

5

4

3=

2

Source: Morningstar, Edison Investment Research. Note: *Performance at 12 December 2023 based on ex-par NAVs. TR, total return. Net gearing is total assets less cash and equivalents as a percentage of net assets.

TEMIT’s managers consider the trust’s closest peers are Fidelity Emerging Markets and JPMorgan Emerging Markets Investment Trust. Comparing their NAV total returns, TEMIT ranks first over the last 12 months and second over the last three, five and 10 years. The managers suggest that Franklin Templeton’s large and globally diversified emerging markets equity team is able to identify local opportunities that may be overlooked by its peers.

Most of the funds in the selected peer group are currently trading on double-digit discounts during a period of heightened investor risk aversion; TEMIT’s discount is the widest. The trust has an average ongoing charge, and in line with its peers no performance fee is payable. TEMIT is one of three funds that is currently ungeared. The trust has an above-average dividend yield, ranking second and is 0.8pp above the mean.

Exhibit 9: Five-year discrete performance data

12 months ending

Share price
(%)

NAV
(%)

MSCI Emerging
Markets (%)

MSCI World
(%)

CBOE UK All Companies (%)

30/11/19

15.1

14.1

6.2

13.6

11.3

30/11/20

18.3

16.4

15.1

11.5

(11.2)

30/11/21

(0.8)

0.4

4.0

23.4

17.1

30/11/22

(13.2)

(10.9)

(7.9)

(0.5)

7.9

30/11/23

3.1

3.3

(1.6)

6.8

1.5

Source: Refinitiv. Note: All % on a total return basis in pounds sterling.

Exhibit 10: Investment trust performance to 30 November 2023

Price, NAV and benchmark total return performance, one-year rebased

Price, NAV and benchmark total return performance (%)

Source: Refinitiv, Edison Investment Research. Note: Three-, five- and 10-year performance figures annualised.

TEMIT’s relative returns are shown in Exhibit 11. It is ahead of its benchmark over the last one, five and 10 years in both NAV and share price terms. The trust’s relative performance is steadily improving, having troughed in April 2022.

Over the last year, positive contributors to TEMIT’s relative performance include: Posco Holdings (South Korea, steel maker); Taiwan Semiconductor Manufacturing Company (Taiwan, semiconductor manufacturer); and Petrobras (Brazil, oil producer). Conversely, positions that have detracted from the trust’s performance include: Guangzhou Tinci Materials Technology Company (China, cosmetic materials manufacturer); non-index name Genpact (India, professional services provider); and Branco Bradesco (Brazil, bank).

Exhibit 11: Share price and NAV total return performance, relative to indices (%)


One month

Three months

Six months

One year

Three years

Five years

10 years

Price relative to MSCI Emerging Markets

0.1

(0.4)

1.0

4.7

(5.9)

4.8

1.5

NAV relative to MSCI Emerging Markets

0.3

0.0

0.8

4.9

(2.1)

6.3

3.5

Price relative to MSCI World

(1.2)

(1.0)

(2.7)

(3.5)

(32.4)

(27.3)

(44.5)

NAV relative to MSCI World

(0.9)

(0.5)

(3.0)

(3.3)

(29.6)

(26.3)

(43.4)

Price relative to CBOE UK All Companies

0.9

0.3

2.2

1.6

(30.8)

(4.6)

2.5

NAV relative to CBOE UK All Companies

1.2

0.8

1.9

1.8

(28.0)

(3.3)

4.6

Source: Refinitiv, Edison Investment Research. Note: Data to end-November 2023. Geometric calculation.

TEMIT’s upside/downside capture

Exhibit 12 shows TEMIT’s upside/downside capture over the last 10 years. Its upside capture of 110% is the same as its downside capture, which suggests that the fund will modestly outperform its benchmark in months when emerging market share prices rally and underperform to a similar degree during months of emerging market share price weakness.

Exhibit 12: TEMIT’s upside/downside capture

Source: Refinitiv, Edison Investment Research. Note: Cumulative upside/downside capture calculated as the geometric average NAV total return (TR) of the fund during months with positive/negative reference index TRs, divided by the geometric average reference index TR during these months. A 100% upside/downside indicates that the fund's TR was in line with the reference index’s during months with positive/negative returns. Data points for the initial 12 months have been omitted in the exhibit due to the limited number of observations used to calculate the cumulative upside/downside capture ratios.

General disclaimer and copyright

This report has been commissioned by Templeton Emerging Markets Investment Trust and prepared and issued by Edison, in consideration of a fee payable by Templeton Emerging Markets Investment Trust. Edison Investment Research standard fees are £60,000 pa for the production and broad dissemination of a detailed note (Outlook) following by regular (typically quarterly) update notes. Fees are paid upfront in cash without recourse. Edison may seek additional fees for the provision of roadshows and related IR services for the client but does not get remunerated for any investment banking services. We never take payment in stock, options or warrants for any of our services.

Accuracy of content: All information used in the publication of this report has been compiled from publicly available sources that are believed to be reliable, however we do not guarantee the accuracy or completeness of this report and have not sought for this information to be independently verified. Opinions contained in this report represent those of the research department of Edison at the time of publication. Forward-looking information or statements in this report contain information that is based on assumptions, forecasts of future results, estimates of amounts not yet determinable, and therefore involve known and unknown risks, uncertainties and other factors which may cause the actual results, performance or achievements of their subject matter to be materially different from current expectations.

Exclusion of Liability: To the fullest extent allowed by law, Edison shall not be liable for any direct, indirect or consequential losses, loss of profits, damages, costs or expenses incurred or suffered by you arising out or in connection with the access to, use of or reliance on any information contained on this note.

No personalised advice: The information that we provide should not be construed in any manner whatsoever as, personalised advice. Also, the information provided by us should not be construed by any subscriber or prospective subscriber as Edison’s solicitation to effect, or attempt to effect, any transaction in a security. The securities described in the report may not be eligible for sale in all jurisdictions or to certain categories of investors.

Investment in securities mentioned: Edison has a restrictive policy relating to personal dealing and conflicts of interest. Edison Group does not conduct any investment business and, accordingly, does not itself hold any positions in the securities mentioned in this report. However, the respective directors, officers, employees and contractors of Edison may have a position in any or related securities mentioned in this report, subject to Edison's policies on personal dealing and conflicts of interest.

Copyright: Copyright 2023 Edison Investment Research Limited (Edison).

Australia

Edison Investment Research Pty Ltd (Edison AU) is the Australian subsidiary of Edison. Edison AU is a Corporate Authorised Representative (1252501) of Crown Wealth Group Pty Ltd who holds an Australian Financial Services Licence (Number: 494274). This research is issued in Australia by Edison AU and any access to it, is intended only for "wholesale clients" within the meaning of the Corporations Act 2001 of Australia. Any advice given by Edison AU is general advice only and does not take into account your personal circumstances, needs or objectives. You should, before acting on this advice, consider the appropriateness of the advice, having regard to your objectives, financial situation and needs. If our advice relates to the acquisition, or possible acquisition, of a particular financial product you should read any relevant Product Disclosure Statement or like instrument.

New Zealand

The research in this document is intended for New Zealand resident professional financial advisers or brokers (for use in their roles as financial advisers or brokers) and habitual investors who are “wholesale clients” for the purpose of the Financial Advisers Act 2008 (FAA) (as described in sections 5(c) (1)(a), (b) and (c) of the FAA). This is not a solicitation or inducement to buy, sell, subscribe, or underwrite any securities mentioned or in the topic of this document. For the purpose of the FAA, the content of this report is of a general nature, is intended as a source of general information only and is not intended to constitute a recommendation or opinion in relation to acquiring or disposing (including refraining from acquiring or disposing) of securities. The distribution of this document is not a “personalised service” and, to the extent that it contains any financial advice, is intended only as a “class service” provided by Edison within the meaning of the FAA (i.e. without taking into account the particular financial situation or goals of any person). As such, it should not be relied upon in making an investment decision.

United Kingdom

This document is prepared and provided by Edison for information purposes only and should not be construed as an offer or solicitation for investment in any securities mentioned or in the topic of this document. A marketing communication under FCA Rules, this document has not been prepared in accordance with the legal requirements designed to promote the independence of investment research and is not subject to any prohibition on dealing ahead of the dissemination of investment research.

This Communication is being distributed in the United Kingdom and is directed only at (i) persons having professional experience in matters relating to investments, i.e. investment professionals within the meaning of Article 19(5) of the Financial Services and Markets Act 2000 (Financial Promotion) Order 2005, as amended (the "FPO") (ii) high net-worth companies, unincorporated associations or other bodies within the meaning of Article 49 of the FPO and (iii) persons to whom it is otherwise lawful to distribute it. The investment or investment activity to which this document relates is available only to such persons. It is not intended that this document be distributed or passed on, directly or indirectly, to any other class of persons and in any event and under no circumstances should persons of any other description rely on or act upon the contents of this document.

This Communication is being supplied to you solely for your information and may not be reproduced by, further distributed to or published in whole or in part by, any other person.

United States

Edison relies upon the "publishers' exclusion" from the definition of investment adviser under Section 202(a)(11) of the Investment Advisers Act of 1940 and corresponding state securities laws. This report is a bona fide publication of general and regular circulation offering impersonal investment-related advice, not tailored to a specific investment portfolio or the needs of current and/or prospective subscribers. As such, Edison does not offer or provide personal advice and the research provided is for informational purposes only. No mention of a particular security in this report constitutes a recommendation to buy, sell or hold that or any security, or that any particular security, portfolio of securities, transaction or investment strategy is suitable for any specific person.

London │ New York │ Frankfurt

20 Red Lion Street

London, WC1R 4PS

United Kingdom

London │ New York │ Frankfurt

20 Red Lion Street

London, WC1R 4PS

United Kingdom

More on Templeton Emerging Markets Investment Trust

View All

Latest from the Investment Companies sector

View All Investment Companies content

Research: Consumer

Elior Group — So far, so good

Elior’s turnround is gathering pace with a near doubling of target recurring annual EBITDA synergies (€56m vs €30m) by 2026 following its April 2023 integration with Derichebourg (DMS). Also, with deleveraging the priority, net debt/EBITDA is expected by management to fall from 5.4x in FY23 to 4x in the current year and below 3x in FY26. Current momentum in terms of pricing, cost control, cross-selling and voluntary contract exits as well as an easing of inflationary pressures look to justify this confidence, with FY24 guidance of c 2.5% adjusted EBITA margin (up from normalised 1.9%) and organic revenue growth of 4–5% (focus on profit, not volume). Consensus FY24e EV/EBITDA of 5.9x reflects the early stage of recovery and lower guidance for H223 rather than potential upside from a turnround.

Continue Reading
Elior Banner

Subscribe to Edison

Get access to the very latest content matched to your personal investment style.

Sign up for free