Last close As at 15/08/2026
GBP0.86
▲ 0.45 (0.53%)
Market capitalisation
GBP1,174m
Research: Real Estate
Supermarket Income REIT’s (SUPR’s) high-quality, omnichannel-focused portfolio is very well positioned to benefit from strong growth trends in the grocery sector. Moreover, with supermarket property yields remaining elevated and interest rates widely forecast to decline, SUPR has begun to deploy available debt capital into accretive acquisitions to support further fully covered DPS growth. This includes a first investment in France, where, like the UK, online grocery sales are growing strongly.
Supermarket Income REIT |
The next stage of growth |
Post-H124 results update |
Real estate |
10 July 2024 |
Share price performance
Business description
Next events
Analyst
Supermarket Income REIT is a research client of Edison Investment Research Limited |
|||||||||||||||||||||||||||||||||||||||||||||||||
Supermarket Income REIT’s (SUPR’s) high-quality, omnichannel-focused portfolio is very well positioned to benefit from strong growth trends in the grocery sector. Moreover, with supermarket property yields remaining elevated and interest rates widely forecast to decline, SUPR has begun to deploy available debt capital into accretive acquisitions to support further fully covered DPS growth. This includes a first investment in France, where, like the UK, online grocery sales are growing strongly.
Year |
Rental |
Adjusted EPRA |
Adjusted EPRA |
NAV**/ |
DPS |
P/NAV |
Yield |
06/23 |
95.2 |
72.4 |
5.8 |
93 |
6.00 |
0.80 |
8.1 |
06/24e |
107.4 |
75.5 |
6.1 |
89 |
6.06 |
0.83 |
8.2 |
06/25e |
116.5 |
77.4 |
6.2 |
94 |
6.12 |
0.79 |
8.3 |
06/26e |
119.6 |
77.5 |
6.2 |
97 |
6.20 |
0.77 |
8.4 |
Note: *Adjusted EPRA EPS is normalised, excluding gains on revaluation and other non-recurring items. **NAV is EPRA net tangible assets (NTA) throughout this report.
Widening growth opportunities
Since reporting a strong H124 financial performance, SUPR has deployed c £100m of available debt capital, from its strong balance sheet, in accretive acquisitions in the UK and France. The €75m acquisition of a portfolio of 17 omnichannel stores operated by Carrefour accounts for c 4% of rent roll, but provides a foothold in the large and growing European market, anchored to a strong tenant covenant. In the UK, SUPR sees the most attractive opportunities in acquiring good-quality stores, let to strong covenant operators (such as Tesco or Sainsbury’s), with the potential to create value through lease regears. These can provide attractive yields to support DPS growth and allow the investment adviser to leverage its market information advantage to better underwrite the risks versus many other investors. We estimate that that SUPR can deploy a further c £100m of available debt capital while remaining within the 40% upper limit of its loan to value ratio (LTV) range.
Well positioned in a structurally supported sector
The UK grocery sector is experiencing strong turnover growth, a key driver of supermarket rents. With a focus on omnichannel stores, straddling both the largest and fastest-growing segments of the market, SUPR is well placed to benefit. Moreover, larger operators such as Tesco and Sainsbury’s, together representing c 80% of SUPR’s UK rent roll, have been gaining market share. With an average rent/store turnover ratio of 3.8% (market average 4%), SUPR’s stores are affordable, underpinning long-term income and capital values. The clear yield premium of supermarket properties to the broad property sector, their defensive characteristics and the prospect of interest rate declines are positive indicators that yields have at least stabilised.
Valuation: Well-supported income visibility
There are no material changes to our forecast adjusted earnings, although our NAV estimates decline in line with H124. The prospective yield is 8.2% and the shares trade at a 16% discount to H124 NAV of 88p.
SUPR’s portfolio is well aligned with growth trends in a structurally supported sector
SUPR’s investment proposition is based primarily on robust and visible income growth from long (c 13 years weighted average lease length) upward-only, mostly inflation-linked leases with strong tenants. The UK grocery market is experiencing strong growth and, although SUPR does not benefit directly from this growth (its rents are not tied to store turnover), it underpins the visibility and sustainability of its income growth, capital values and sustainable long-term returns.
■
Strong UK grocery market growth. Grocery market revenues have increased by 35% or £65bn since SUPR listed in 2017, from £185bn to an estimated £250bn in 2024. This growth has been spread across a range of sales formats, but the largest single contributor has been omnichannel stores. Significantly, omnichannel store growth has been primarily organic (more sales through existing stores), with just one net new opening in the period. The second largest contributor to growth, discount stores, has been driven by new store openings, numbering almost 600 (net) in the same period. Discounter store openings slowed materially in 2023. SUPR attributes this to increased development costs and a lack of available sites and believes it may be a sign of the segment reaching its market share maturity.
■
Omnichannel sales increasing share. It is estimated that c 80% of online sales in the UK are fulfilled through omnichannel stores, mostly through the larger store format. SUPR’s focus on omnichannel stores thus provides exposure to the largest single grocery sales channel and the fastest-growing segment. Incumbents such as Tesco and Sainsbury’s have recently gained market share, with both experiencing stronger than average growth in their large store formats.
■
Store revenues drive market rental growth. With UK supermarket rents typically averaging c 4% of turnover (the average for SUPR is 3.8%), SUPR expects market rent growth to accelerate, particularly for well-performing, large-format omnichannel stores amid the dearth of suitable sites that are available for new openings. Most (78%) of SUPR’s rents are indexed to inflation, with upward-only reviews capped at an average of 4%, and so market rental growth has no immediate, direct impact on rental income. It does, however, increase the portfolio estimated rental value (ERV), which is very beneficial to SUPR. ERV growth mitigates the risk of stores with index-linked rent reviews becoming ‘over-rented’2 versus market rents, which in turn supports the level of rents negotiated in lease re-gears,3 residual values4 and the portfolio’s capital growth prospects.
1 Where contracted rents are above the level that would be achieved if let at market levels.
2 The renegotiation of an existing lease’s terms, ahead of maturity. Typically this involves an extended term and rent re-base, up or down.
3 The projected value ascribed to the property at lease maturity.
■
Strong tenants and mission-critical stores. SUPR’s focus on high-quality, ‘mission-critical’ omnichannel stores, predominantly let to the leading UK grocery operators, is very well aligned with grocery market development. 93% of its stores are omnichannel and 77% are let to Tesco (48%) and Sainsbury’s (29%), well ahead of their combined grocery market shares of c 44%, up by two percentage points in the past six months. The portfolio weighted average lease length is 13 years, within which there is a wide range of maturities, the shortest of which is six years and the longest of which is 98 years. The investment adviser (Atrato) has specialist sector knowledge and deep industry connections, which strongly support its ability to create value from the regearing of leases, on existing and acquired assets alike.
■
First investment in France opens up new growth potential. Carrefour represents a new and strong tenant covenant for SUPR and the French market is experiencing a similar structural shift towards omnichannel grocery distribution to that in the UK. Although the recently acquired assets represent a small part of the portfolio (we estimate c 4% of rent roll), the opportunity for further growth is very material. Carrefour is targeting a three-fold increase in its online sales, to €10bn by 2026. SUPR estimate the addressable investment market in Europe5 to be more than twice that in the UK.
4 SUPR’s estimate is based on data for Spain, Portugal, France, Germany and the Benelux.
SUPR has begun its next stage of growth
Since listing in 2017, SUPR has built a £1.8bn portfolio, through a disciplined acquisition strategy, focused on its chosen omnichannel market segment. After a recent pause in growth, reflecting financial and economic uncertainty, it made clear with its H124 results that it viewed market conditions as once again favourable for it to deploy its strong balance sheet for the ‘next stage of growth’. In particular, it cited increasingly attractive investment yields, the market expectation that interest rates will soon fall, and the positive impact of grocery sales growth on store rental values. It has since invested c £35m (before costs) in the UK and c £64m (before costs) in a portfolio of 17 stores operated by Carrefour in France, its first investment outside of the UK. If it were to increase LTV back towards the higher end of its 30–40% medium-term range, it would have additional available debt capacity of up to c £100m.
Accretive Carrefour acquisition with significant strategic potential
In late April, SUPR acquired a portfolio of 17 omnichannel supermarkets in a sale and leaseback transaction with Carrefour, the second largest grocery retailer France, with a global presence in 30 countries across Europe, Asia and South America, and annual turnover of more than €90bn (c £80bn). The transaction is immediately accretive to earnings, with a wider yield spread over funding costs than would be available in the UK for comparable assets let to a similarly strong covenant and is a continuation of SUPR’s strategy of investing in ‘the future model of grocery’.
The Carrefour stores operate under the ‘Carrefour Market’ brand.6 SUPR says they have a long history of successful trading and form a key part of Carrefour’s ‘Drive’ online grocery fulfilment network in their local catchment areas. They are geographically spread in France, with a weighting to the norther parts, and the stores have an average gross internal area of c 40,000 sq ft, which is towards the upper end of the size range for the Carrefour Market format.
5 In terms of size, Carrefour Market stores are positioned between the convenience store formats and hypermarkets, and offer a wide range of groceries and fresh products, as well as a selected range of non-food products.
The portfolio was acquired for €75.3m (c £65m), before acquisition costs, which represents a net initial yield of 6.3%. Store rents are reviewed annually and are inflation-linked without caps. The weighted average lease term is 12 years (with a tenant-only break option in year 10).
SUPR has initially drawn €81.7m (c £70m) from its existing revolving credit facility with HSBC, at a margin of 1.7% over Euribor, the European benchmark bank lending rate, which is currently c 3.7%. The transaction generates an accretive positive spread from day one, which SUPR expects to lock in with longer dated borrowings at a similar rate or better. This positive spread will further increase with rental growth.
Identified UK opportunities
Supermarket property yields continued to widen in 2023, including a further increase in Q423, in common with the broader UK commercial property market. MSCI data as at end-H124 indicate an average 6.4% net initial yield for the supermarket property sector as a whole, although this broad group includes weaker performing stores and stores let to some of the weaker tenant covenants. SUPR’s tighter average portfolio yield of 5.8% reflects its portfolio weighting to strong trading Tesco and Sainsbury’s stores. Both the sector yield and the SUPR portfolio yield are well ahead of the 5.1% broad property market yield, as well as the 4.7% yield for logistics assets. Logistics assets continue to be viewed positively by investors, not least for their exposure to structural growth trends in online purchasing and the positive outlook for rental growth.
In seeking to deploy capital, SUPR is not simply targeting opportunities where the acquisition yields are accretive to earnings, but also intends to maintain the covenant strength of its portfolio, and this selectivity narrows its available options. Although supermarket yields have generally widened, investor demand, for the better assets and stronger covenants in particular, has remained strong. In stark contrast to the broad commercial property market, 2023 was a record year for supermarket property transactions. These amounted to £2.1bn, with operator sale and leaseback activity accounting for more than half, including one large £650m transaction undertaken by Asda.
Attractive regear opportunities
In current market conditions, SUPR sees the most attractive opportunities in acquiring good-quality, ‘overrented’ stores, let to strong covenant operators (such as Tesco or Sainsbury’s), with relatively shorter lease terms, and the potential to create value through lease regears. Stores that are perceived by many investors to be overrented generally trade at a discount to those that are considered to have rents in line with ‘the market level’. SUPR believes that considerable value can be created if the regear risks can be accurately assessed and the expected cash flows correctly modelled. The value created by regear opportunities comprises a period of higher ‘overrent’ for the term of the existing lease, followed by reversion to a lower, rebased level of rent over a newly extended term, with the increased duration of cash flow providing potential for a capital uplift. Successful underwriting includes an ability to accurately assess the strength of the tenant and its ability to pay the overrent until lease maturity, as well as the likely level of the regeared rent, for which the rent to turnover ratio (RTO) and not rent per sq ft is the key metric as explained below. Supermarket operators are understandably willing to pay higher rents for stronger performing stores. As a sector specialist, the investment adviser expects to be able to underwrite the regear risks more effectively than many others by leveraging its market information advantage and expects acquisition yields of 7% or more.
Stoke-on-Trent
We would classify the recent £34.7m (before costs) acquisition of a Tesco store in Stoke-on-Trent as just such a regear opportunity. The store sits on an 8.7 acre site and comprises an omnichannel supermarket and petrol filling station. It was built in 1994 and supports Tesco’s online fulfilment operation via both home delivery vans and customer click & collect. Rents are reviewed annually, linked to RPI (subject to a 4% cap and a 0% floor), and the purchase price reflected an attractive yield of 7.5%. We estimate rental income of c £2.8m pa.
The store has a c 55k sq ft net sales area, but the rent is based on the larger gross area of c 78k sq ft. The rent also includes (is ‘grossed up for’) additional amounts payable, commonly related to fixtures and fittings provided by the landlord or to on-site petrol filling stations. SUPR says that for many properties, the headline total rent has been grossed by around 12.5%. Such adjustments apply to the Stoke-on-Trent store, for which SUPR indicates a rent of c £30 per sq ft, which is above the portfolio average of £23 per sq ft. Although we do not know the RTO in respect of the store, it does appear that there is a degree of over-renting, for which the 7.5% net initial yield and 11-year remaining lease term provides a very attractive compensation. SUPR says that the yield for an equivalent asset, let at a market rent level, with a longer 15-year lease, would likely be c 5.25%. Moreover, the Stoke-on-Trent store is well-performing and strategically attractive to the tenant, both of which will be reflected in future lease negotiations.
Is over-renting a problem?
While in many cases UK supermarkets are overrented, SUPR has an affordable portfolio average rent to turnover ratio (RTO) of 3.8% (see below). Some of its stores have a lower-than-average RTO and some higher, often reflecting targeted regear opportunities. For the overrented stores, let to strong tenants, SUPR is in the ‘harvesting’ stage, collecting above ‘market rents’ until maturity. The portfolio weighted average unexpired lease term (WAULT) at end-H124 was 13 years, and there is no significant maturity until 2029. This lease maturity profile, the balance between under-rented and over-rented stores, and continuing strong UK grocery growth all indicate that there is no ‘cliff edge’ were portfolio rents to ‘gap down’ and punctuate organic rental growth or dividend paying capacity.
Why are some stores over-rented?
Supermarket leases are typically long term (25 years or more at inception), with rent reviews that are predominantly inflation linked but may also be ‘open market’ or subject to fixed uplifts. Most (78%) of SUPR’s contracted rents are indexed to inflation, 71% to the Retail Prices Index (RPI) and 7% to the Consumer Prices Index (CPI). Of the balance, fixed uplifts account for 2% and open market reviews 20% (c 12% of supermarket rents). Most of SUPR’s open market rents relate to its complementary co-located, non-food assets, providing mostly non-discretionary items.
In the market, many index-linked leases were created in operator sale and leaseback transactions in the 1990s and 2000s, enabling large operators such as Tesco and Sainsbury’s to expand their estates while recycling capital into further growth. On the expectation that store turnover would broadly track inflation, index-linked leases (with caps and collars) were the norm, with initial rents generally set at c 4% of turnover, or around two weeks of trading. This 4% RTO level is important as, according to SUPR, it continues to be widely used by operators as the point around which to set an affordable starting rent.
During the COVID-19 pandemic, grocery sales were boosted by more people working from home, much of which has stuck. Recent inflation has significantly outpaced capped index-linked rent uplifts, reducing the RTO. Both of these factors have made supermarket rents increasingly affordable. However, this follows a period when the reverse was true, with store sales lagging rents and the RTO increasing. The move of electrical appliances and other non-food items out of the stores to online delivery was one factor. For grocery sales this is not the case as the vast majority of online sales are fulfilled through omnichannel stores. Having fallen back from the pandemic peak, online sales are again growing ahead of the total market. Market share gains by the fast-expanding discounters also had an impact on store growth for the larger operators, although it appears this may be coming to an end.
What is the appropriate rent level?
While many stores across the sector may have become overrented, it is a complex matter to identify which stores and by how much by focusing on rent per square foot, and this is why SUPR and the operators focus on RTO. While some property consultants and index providers such as MSCI publish rent per square foot data (for MSCI this is around £20 per sq ft), SUPR believes these are very likely to underestimate how much operators are willing to pay to secure the ongoing occupancy of strong trading stores. The reasons for this include:
■
The average includes all supermarket formats, all operators and weak as well as strongly performing stores. A similar effect is reflected in a higher average sector valuation yield.
■
The data from regears is not included by index providers. SUPR notes recent regears where rents have been agreed on strongly performing stores at levels that are materially higher than index levels but still consistent with a 4% RTO.
■
There is no adjustment for store size. The following illustration, provided by SUPR, shows that two strongly trading stores, with identical turnover and RTO, and of equal value to an operator, are likely to command very different levels of rent per square foot depending on their size.
Exhibit 1: Illustration of the store size impact on rent per square foot
Store weekly turnover |
£1,211,000 |
|
Annual turnover |
£63,000,000 |
|
Affordable rent based on 4% RTO |
£2,520,000 |
|
Store A |
Store B |
|
Gross internal area (sq ft) |
80,000 |
97,400 |
Rent per sq ft |
£31.5 |
£25.9 |
Adjustments* |
12.5% |
12.5% |
Net rent per sq ft |
£28.0 |
£23.0 |
Source: Supermarket Income REIT. Note: *As describe above, including those related to fixtures & fittings and petrol filling stations.
SUPR says that it has seen many examples of operators being willing to commit to new 15-year lease terms on existing stores, provided the new rent is reset to their acceptable RTO level, with the resultant implied rent per square foot being of lesser importance.
Forecasts and valuation
Minimal change to adjusted earnings forecasts
Although inflation is expected to moderate over the forecast period and will slow annual inflation-indexed rent uplifts, it will take some time for recent high levels to be fully reflected in five-yearly reviews. Meanwhile, SUPR expects an acceleration in open market rent reviews, all on a five-year cycle.
Taking this together, our forecasts reflect like-for-like growth in passing rent of 3.5% in FY24, 3.0% in FY25 and 2.0% in FY26.
We have included the Stoke-on-Trent asset and the Carrefour portfolio acquisition only. An additional c £100m of deployment would take our forecast LTV to c 39%, towards the higher end of SUPR’s targeted range. Assuming a medium-term financing cost of c 5.5% and a 7.0% acquisition yield, this would add an additional c £1.5m, or about 0.1p per share, of adjusted earnings to our forecasts, on an annualised basis.
We assume no change in the H124 net initial yield throughout the forecast period, such that rental growth feeds fully through to portfolio valuation uplifts and growth in NAV.
Exhibit 2: Forecast summary
£m unless stated otherwise |
Estimates |
Previous estimates |
Difference/change in forecast |
||||||||||
FY24e |
FY25e |
FY26e |
FY24e |
FY25e |
FY26e |
FY24e |
FY25e |
FY26e |
FY24e |
FY25e |
FY26e |
||
Net rental income |
104.6 |
114.1 |
117.2 |
103.9 |
107.5 |
111.8 |
0.7 |
6.6 |
5.4 |
1% |
6% |
5% |
|
Rent smoothing adjustment |
3.0 |
3.0 |
3.0 |
3.0 |
3.0 |
3.0 |
0.0 |
(0.0) |
(0.0) |
1% |
0% |
-1% |
|
Net service charge expense |
(0.2) |
(0.6) |
(0.6) |
(0.4) |
(0.3) |
(0.2) |
0.2 |
(0.3) |
(0.4) |
||||
Rental income |
107.4 |
116.5 |
119.6 |
106.5 |
110.2 |
114.6 |
0.9 |
6.3 |
4.9 |
1% |
6% |
4% |
|
Expenses |
(15.0) |
(15.0) |
(15.5) |
(13.9) |
(14.2) |
(14.5) |
(1.0) |
(0.8) |
(1.0) |
8% |
6% |
7% |
|
Net finance costs |
(17.0) |
(24.1) |
(26.6) |
(16.7) |
(18.9) |
(23.3) |
(0.3) |
(5.2) |
(3.3) |
2% |
27% |
14% |
|
Adjusted EPRA earnings |
75.5 |
77.4 |
77.5 |
75.9 |
77.1 |
76.8 |
(0.4) |
0.3 |
0.7 |
-1% |
0% |
1% |
|
Adjusted EPRA EPS (p) |
6.1 |
6.2 |
6.2 |
6.1 |
6.2 |
6.2 |
0.0 |
0.0 |
0.1 |
-1% |
0% |
1% |
|
DPS (p) |
6.06 |
6.12 |
6.20 |
6.06 |
6.12 |
6.18 |
0.00 |
0.00 |
0.0 |
0% |
0% |
0% |
|
Dividend cover (x) |
100% |
102% |
101% |
101% |
101% |
100% |
|||||||
Gross borrowing |
695.0 |
695.0 |
695.0 |
579.6 |
578.3 |
577.8 |
115.4 |
116.7 |
117.2 |
20% |
20% |
20% |
|
LTV |
36.8% |
35.6% |
35.0% |
31.6% |
30.8% |
30.4% |
|||||||
EPRA NTA per share (p) |
89 |
94 |
97 |
93 |
96 |
98 |
(3.6) |
(2.4) |
(1.9) |
-4% |
-3% |
-2% |
|
EPRA NTA total return |
2.5% |
12.1% |
9.5% |
6.5% |
10.3% |
8.7% |
|||||||
Source: Edison Investment Research
Financing and finance costs
Given the level of economic and financial market uncertainty, early in 2023 (H223) SUPR took active measures to reduce interest rate risk and used part of the proceeds from the sale of its interest in the Sainsbury’s Reversion Portfolio (SRP) to repay debt.
Having fully hedged its floating rate debt during FY23, a further comprehensive debt refinancing in September 2023 extended the weighted average maturity to just over four years (including extension options, or around three years to first maturity). The hedging arrangements were similarly adjusted to maintain a fully fixed/hedged position for 2.7 years (from end-H124) to first maturity (before extensions) at an average 3.1%.
At end-H124, total debt facilities amounted to £689m or £764m including accordion options at the discretion of the lender. £588m of debt had been drawn, with £177m available (including the accordion options). The first maturity, in August 2024, is the £97m Deka Bank facility, more than covered by undrawn facilities. Shortly after the release of the H124 results, SUPR increased its unsecured facilities with Sumitomo Mitsui Banking Corporation by £37.5m to £104.5m. The additional tranche is priced at a margin of 1.55% (1.40% on the original tranche), fully hedged for the full term to September 2026. Subsequently, SUPR increased its revolving credit facility with HSBC to £75m from £50m, with an unchanged margin of 1.7%. Most of the facility was drawn, in euros, to fund the Carrefour acquisition, at the margin plus Euribor. Neither of these recent facility extensions is reflected in the maturity profiles below, which are based on the H124 disclosure.
|
Exhibit 3: Debt maturity profile before extension options. Position at 31 December 2023 (end-H124) adjusted for subsequent financing event |
Exhibit 4: Debt maturity profile including extension options. Position at 31 December 2023 (end-H124) adjusted for subsequent financing events |
|
|
|
Source: Supermarket Income REIT data |
|
Exhibit 3: Debt maturity profile before extension options. Position at 31 December 2023 (end-H124) adjusted for subsequent financing event |
|
|
Source: Supermarket Income REIT data |
|
Exhibit 4: Debt maturity profile including extension options. Position at 31 December 2023 (end-H124) adjusted for subsequent financing events |
|
|
Source: Supermarket Income REIT data |
The percentage of unsecured borrowing is 60%, providing significant financing flexibility. The end-H124 LTV of 33% was well within the company’s medium-term target range of 30–40% and, following the subsequent acquisitions, the pro-forma LTV is 37%. There is strong headroom on banking covenants including a maximum LTV of 60% and minimum interest cover ratio of 1.8x. At end-FY24, SUPR’s interest cover was 5.8x. As of end-H124, property values would need to fall by c 42% before breaching the LTV covenant and net rental income would need to fall by 56% before breaching the interest cover covenant. In February 2023, Fitch Ratings reaffirmed SUPR’s BBB+ investment-grade credit rating.
Stepped borrowing costs to accompany rent growth
At the same time as the September 2023 refinancing, SUPR used the value of its existing in-the-money interest rate hedges to extend the term of its hedging arrangements, matching the maturity (before extensions) of its extended debt facilities, at no additional premium. The existing hedges were adjusted along with a new forward cap starting in August 2024 and terminating in July 2025 with a strike rate of 1.4%, representing the maximum SONIA rate payable.
The adjusted hedging arrangements are on a stepped basis, with the blended average cap rate increasing through the period to maturity. Advantageously, this better matches the income profile, which will similarly increase with rental growth. Based on the 1.4% strike price of the forward starting cap, we estimate that the 3.1% average cost to maturity implies a c 0.5% uplift each year from end-FY25, and a similar step-down for FY24.
A summary of our forecast interest costs, based on this assumption, are shown in Exhibit 5.
Exhibit 5: Debt cost assumptions
£m unless stated otherwise |
FY24e |
FY25e |
FY26e |
Period-end gross borrowing |
699 |
699 |
699 |
Average gross borrowing |
595 |
699 |
699 |
Interest cost* |
14.3 |
23.3 |
25.8 |
Weighted average cost of borrowing |
2.4% |
3.3% |
3.7% |
Loan fees |
2.9 |
1.5 |
1.5 |
Total finance charges |
17.3 |
24.8 |
27.3 |
Weighted average finance charges |
2.9% |
3.5% |
3.9% |
Source: Edison Investment Research. Note: *Interest cost is net of derivative income.
Valuation
The FY24 target DPS of 6.06p represents a yield of 8.2%, while the shares trade at a 16% discount to H124 NAV.
|
|
Exhibit 7: P/NAV history from IPO |
|
|
|
Source: Supermarket Income REIT data, LSEG prices, Edison Investment Research |
Source: Supermarket Income REIT data, LSEG, Edison Investment Research |
|
|
|
|
Source: Supermarket Income REIT data, LSEG prices, Edison Investment Research |
|
Exhibit 7: P/NAV history from IPO |
|
|
Source: Supermarket Income REIT data, LSEG, Edison Investment Research |
Compared with a selected group of other property companies that focus on income returns derived from long leases, SUPR’s share price performance is slightly below peers over the past one and three years and, over the same period, the peer group has underperformed the wider property sector and the UK equity market. Calculated on a trailing basis for consistency, the yield on SUPR shares is well ahead of the peer group average and SUPR trades at a higher P/NAV.
Exhibit 8: Valuation and performance summary of long-lease REITS
Price |
Market cap |
P/NAV* |
Trailing yield** (%) |
Share price performance |
||||
One month |
Three months |
One year |
Three years |
|||||
Alternative Income REIT |
69 |
56 |
0.85 |
8.9 |
1% |
3% |
9% |
-10% |
Assura |
42 |
1,250 |
0.81 |
7.8 |
5% |
1% |
-5% |
-16% |
Impact Healthcare |
85 |
353 |
0.74 |
8.0 |
0% |
3% |
-1% |
-11% |
LondonMetric |
191 |
3,906 |
0.96 |
5.1 |
-4% |
-2% |
16% |
-9% |
Primary Health Properties |
93 |
1,238 |
0.86 |
7.3 |
1% |
1% |
1% |
-15% |
Target Healthcare |
80 |
496 |
0.73 |
7.1 |
3% |
1% |
12% |
-10% |
Triple Point Social Housing |
57 |
226 |
0.50 |
9.5 |
0% |
-6% |
8% |
-16% |
Tritax Big Box |
157 |
3,882 |
0.88 |
4.5 |
-1% |
3% |
23% |
-11% |
Average |
0.78 |
7.0 |
1% |
0% |
8% |
-13% |
||
Supermarket Income |
74 |
922 |
0.84 |
8.1 |
1% |
-2% |
5% |
-17% |
UK property sector index |
1,333 |
-1% |
4% |
15% |
-6% |
|||
UK equity market index |
4,482 |
-1% |
3% |
12% |
-3% |
|||
Source: Company data, LSEG. Note: *Based on last reported EPRA NAV/NTA. **Based on last 12-months DPS declared. Priced at 10 July 2024.
Recent financial performance
The H124 results for the six months to 31 December 2023 were reported in March. Adjusted earnings presented no material surprises. Property valuations, which are less predictable and outside of the company’s control, declined, reducing NAV.
Passing rent has continued to increase, by £4.7m in the period, and by £6.6m over 12 months. During H124, SUPR exercised its right to purchase two stores that had formed part of the SRP, for £36.4m, reflecting a net initial yield of 6.5%, well ahead of the 4.3% net initial yield on which the majority of the SRP stores had been sold to Sainsbury’s. Also, during H124, the average annualised uplift of 3.6% on rent reviews concluded added £1.6m to passing rent.
The subsequent acquisition of Tesco Stoke-on-Trent and the Carrefour portfolio have since added an additional c £7.2m to passing rent.
|
Exhibit 9: Change in passing rents |
|
|
Source: Supermarket Income REIT data |
Although the recent increase in passing rent did not fully contribute in H124, the growth in net rental income earned in the period, and in the past 12 months, has substantially offset the loss of income from SUPR’s disposal of its interest in the SRP. The effect of this was spread across both H223 and H124 but will have no further impact in H224. With the SRP disposal proceeds partly used to repay borrowings, interest has reduced, and admin costs have been well controlled.
|
Exhibit 10: Stable adjusted earnings despite loss of SRP income |
|
|
Source: SUPR data |
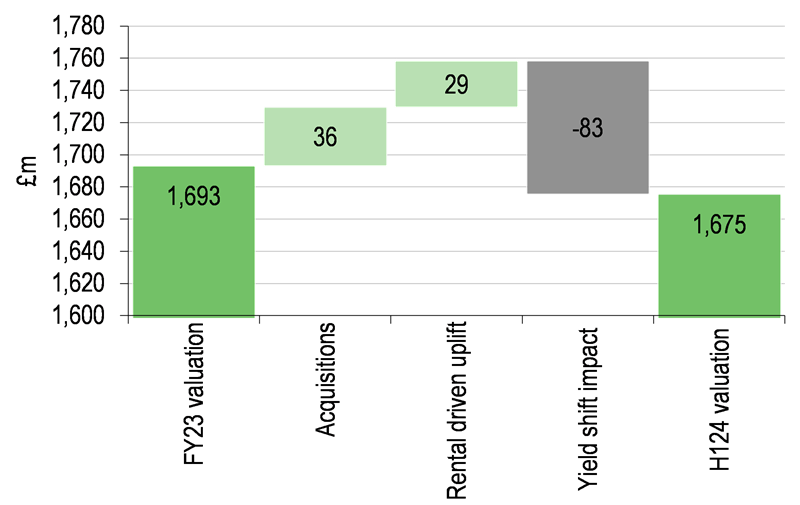
Compared with end-FY23, the H124 portfolio value was 1.1% lower, or 3.2% on a like-for-like basis. Rental growth had a positive £29m impact on valuation, but this was more than offset by the £83m negative impact from yield widening. The like-for-like reduction in property values was slightly less than the 4.0% capital decline that MSCI data show for the broad UK commercial property market over the same period.
With adjusted earnings and dividends paid in balance, the property valuation decline drove the change in EPRA NTA/NAV per share.
|
Exhibit 11: H124 movement in portfolio value |
Exhibit 12: H124 movement in NAV per share |
|
|
|
Source: Supermarket Income REIT |
|
Exhibit 11: H124 movement in portfolio value |
|
|
Source: Supermarket Income REIT |
|
Exhibit 12: H124 movement in NAV per share |
|
|
Source: Supermarket Income REIT |
Exhibit 13 summarises SUPR’s H124 financial performance, commencing with adjusted EPRA earnings before providing a reconciliation to IFRS.
Exhibit 13: H124 financial summary
£m unless stated otherwise |
H124 |
H123 |
H124/H123 |
H223 |
Total net rental income |
52.6 |
45.9 |
15% |
49.4 |
Administrative & other expenses |
(7.6) |
(7.9) |
-4% |
(7.5) |
Net finance expense |
(8.7) |
(8.9) |
-3% |
(10.2) |
Share of income from joint venture (excluding revaluation gains) |
0.0 |
7.4 |
-100% |
4.4 |
Adjusted EPRA earnings |
36.3 |
36.4 |
0% |
36.0 |
Change in fair value of investment properties |
(57.9) |
(248.1) |
(8.0) |
|
Change in fair value of investment properties within associate |
0.0 |
11.5 |
.0 |
|
Change in value of interest rate derivatives |
(32.3) |
(1.0) |
11.0 |
|
Profit on disposal of interest rate derivative |
0.0 |
0.0 |
2.9 |
|
Profit on disposal of associate |
0.0 |
0.0 |
19.9 |
|
One-off acceleration of unamortised loan arrangement fees |
(0.3) |
(1.5) |
0.0 |
|
One-off SRP investment loan arrangement fees |
(4.0) |
|||
IFRS earnings |
(54.2) |
(202.6) |
57.7 |
|
Basic & diluted IFRS EPS (p) |
(4.4) |
(16.3) |
4.6 |
|
Adjusted EPRA EPS (p) |
2.9 |
2.9 |
-1% |
2.9 |
DPS declared (p) |
3.03 |
3.00 |
1% |
3.00 |
Adjusted EPRA basis dividend cover (x) |
0.97 |
0.98 |
0.96 |
|
Adjusted EPRA cost ratio |
15.1% |
16.7% |
||
Gross assets |
1,752 |
1,924 |
1,934 |
|
Investment properties |
1,668 |
1,625 |
1,686 |
|
Net assets |
1,125 |
1,198 |
1,218 |
|
EPRA NTA per share (p) |
88 |
92 |
93 |
|
EPRA NTA total return |
-2.2% |
-17.2% |
3.8% |
|
Net debt |
(550.7) |
(655.2) |
(634.7) |
|
Loan to value ratio (LTV) |
33.0% |
40.3% |
37.7% |
Source: SUPR data, Edison Investment Research
With respect to adjusted EPRA earnings, we highlight the following, with comparisons to H123 unless specified otherwise:
■
Net rental income increased 15% to £52.6m (H123: £45.9m), driven by a full period contribution from FY23 acquisitions, a part contribution from H124 acquisitions and rent reviews. Like-for-like rental growth was 2.5%.
■
Administrative and other expenses of £7.6m were 4% lower (H123: £7.9m) and the EPRA cost ratio improved to 15.1% from 16.7%. H124 benefited from lower investment management fees, linked to average net assets (c £0.5m), and a non-repeat of the additional costs incurred in H123 in relation to the unwind of the JV structure (c £0.9m), partially offset by underlying inflationary uplifts.
■
Finance expenses of £8.7m (H123: £8.9m) were driven primarily by lower average borrowings. This included £10.2m of finance income received on interest rate derivatives (H123: nil; H223: £9.7m).
■
There was no contribution from SUPR’s interest in the SRP, compared with £7.4m in H123 and £4.4m in H223.
■
Despite no contribution from the SRP, adjusted earnings of £36.3m showed no material change on either H123 or H223.
■
Adjusted EPS of 2.9p covered DPS of 3.03p by 0.97x.
Included with IFRS earnings but not in adjusted EPRA earnings were:
■
property valuation movements, which in prior periods also included SUPR’s share of movements within the SRP; and
■
movements in the value of interest rate derivatives, both unrealised and realised on disposal.
Exhibit 14: Financial summary
Year ended 30 June (£m) |
2021 |
2022 |
2023 |
2024e |
2025e |
2026e |
INCOME STATEMENT |
||||||
Rent receivable |
46.2 |
69.7 |
93.3 |
104.6 |
114.1 |
117.2 |
Rent smoothing adjustment |
2.0 |
2.7 |
2.5 |
3.0 |
3.0 |
3.0 |
Net service charge expense |
(0.2) |
(0.3) |
(0.6) |
(0.2) |
(0.6) |
(0.6) |
Net rental & related income |
47.9 |
72.1 |
95.2 |
107.4 |
116.5 |
119.6 |
Administrative & other expenses |
(9.3) |
(13.9) |
(15.4) |
(15.0) |
(15.0) |
(15.5) |
Change in fair value of investment properties |
36.3 |
21.8 |
(256.1) |
(42.8) |
56.9 |
34.0 |
Share of profit of associate |
15.5 |
43.3 |
23.2 |
0.0 |
0.0 |
0.0 |
Gain on disposal of associate |
19.9 |
0.0 |
0.0 |
0.0 |
||
Operating profit/(loss) |
90.5 |
123.3 |
(133.1) |
49.6 |
158.4 |
138.1 |
Net finance expense |
(8.5) |
(13.0) |
(24.7) |
(17.3) |
(24.1) |
(26.6) |
Change in fair value of interest rate derivative |
0.0 |
0.0 |
10.0 |
(37.3) |
(10.0) |
(10.0) |
Gain on disposal of interest rate derivative |
0.0 |
0.0 |
2.9 |
0.0 |
0.0 |
0.0 |
Profit/(loss) for the period |
82.0 |
110.3 |
(144.9) |
(4.9) |
124.3 |
101.5 |
Adjust for: |
||||||
Changes in fair value of investment property |
(36.3) |
(21.8) |
256.1 |
42.8 |
(56.9) |
(34.0) |
Impact of associate |
(8.9) |
6.0 |
(31.4) |
0.0 |
0.0 |
0.0 |
Impact of interest rate derivative |
0.0 |
0.0 |
(22.6) |
37.3 |
10.0 |
10.0 |
EPRA earnings |
36.8 |
57.4 |
57.2 |
75.2 |
77.4 |
77.5 |
Finance income on interest rate derivative |
0.0 |
0.0 |
9.7 |
0.0 |
0.0 |
0.0 |
Non-recurring |
0.0 |
0.0 |
5.5 |
0.3 |
0.0 |
0.0 |
Adjusted EPRA earnings |
36.8 |
57.4 |
72.4 |
75.5 |
77.4 |
77.5 |
EPRA cost ratio including direct vacancy costs |
16.8% |
16.5% |
15.5% |
14.5% |
13.3% |
13.4% |
Closing number of shares (m) |
810.7 |
1,239.9 |
1,246.2 |
1,246.2 |
1,246.2 |
1,246.2 |
Average number of shares in issue (m) |
652.8 |
975.2 |
1,242.6 |
1,246.2 |
1,246.2 |
1,246.2 |
IFRS EPS (p) |
12.6 |
11.3 |
(11.7) |
(0.4) |
10.0 |
8.1 |
EPRA EPS (p) |
5.6 |
5.9 |
4.6 |
6.0 |
6.2 |
6.2 |
Adjusted EPRA EPS (p) |
5.6 |
5.9 |
5.8 |
6.1 |
6.2 |
6.2 |
DPS declared (p) |
5.86 |
5.94 |
6.00 |
6.06 |
6.12 |
6.20 |
Dividend cover (adjusted EPRA earning/dividends paid) |
104% |
108% |
97% |
100% |
102% |
101% |
EPRA NTA total return |
12.1% |
12.5% |
-14.1% |
2.5% |
12.1% |
9.5% |
BALANCE SHEET |
||||||
Investment property |
1,148.4 |
1,561.6 |
1,685.7 |
1,791.0 |
1,850.9 |
1,887.8 |
JV |
130.3 |
177.1 |
0.0 |
0.0 |
0.0 |
0.0 |
Other non-current assets |
131.3 |
193.1 |
48.0 |
33.3 |
23.3 |
13.3 |
Total non-current assets |
1,279.7 |
1,754.7 |
1,733.7 |
1,824.3 |
1,874.2 |
1,901.1 |
Trade & other receivables |
3.1 |
1.86 |
142.2 |
5.5 |
5.9 |
6.0 |
Cash & equivalents |
19.6 |
51.20 |
37.5 |
40.5 |
39.6 |
37.4 |
Other current assets |
0.2 |
0.28 |
20.4 |
0.0 |
0.0 |
0.0 |
Total current assets |
23.0 |
53.35 |
200.0 |
46.0 |
45.4 |
43.4 |
Borrowings |
0.0 |
0.0 |
(61.9) |
0.0 |
0.0 |
0.0 |
Trade &other payables |
(8.4) |
(10.7) |
(27.0) |
(16.5) |
(17.6) |
(18.0) |
Other current liabilities |
(12.1) |
(16.4) |
(21.6) |
(22.4) |
(22.4) |
(22.4) |
Total current liabilities |
(20.4) |
(27.0) |
(110.4) |
(38.8) |
(39.9) |
(40.4) |
Bank borrowings |
(409.7) |
(348.5) |
(605.6) |
(695.0) |
(695.0) |
(695.0) |
Interest rate derivatives |
(1.2) |
0.0 |
0.0 |
0.0 |
0.0 |
0.0 |
Total non-current liabilities |
(410.9) |
(348.5) |
(605.6) |
(695.0) |
(695.0) |
(695.0) |
Net assets |
871.3 |
1,432.5 |
1,217.7 |
1,136.4 |
1,184.7 |
1,209.2 |
Adjust for: |
||||||
Fair value of derivatives &financial assets, intangibles |
0.4 |
(5.9) |
(61.2) |
(26.0) |
(16.0) |
(6.0) |
EPRA net tangible assets (NTA) |
871.7 |
1,426.6 |
1,156.5 |
1,110.4 |
1,168.7 |
1,203.2 |
IFRS NAV per share (p) |
107 |
116 |
98 |
91 |
95 |
97 |
EPRA NTA per share (p) |
108 |
115 |
93 |
89 |
94 |
97 |
CASH FLOW |
||||||
Net cash from operations |
42.8 |
63.0 |
84.3 |
87.0 |
99.9 |
102.1 |
Acquisition & investment in investment property |
(570.0) |
(388.7) |
(377.3) |
(144.8) |
0.0 |
0.0 |
Net investment in associate |
(58.7) |
(3.5) |
103.1 |
135.1 |
0.0 |
0.0 |
Other investing activity |
(0.9) |
(10.6) |
0.5 |
0.2 |
0.0 |
0.0 |
Net cash from investing activity |
(629.5) |
(402.8) |
(273.7) |
(9.5) |
0.0 |
0.0 |
Share issuance (net of costs) |
345.6 |
496.4 |
(0.1) |
0.0 |
0.0 |
0.0 |
Debt drawn/(repaid) |
284.7 |
(61.1) |
313.6 |
26.7 |
0.0 |
0.0 |
Interest paid and other financing costs |
(9.3) |
(12.7) |
(64.7) |
(59.2) |
(24.8) |
(27.3) |
Dividends paid |
(34.9) |
(51.1) |
(68.0) |
(73.1) |
(76.1) |
(77.0) |
Other financing activity |
(5.2) |
31.0 |
(0.0) |
0.0 |
||
Net cash from financing activity |
586.0 |
371.5 |
175.7 |
(74.6) |
(100.8) |
(104.3) |
Change in cash |
(0.8) |
31.6 |
(13.7) |
3.0 |
(0.9) |
(2.2) |
Opening cash |
20.4 |
19.6 |
51.2 |
37.5 |
40.5 |
39.6 |
Closing cash |
19.6 |
51.2 |
37.5 |
40.5 |
39.6 |
37.4 |
Debt as per balance sheet |
(409.7) |
(348.5) |
(667.5) |
(695.0) |
(695.0) |
(695.0) |
Unamortised loan arrangement fees |
(3.7) |
(4.7) |
(3.9) |
(3.9) |
(3.9) |
(3.9) |
Net debt |
(393.8) |
(302.0) |
(633.9) |
(658.4) |
(659.3) |
(661.5) |
LTV |
34.0% |
19.0% |
37.4% |
36.8% |
35.6% |
35.0% |
Source: Supermarket Income REIT historical data, Edison Investment Research forecasts
|
|
Research: Healthcare
Immix has announced that the first patient has been dosed in its Phase Ib NEXICART-2 trial of lead CAR-T asset NXC-201, which took place at lead study site, the Memorial Sloan Kettering Cancer Center. This US-based study will evaluate the safety and efficacy of NXC-201 in approximately 40 patients with relapsed/refractory amyloid light chain amyloidosis (r/r ALA). Management expects the trial to be fully enrolled within 18 months, implying that top-line results could be available in H126. In the near term, we anticipate rolling data readouts as seen with the prior NEXICART-1 trial. We also expect more details for the expansion of NXC-201 into additional autoimmune indications by the end of 2024.