Last close As at 05/08/2026
GBP11.76
▲ −3.98 (−0.34%)
Market capitalisation
—
Research: Investment Companies
The COVID-19 pandemic has been tough on Brazil but OCN has weathered it well with a respectable 5.1% ROE in 2020 and maintained its 70c (4.3%) dividend. Business volumes fell in Wilson Sons (WSON), its Brazilian maritime services company, but prices firmed up and allowed WSON to post a 4.3% ROE. OCN’s international investment portfolio (OWIL) had a good year in 2020 with favourable if choppy markets. Business is now picking up in WSON’s key container terminals and tugboat business and a recovery seems underway. We forecast OCN’s PBT to rise by 44% in FY21 and by 20% in FY22 as business recovers to normal. OCN is currently trading on a 35% discount to look-through value despite having risen 27% since 1 April. Its stake in listed WSON alone is worth 99% of its market cap.
Written by
Ocean Wilson Holdings |
Smoother sailing ahead |
Outlook for 2021 |
Investment company |
21 June 2021 |
Share price performance
Business description
Next events
Analyst
Ocean Wilson Holdings is a research client of Edison Investment Research Limited |
|||||||||||||||||||||||||||||||||||||||||||||||
The COVID-19 pandemic has been tough on Brazil but OCN has weathered it well with a respectable 5.1% ROE in 2020 and maintained its 70c (4.3%) dividend. Business volumes fell in Wilson Sons (WSON), its Brazilian maritime services company, but prices firmed up and allowed WSON to post a 4.3% ROE. OCN’s international investment portfolio (OWIL) had a good year in 2020 with favourable if choppy markets. Business is now picking up in WSON’s key container terminals and tugboat business and a recovery seems underway. We forecast OCN’s PBT to rise by 44% in FY21 and by 20% in FY22 as business recovers to normal. OCN is currently trading on a 35% discount to look-through value despite having risen 27% since 1 April. Its stake in listed WSON alone is worth 99% of its market cap.
Year end |
Revenue (US$m) |
PBT* |
EPS* |
DPS |
P/E |
Yield |
12/19 |
406.1 |
95.6 |
169.3 |
70.0 |
9.6 |
4.3 |
12/20 |
352.8 |
74.6 |
109.5 |
70.0 |
14.8 |
4.3 |
12/21e |
388.4 |
107.8 |
178.2 |
70.0 |
9.1 |
4.3 |
12/22e |
409.4 |
129.8 |
200.1 |
70.0 |
8.1 |
4.3 |
Note: *PBT and EPS are normalised, excluding amortisation of acquired intangibles, exceptional items and share-based payments.
Restructuring is a boost for shares
The proposed restructuring of WSON would move it from being a Bermuda-based company with Brazilian depository receipts (BDRs) listed in Brazil to being a company directed listed on the Novo Mercado segment in the Brazilian exchange. This will be achieved by a downstream merger of the Bermuda parent company with the 100% owned Brazilian one. There will be no shareholder dilution. A Novo Mercado listing will mean (1) greater share liquidity, (2) a stronger corporate governance seal and (3) an opportunity to join the main Brazilian and Latin American stock market indices. The changes require regulatory approval and are expected to be completed later in H221.
WSON recovery underway
While WSON’s business volumes were affected by the pandemic, prices and margins actually improved due to better competitive dynamics in its key towage and container ports businesses. Currently, volumes are picking up in these two divisions, while higher oil prices are supportive of a future recovery in WSON’s lagging oil and gas platform service operations.
Valuation: 35% NAV discount, 4.3% US$ dividend
Despite the shares having strongly rallied in recent months, OCN is still trading at a 35% discount to its look-through value, which comprises the market value of the stake in WSON (which has also been rallying, up 64% in three months) and the last reported value for the investment portfolio held by OCN. Despite a good growth outlook, WSON is trading at significant discounts to its peers in market multiples such as P/E (44% FY21e, 35% FY22e) and EV/EBITDA (about a third less).
Investment summary
Restructuring viewed positively
The proposed restructuring of WSON has been well received by the market. After the plan was disclosed on 21 March, the shares rose 11% the next day and are now up 27% since the announcement. We share the enthusiasm, since listing on B3’s (Brazil’s stock exchange, formerly known as Bovespa) Novo Mercado, as opposed to being a BDR of a Bermudian company, would open the door for many new potential investors and probably also facilitate access to capital markets.
WSON: Good operating trends
WSON is starting to experience a recovery from the peak of the COVID-19 crisis. Container volumes are up 13.7% y-o-y in the first five months of 2021, but also importantly prices in the container and tugboats businesses remain relatively good and this is a continuation of positive trends in 2020. After a 4.7% GDP contraction in Brazil in 2020, consensus forecasts expect 3.3% growth in 2021 with more trade flows, more containers and more port activity. WSON essentially drives OCN’s revenue and EBITDA, and we forecast OCN’s EBITDA to rise by 12.7% in 2021 despite the costs of the restructuring. Capacity utilisation is currently relatively low: 20% in offshore bases, 17 out of 23 boats of the off-shore support vessels and 50% in container terminals following the expansion of Salvador terminal. This could lead to significant favourable operating leverage in the reported results as business volumes recover and grow.
The secular growth story remains intact
The longer-term growth story in Brazil remains in place and the outlook for the container terminals is boosted by relatively low containerisation in Brazil of just under 52 TEUs (20-foot equivalent unit, typical size of one container) per 1,000 people in 2019 compared with an average of 79 for Latin America and 198 in the OECD. The Brazilian government is encouraging greater use of sea and river transport in Brazil, which has traditionally been biased towards roads despite the long coast and river network. Looking ahead, we think container volume growth of 5–6% a year in the context of 3% GDP growth is a reasonable long-term assumption. In addition, the Brazilian government is launching a large infrastructure programme that should also help OCN.
Recovering markets help OWIL investment portfolio
Hansa Trust has remained relatively positive on the market throughout the pandemic in the context of its usual conservative, long-term approach. The OWIL portfolio grew 12.2% in 2020. Looking ahead, the manager believes valuations are getting stretched in the equities market, but that low interest rates remain supportive of the markets. Their biggest worry is anything that derails the expected rebound in economic growth, such as vaccines being ineffective against new strains.
Valuation: 35% discount to look-through value
Ocean Wilsons is trading at a 35% discount to its look-through value, which comprises the market value of the stake in WSON and the last reported value for OWIL’s portfolio. WSON continues to trade at a significant discount to peers, and we believe that the announced restructuring and listing on the Novo Mercado should result in the narrowing of this discount. As business activity recovers and the long-term growth trends reassert themselves, we forecast that WSON earnings will benefit from the leveraged upside from the spare capacity and the improving operating trends in the tugboat division (WSON’s biggest EBITDA contributor).
Brazilian maritime services and international portfolio
Ocean Wilsons is a Bermuda-based investment company with two main assets: a controlling 57.09% stake in WSON, a quoted Brazilian maritime services company; and an international investment portfolio held in its OWIL subsidiary. Ocean Wilsons is listed in Bermuda and London, whereas WSON is listed in São Paulo as a BDR of a Bermudian company, Wilson Sons Limited. The proposed corporate restructuring involves a downstream merger of Wilsons Sons Limited with Brazilian company Wilsons Sons Holdings (100% held by Wilsons Sons Limited), and then removing the previous BDR and listing the new company on the Novo Mercado.
The market value of the WSON stake accounts for 65% of the look-through value of Ocean Wilsons and the investment portfolio accounts for the remaining 35%. Ocean Wilsons’ market cap is 35% below this look-through value as we detail later in the valuation section on page 12.
WSON: Towage and tugboats are the biggest earners
WSON is one of the largest providers of maritime services in Brazil, with activities including harbour and ocean towage, two container terminals, offshore oil and gas support services and shipyard, ship agency and logistics services.
The towage and container terminals typically account for 85% of pro-forma EBITDA. If we added the off-shore support vessels (usually 12–19% of EBITDA), these three divisions represent almost all of the group EBITDA. Trends in Brazilian trade volumes and the oil industry are important drivers of revenue and profits. Direct exposure to the oil industry is through the offshore support vessel (which is a joint venture (JV) with Chilean group Ultramar) and Brasco (usually 1–3% of EBITDA, but currently running at a small loss).
WSON reports in US dollars and earns c 55% of revenues in that currency, while c 85% of its costs are in Brazilian reais. To offset its naturally long dollar business, its debt has been almost 95% dollar or real-dollar linked (this has recently declined to 72%. This helps moderate the impact of foreign exchange moves on earnings. The currency mix, the diversification activities and its good competitive position have contributed to EBITDA resilience during periods of economic downturn such as in 2014–16 and now in 2020 and accompanying Brazilian real currency weakness. However, the devaluation in Brazilian real (see Exhibit 7 on page 8) has had a big impact on the drop in reported US$ revenue. For example, while WSON revenue peaked in 2013, full container volumes in its container terminals business peaked in 2018 and will hit record levels by 2023–24. In terms of Brazilian reais, revenue in 2020 was at a record level.
OWIL: Diversified long-term capital growth
OWIL’s investment objective is to achieve long-term capital growth and preserve capital by investing in a diversified global portfolio across three categories: core regional funds, long-term growth funds (investing in technology and biotech for instance) and diversifying funds to provide protection against cyclical changes. The investment manager is Hanseatic Asset Management. Exhibit 2 shows a breakdown of the portfolio at the end of FY20, illustrating that the majority of exposure is to listed equity investments (including the majority of the 43 smaller holdings which are not among the top 30 positions, and instead classified as ‘smaller holdings’). Private assets account for 18%, reflecting the manager’s view on the potential returns and the long-term horizon employed in considering investments. The portfolio also has a significant emerging markets weighting including equities and private investments (not shown in the pie chart).
The OWIL investment portfolio net asset value (NAV) rose 12.2% during 2020, compared to its performance benchmark return of 4.4%. The benchmark is the US CPI Urban Consumers NSA + 3% pa. OWIL underperformed the MSCI ACWI + Frontier Markets (+16.2%) and the MSCI Emerging Markets (18.3%) indices in what was a good year for equities. The underperformance reflects the fund’s relatively cautious profile.
|
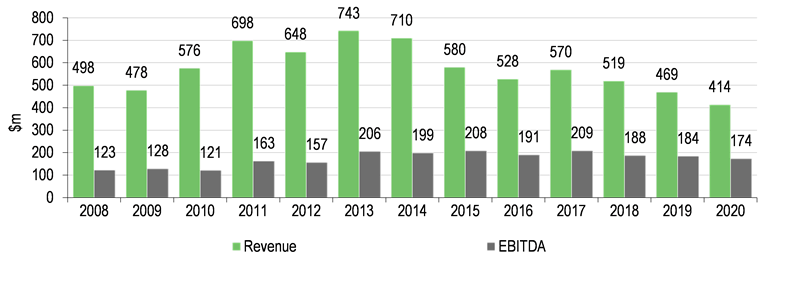
Exhibit 1: Wilson Sons longer-term performance record |
Exhibit 2: OWIL analysis of portfolio (FY20) |
|
|
|
Source: Wilson Sons. Note: EBITDA pro forma including offshore vessels JV. |
Source: Ocean Wilsons Holdings |
|
Exhibit 1: Wilson Sons longer-term performance record |
|
|
Source: Wilson Sons. Note: EBITDA pro forma including offshore vessels JV. |
|
Exhibit 2: OWIL analysis of portfolio (FY20) |
|
|
Source: Ocean Wilsons Holdings |
Wilson Sons
Container terminals
WSON operates two large container terminals in Brazil. One is in Rio Grande and it was Brazil’s sixth busiest container port in 2020. It is near the southern city of Porto Alegre, Brazil’s fourth largest metropolitan area with 4.5 million people. The other one, recently expanded, is in the port of the city of Salvador, one of the three largest cities in north-east Brazil with a metropolitan population of four million. The Salvador container terminal was Brazil’s 12th busiest in 2020. The container terminals are the only dedicated container terminals in the states in which they operate and Salvador has had its concession contract extended (at the price of further investment and expansion of facilities) to 2050. Wilson’s two container terminals had almost 10% market share of volume handled in Brazilian ports in 2020.
The Rio Grande terminal moved 675k TEU in containers in 2020, Salvador moved 342k TEU, and about two-thirds were full containers. International trade makes up around 70% of full container volume in both ports. Both ports are operating at relatively low capacity: Rio Grande’s capacity is 1.42m TEU (46% utilisation in 2020), while Salvador has a 553k TEU capacity (62% utilisation in 2020). This is a high fixed-cost business (c 30%) and it achieved a 2020 EBITDA margin of 52.0% (up from 50.8% in 2019, despite the pandemic) for its container terminal business. WSON believes that 80% capacity utilisation could add another 10 percentage points to the EBITDA margin for both terminals, although we expect this to happen a few years beyond our forecasts for 2021 and 2022. Capacity utilisation in many other Brazilian container terminals is also low; however, container terminals are a growth segment in Brazil, suggesting utilisation should rise progressively. The business’s revenue and costs are mostly in Brazilian reais.
Brazil’s level of containerisation is still relatively low, so in line with historical trends container volume growth appears likely to remain above GDP levels. Currency movements affect the mix of imports and exports and the Brazilian ports benefit from some downside protection during economic recession because the accompanying weaker domestic currency boosts exports. Container competition comes not only from alternative modes of transport (such as rail and road, in the case of cabotage), but also from adjacent ports. In the case of Rio Grande terminal, the relevant ports are Navegantes, Itapoá and Itajaí terminals in Brazil and Montevideo in Uruguay. The competition boils down to total logistics costs, service quality and the ability to take in larger ships. We note, however, that most of Rio Grande’s business comes from regions close to the terminal itself or the dedicated feeder terminal in the Triunfo area of Porto Alegre. In Salvador, the competition is more distant, with terminals in Suape (near Recife) and Pecém (Fortaleza). Pecém does have the advantage of being the major Brazilian port closest to Europe and North America. However, most of Salvador’s business also comes from within a radius of 100km of the terminal, coming from the Salvador metropolis and the region around it.
|
Exhibit 3: WSON revenue analysis (Q121) |
Exhibit 4: WSON EBITDA analysis (Q121) |
|
|
|
Source: Wilson Sons. Note: Offshore vessels is pro forma share of JV, EBITDA adjusts for corporate centre. |
|
|
Exhibit 3: WSON revenue analysis (Q121) |
|
|
|
|
Exhibit 4: WSON EBITDA analysis (Q121) |
|
|
|
|
Source: Wilson Sons. Note: Offshore vessels is pro forma share of JV, EBITDA adjusts for corporate centre. |
Towage
WSON operates the largest tug fleet in Brazil with 80 modern, mostly azimuth propulsion boats (Q320) operating in all the major Brazilian ports and executing close to 45% of all manoeuvres in Brazilian ports in 2020. Apart from moving ships, tugs perform special operations such as firefighting, salvage and ocean towage. These command higher rates and margins and have on average contributed 14% of the division’s revenues since 2008. Consolidation of shipping lines and the trend to larger ships have tended to slow the growth in the number of harbour manoeuvres, but increased the average deadweight towed at a compound annual growth rate of 4% between 2008 and 2018, supporting revenue growth. Owning its shipyards provides Ocean Wilsons an advantage in acquiring new tugs and in fleet maintenance. All domestic Brazilian operators enjoy regulatory protection and long-term, low-cost finance from the Fundo da Marinha Mercante. These benefits seem unlikely to change.
Price competition eased in 2020 and this has continued into 2021. Previously smaller operators that were trying to substitute lost revenue from towage relating to oil and gas business were practising unsustainable pricing.
Because most of the towage revenue is in US dollars, the Brazilian real devaluation has not adversely affected the towage business, which had a 49% EBITDA margin in 2020.
Oil and gas support bases (Brasco)
Brasco operates two support bases (Niterói and Rio) in the Rio de Janeiro metropolis with a total of eight berths and a pipe yard (Guaxindiba) that service oil platforms. It buys, stores and delivers parts, consumables and food, and processes waste. This business is dependent in large part on the fortunes of the oil industry in the Rio de Janeiro area. In the current downturn, Brasco’s capacity utilisation has come down to about 20% and the business is trading at a small loss. As Brazil’s large pre-salt reserves are more fully exploited, demand for Brasco’s capacity should grow with much scope for upside in the results.
Offshore support vessels
The offshore support vessels (OSVs) business also supports the oil industry, mostly around Rio de Janeiro. Wilson Sons UltraTug Offshore (WSUT), a 50:50 JV with Ultramar, a Chilean offshore services company, has a fleet of 23 OSVs. Regulatory protection and low-cost finance exist, similar to that enjoyed by the towage business, and the group’s shipyard facilities are also of benefit to the OSV business. The fleet transports machine parts, consumables and other supplies to offshore oil and gas production and exploration operations in Brazilian waters. It operates under contracts with Petrobras, which have an average unexpired term of four years.
Petrobras will continue to focus on production and exploration of the pre-salt reserves (already 73% of Brazil’s oil production). The remaining contract duration provides good revenue visibility for WSUT, but prices are being affected by relatively low capacity utilisation.
WSUT is currently operating well under capacity with only 17 out of 23 boats under contract and some price pressure. Although near-term growth may be muted due to the lower levels of current oil exploration activity, in the longer term, development of pre-salt oil production seems likely to generate growth for WSUT.
Shipyards, logistics and agency
The two shipyards in Brazil’s biggest port of Santos (Guarujá I and II) are well placed for the construction and maintenance of OSVs due to their proximity to the Santos and Campos oil basins. In the immediate future the business will also be seeking to win maintenance work to sustain activity levels and controlling costs to protect margins.
The logistics division includes distribution centres, transport and bonded warehousing with a focus on the latter. The depreciation of the real affected the bonded warehousing business as a result of reduced imports, while the withdrawal from low-margin dedicated operations has contributed to reduced revenues.
The shipping agency is the longest-established business line for WSON and operates in Brazil’s main ports. It makes up a small part of the group and has had reduced revenues recently as shipping lines have taken the function in-house. This is a mature business with less growth potential than most of the other segments.
WSON revenue and EBITDA progression
Exhibit 5 shows the development of revenues and EBITDA since 2012 including WSUT on a pro forma basis. There have been several large headwinds during this period: (1) the global financial crisis of 2007–08, (2) Brazil’s own worsening economic difficulties following the unorthodox economic policies of the previous Brazilian government (2014–16), and (3) the global COVID-19 pandemic. This has affected business volumes, but the revenue drop has mainly been due to the Brazilian real falling significantly in value against the US dollar in real terms (ie adjusting for inflation differentials). For example, the exchange rate was BRL3.1/US$ in July 2017 and is currently BRL5.2/US$.
Since the 2013 peak, WSON’s pro-forma revenue has fallen 45% in dollar terms to US$414m in FY20. Most of this was driven by the weaker Brazilian real. The decline in EBITDA (again pro-forma) has been less pronounced at 16% in the same period since (1) c 50% of revenues are dollar-denominated while costs primarily in Brazilian reais and (2) there have been gains in operating efficiencies.
|
Exhibit 5: WSON’s historical revenue and EBITDA progression |
|
|
Source: Ocean Wilsons |
Exhibit 6: Operational metrics for five months to end May 2021
Five months to May 2021 |
Change % |
|
Container terminals |
|||
Rio Grande Terminal (TEU 000s) |
|||
Gateway (Full) |
137.9 |
148.4 |
7.6 |
Inland Navigation (Full) |
11.3 |
10.0 |
-11.4 |
Trans shipment & Shifting (Full + Empty) |
23.5 |
45.3 |
92.9 |
Empty (total, except trans shipment) |
92.2 |
96.4 |
4.5 |
Total Rio Grande |
264.9 |
300.1 |
13.3 |
Salvador Terminal (TEU 000s) |
|||
Gateway (Full) |
93.2 |
104.7 |
12.4 |
Trans shipment & Shifting (Full + Empty) |
18.3 |
26.6 |
45.4 |
Empty (total, except trans shipment) |
24.6 |
24.5 |
-0.1 |
Total Salvador |
136.1 |
155.8 |
14.5 |
Group total full |
284.2 |
335.0 |
17.9 |
Group total empty |
116.8 |
121.0 |
3.6 |
Group total full |
401.0 |
455.9 |
13.7 |
Towage |
|||
# of harbour manoeuvres |
20,718 |
22,454 |
8.4 |
Average dead weights ('000 tons) |
76.3 |
86.6 |
13.5 |
Offshore vessels |
|||
# Own OSVs – end of period |
23 |
23 |
|
# Own OSV days in operation/ contract days |
2,175 |
2,153 |
-1.0 |
O&G Terminal (Brasco) |
|||
# dockings |
270 |
217 |
-19.6 |
Source: Wilson Sons
Outlook
Recovery underway with better prices
A recovery seems to be underway in WSON’s container terminals and tugboats business. Full container volumes were up 13.7% y-o-y in the five months to May 2021 and towage manoeuvres were up 8.4% y-o-y.
The oil and gas sector in Brazil is still in the doldrums, especially in terms of the off-shore exploration segment, which is the most relevant for WSON. However, the Brazilian offshore pre-salt oil reserves have first quartile costs among world reserves and a relatively low break-even at about US$36 per barrel, which means that at the current oil price they may be economical to develop, potentially leading to higher investments. Because of the lag between licensing, planning and actual investment, we expect this segment to start recovering in 2022 and 2023.
The consensus forecasts collected by the Brazilian central bank as of June 2021 point to GDP growth of 4.4% in 2021 and 2.3% in 2022. Inflation continues to be relatively benign. It is forecast to rise to 5.4% in 2021, affected by devaluation in the Brazilian real, but is expected to come down to 3.7% in 2022 and then 3.3%. This is positive since prevailing rates can remain relatively low. Better than expected GDP growth in 2020 is expected to knock down government debt by three percentage points given the passage of the budget respecting the spending limit. Private debt is very much under control, with good asset quality at most banks. Like every other country, Brazil had to spend to get through the pandemic, and, given recent reforms, was able to do it in a manageable way. The Brazilian Central Bank has regained control of the inflation fight raising rates by 150bp so far this year and is expected to raise another 300bp; this has stabilised the country at a level that will continue to benefit exports and the current account. Of course, focus needs to remain on structural reforms and respecting the spending ceiling, but Brazil seems to be in a better position today to achieve this.
Although the Bolsonaro and Temer governments have passed positive legislation in areas such as taxation and pensions, there is still work to be done regarding privatisations, bureaucracy and corruptions to further boost the recovery and long-term economic growth. Nevertheless, the country seems to be on the right track and the markets maintain a positive view on the capable economy minister, Paulo Guedes. The government is also planning a large infrastructure programme, which should help boost the economy in the coming years and reduce barriers to competition, and trade is a priority of the Bolsonaro government. The infrastructure programme will include an investment partnership programme (PPI) and involve concessions and privatisations including ports and terminals.
Consensus estimates collected by the central bank expect the Brazilian real be relatively stable against the US dollar, as shown in Exhibit 9. However, we think that as pandemic fears subside, the Brazilian real has overshot in its devaluation against the dollar, especially with the inflation differential in recent years being much less than historically, and the Brazilian real could gain against the US dollar (although we have assumed a stable real against the US dollar in our model).
|
Exhibit 7: Brazilian real/US dollar exchange rate |
Exhibit 8: Bovespa Index (three-years, rebased) |
|
|
|
Source: Refinitiv |
Source: Refinitiv |
|
Exhibit 7: Brazilian real/US dollar exchange rate |
|
|
Source: Refinitiv |
|
Exhibit 8: Bovespa Index (three-years, rebased) |
|
|
Source: Refinitiv |
Exhibit 9: Brazil economic forecasts (%) as of June 2021
|
2016 |
2017 |
2018 |
2019 |
2020 |
2021e |
2022e |
GDP growth |
-3.5 |
1.1 |
1.1 |
0.9 |
-4.1 |
4.4 |
2.3 |
Unemployment |
12.7 |
12.8 |
12.3 |
11.9 |
13.4 |
14.1 |
12.9 |
Inflation |
8.8 |
2.9 |
3.7 |
3.7 |
3.3 |
5.4 |
3.7 |
Exports growth |
2.4 |
11.4 |
7.0 |
-2.5 |
-1.4 |
5.2 |
3.6 |
Imports growth |
-9.8 |
5.1 |
6.7 |
1.0 |
-9.6 |
-7.9 |
4.4 |
$/BRL year-end (x) |
3.2 |
3.3 |
3.9 |
4.1 |
5.4 |
5.3 |
5.3 |
Source: Brazil Central Bank collected consensus, OECD, Refinitiv
Containerisation still a secular trend
The secular trend to increased containerisation in the Brazilian economy remains an important driver of growth for WSON. And with the expansion in Salvador port now completed, it has plenty of capacity for the foreseeable years. Container density in Brazil is still relatively low at 52 TEUs per 1,000 people in 2019. This is much lower than almost 198 for OECD and 79 for Latin America. More economically developed Chile is a bit of an outlier at 246 per 1,000, but this is also affected by geography.
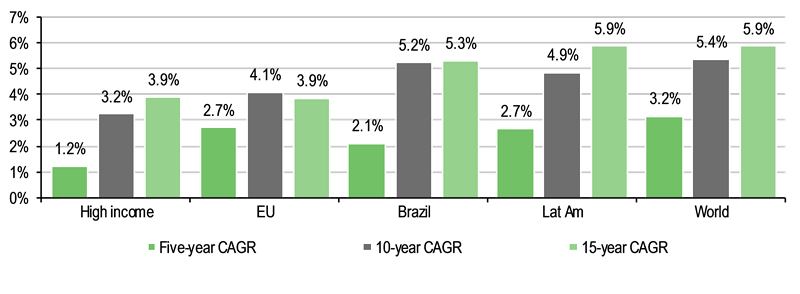
In Brazil, container volume has grown at a compound rate of 5.3% in the 15 years to 2019, compared with 2.5% GDP growth. We believe it is reasonable to expect average container volume growth of 5–6%, about twice medium-term real GDP growth estimates, especially since the government is keen to promote greater sea and river transport within Brazil and the greater use of cabotage to move goods.
|
Exhibit 10: Containers (TEU) per 1,000 people (2019) |
|
|
|
|
Source: World Bank |
|
|
Exhibit 11: Container volume CAGRs to 2019 |
|
|
|
|
Source: World Bank |
Oil price now supportive
The oil price at one point in 2020 was as low as c US$20/bbl. This had an adverse impact on investment and operations in Brazil’s very large and good-quality pre-salt reserves. The oil price is now close to US$70/bbl, which is much more supportive for oil and gas exploration.
The average break-even price for Brazilian pre-salt reserves is about US$36/bbl, with the majority of the deposits in the US$30–50/bbl range. Lifting costs are much lower and estimated at about US$8/bbl
The government has been keen to increase investment in these reserves and has introduced legislation in recent years to increase the exploration of these deposits, which used to be dominated by Petrobras. It has also successfully held permit auctions for pre-salt oil fields, which have been won by several international players.
However, consumer and investor sentiment has been moving towards lower emissions and smaller carbon footprint energy sources. This may have an adverse impact on investment decisions for oil and gas exploration and development, and may affect the outlook for the oil and gas services companies served by WSON. These companies contributed 12% to WSON’s pro-forma EBITDA in 2020.
|
Exhibit 12: Oil price over last five years (Brent crude, US$ per barrel) |
|
|
Source: Refinitiv |
Financials
Ocean Wilsons’ income and costs are essentially driven by WSON. However, the fair value adjustments in the investment portfolio business can have a significant impact below the operating profit line even though they are often non-cash.
Exhibit 13 shows WSON’s divisional forecasts. We expect WSON’s pro-forma (including the offshore vessel division, which is a 50/50% JV and is accounted as an associate company) revenue to increase by 10% y-o-y to US$451.7m in FY21 and for EBITDA to increase by 23% to US$204.2m. We expect revenue and EBITDA to increase by 5% and 8% respectively in FY22. We expect improvements in all the divisions, but the container terminals and tugboat divisions will remain the two most important divisions for growth and earnings. We are assuming that the US$/BRL exchange rate remains constant at 5.2. As pandemic concerns subside, it is possible that the Brazilian real could reverse some of its 2020/2019 losses against the US dollar, since much of the devaluation was due to sentiment rather than justified by underlying economic reasons.
At the OCN level and in terms of reported IFRS numbers, we forecast 10% revenue growth and 23% EBITDA growth for FY21, the same as for WSON. We are expecting finance expenses of US$23.1m for OCN in FY21, similar to that in FY20. However, the assumption of no further devaluation of the Brazilian real means we are not forecasting any paper FX losses in FY21, as happened in FY20 where there was a reported US$7.6m FX loss.
We are assuming a smaller return from the OWIL portfolio after a very good FY20. We are pencilling in a contribution from OWIL’s investment returns of US$23.3m in FY21 (about 7% return including a US$2.0m interest income) after a return of US$35.0m in FY20. We assume US$2m in other investment income (interest and dividends) for a total contribution of US$23.3m from OWIL in FY21 (US$35m in FY20). For FY22, we assume a 6% total return for the OWIL investment portfolio.
This adds up to our forecast of OCN’s PBT growing by 44% to US$107.8m in FY21. This represents the return on equity (ROE) climbing from 5.1% to 8.2%.
We forecast OCN’s PBT to increase 20.4% in FY22 and ROE to climb to 8.5%. We expect the earnings boost to be driven by continued recovery in WSON’s tugboat and container terminals businesses and better conditions for the oil and gas offshore platform maritime services companies. Because WSON has significant spare capacity in most of its divisions, there is a positive gearing impact on results as business volumes grow.
Exhibit 13: WSON’s segmental revenue analysis and estimates
US$m |
2018 |
2019 |
2020 |
2021e |
2022e |
Divisional net revenues |
|||||
Container Terminals |
183.0 |
167.8 |
132.2 |
144.4 |
156.1 |
O&G Terminal (Brasco) |
20.9 |
19.4 |
8.0 |
6.5 |
7.8 |
Towage |
165.6 |
159.5 |
173.6 |
189.4 |
201.0 |
Shipyards |
24.0 |
4.5 |
2.2 |
8.5 |
3.0 |
Shipping Agency |
10.0 |
9.2 |
8.1 |
8.9 |
9.5 |
Logistics |
56.9 |
45.7 |
28.7 |
30.7 |
32.0 |
Total revenue (IFRS) |
460.5 |
406.1 |
352.8 |
388.5 |
409.4 |
Offshore vessels* |
58.6 |
61.2 |
60.9 |
63.2 |
65.7 |
Total revenue (pro-forma) |
519.1 |
467.3 |
413.7 |
451.7 |
475.1 |
y-o-y (%) |
-8.8 |
-9.7 |
-11.7 |
9.2 |
5.2 |
Divisional EBITDA |
|||||
Container Terminals |
83.5 |
85.2 |
68.7 |
85.9 |
92.1 |
O&G Terminal (Brasco)* |
5.1 |
2.2* |
-0.5 |
-0.1 |
0.8 |
Towage |
79.4 |
75.8 |
85.8 |
99.0 |
104.5 |
Shipyards |
2.7 |
-0.1 |
-2.7 |
0.5 |
0.2 |
Shipping Agency |
1.2 |
1.5 |
2.3 |
2.7 |
2.9 |
Logistics |
7.1 |
10.2 |
4.5 |
6.4 |
6.4 |
Corporate |
-18.4 |
-20.6 |
-15.7 |
-19.3 |
-17.2 |
Total EBITDA (IFRS) |
160.7 |
154.2 |
142.4 |
175.1 |
189.6 |
Offshore vessels* |
27.1 |
30.0 |
31.2 |
29.1 |
32.8 |
Total EBITDA |
187.7 |
184.3 |
173.6 |
204.2 |
222.4 |
y-o-y (%) |
-10.0 |
-1.8 |
-5.8 |
17.6 |
8.9 |
Divisional EBITDA margins (%) |
|||||
Container Terminals |
45.6 |
50.8 |
52.0 |
59.5 |
59.0 |
O&G Terminal (Brasco) |
24.4 |
11.3 |
-6.3 |
-1.4 |
10.0 |
Towage |
47.9 |
47.5 |
49.4 |
52.3 |
52.0 |
Shipyards |
11.3 |
-1.7 |
-122.7 |
5.4 |
5.0 |
Shipping Agency |
12.2 |
16.4 |
28.4 |
30.8 |
30.0 |
Logistics |
12.5 |
22.4 |
15.7 |
20.9 |
20.0 |
Offshore vessels* |
46.2 |
47.9 |
51.2 |
46.1 |
50.0 |
Total EBITDA margin (pro-forma) |
36.2 |
39.3 |
42.0 |
45.6 |
46.4 |
Source: Edison Investment Research, WSON data. Note: Offshore vessels is WSON’s pro forma 50% share of the JV. *We add back the US$13m one-off asset write down in Brasco in 2019 for better comparison purposes.
We expect Ocean Wilsons to have financial net debt of US$274.5m at the end of FY21 plus another US$158.0m in financial leases for a total net debt of US$426.5m (FY20: $446.8m). Most of the debt is at low, some of it subsidised, interest rates. Adding the offshore JV debt on a 50% pro forma basis (or US$102.5m forecast for FY21), the total forecast pro-forma net debt is US$479.5m in FY21. The FY21 debt to 12-months trailing pro-forma (including JV EBITDA) group EBITDA multiple is 2.4x. With Brazilian real interest rates now lower after central bank success in fighting inflation, WSON has reduced the weight of its US dollar-linked debt to 72% of total debt.
Besides the usual maintenance capex, the key investment has been the expansion of the Salvador container terminal, which was finished in 2021. The forecast expenditure as guided by the company is shown in Exhibit 14.
|
Exhibit 14: Capital expenditure history and expectations at WSON |
|
|
Source: Wilson Sons. Note: Total figures shown include 50% share of JV. Forecast figures from Wilson Sons. |
Valuation
OCN shares reacted positively after WSON announced its restructuring on 21 May 2021. The shares climbed 21% from 937.5p and are trading at 1,139p on 18 June. WSON shares rose 27% in the same period. Since WSON accounts for two-thirds of the value of OCN look-through value, the relative movements of the two share prices have been consistent in our view.
OCN trades at a significant discount (35%) to its look-through valuation, which consists of its 57.09% stake in WSON and the OWIL investment portfolio. The discount has tightened from about 43% a year ago, but the fact that the value of the WSON stake represents 99% of OCN’s market cap reflects a very cautious valuation being applied to OCN.
We believe that a 35% discount is unjustified even though we do accept that some investors have concerns due to Ocean Wilsons’ relatively small market cap and the fact that three shareholders, Hansa Investment Company, Victualia and Chris Townsend, in total own 50.21% of the company, reducing liquidity. Positively, this ownership position enables both OWIL and WSON to maintain their long-term approaches to investment and operating the businesses.
Exhibit 15: Ocean Wilsons’ share price discount to look-through valuation
|
p |
£m |
|
Last OWIL value per Ocean Wilsons share (31 December 2020) |
617.9 |
218.5 |
35% |
Wilson Sons market value per Ocean Wilsons 57.09% share |
1,123.3 |
397.2 |
65% |
Ocean Wilsons look-through value |
1,741.2 |
615.7 |
100% |
Ocean Wilsons share price and market cap |
1,139.0 |
403.1 |
|
Discount |
35% |
35% |
Source: Refinitiv, Ocean Wilsons, Edison Investment Research. Note: US$1.42/£.
Exhibit 16 compares WSON with a selection of Brazilian and international port and shipping companies. The range of earnings and EV/EBITDA multiples is wide, and the businesses are differentiated in terms of activity and geographical exposure, but WSON trades at a significant discount to its peers even after outperforming them over the last 12 months. Its P/E ratios remain significantly lower than peers at 44% (FY21e) and 35% (FY22e) discounts. Its EV/EBITDA discounts to peers are about 30%. Our forecast ROE for 2021 of 12.8%. this is 8% below the forecasts for the peers (13.9%), but WSON trades on an FY21e P/BV of 2.1x, while its peers’ average is 2.9x.
WSON’s valuation ratios are noticeably lower than Santos Brasil, its closest peer, whose key asset is the container terminal in the Santos port in the state of São Paulo.
Exhibit 16: WSON selected comparators
Company |
Market cap (US$m) |
P/E FY21e |
P/E FY22e |
EV/EBITDA FY21 (x) |
EV/EBITDA FY22e (x) |
Price book |
ROE (%) FY21e(x) |
Wilson Sons |
966 |
11.8 |
9.8 |
7.3 |
6.7 |
2.1 |
12.8 |
Santos Brasil (BRA) |
1,557 |
52.8 |
26.0 |
15.7 |
10.8 |
3.6 |
7.0 |
China Merchants Ports (HKG) |
5,395 |
8.5 |
7.9 |
12.4 |
12.8 |
0.5 |
5.5 |
Cosco (CHN) |
2,639 |
8.5 |
7.9 |
10.5 |
9.1 |
0.5 |
6.2 |
Shanghai Int'l Port (CHN) |
16,521 |
11.0 |
10.3 |
8.5 |
8.1 |
1.1 |
10.3 |
Hamburger Hafen (GER) |
1,907 |
22.0 |
18.1 |
6.6 |
6.1 |
2.8 |
14.6 |
Intl Container Term Svcs (PHI) |
6,660 |
23.5 |
20.3 |
9.9 |
9.2 |
8.8 |
39.8 |
Average |
21.0 |
15.1 |
10.6 |
9.3 |
2.9 |
13.9 |
|
Wilson Sons vs average (%) |
-43.9 |
-35.0 |
-31.1 |
-28.2 |
-27.2 |
-7.9 |
Source: Refinitiv, Edison Investment Research. Note: Prices as at 18 June 2021.
Finally, for reference, we include a table showing the recent share performance of the same group of comparators. This shows sharply differentiated performances between the companies, arguably reflecting their varied exposures. We note that WSON’s shares have strongly outperformed the companies shown in Exhibit 17 over the last 12 months, including WSON’s most comparable Brazilian peer, Santos Brasil.
Exhibit 17: Wilson Sons’ and comparators’ performance (%)
Company |
One month |
Three months |
One year |
Ytd |
From 12-month high |
Wilson Sons |
27 |
64 |
136 |
76 |
0 |
Santos Brasil (BRA) |
11 |
34 |
60 |
13 |
-3 |
China Merchants Ports (HKG) |
-10 |
-8 |
20 |
-13 |
-14 |
Cosco (CHN) |
-7 |
-1 |
45 |
-3 |
-17 |
Shanghai Int'l Port (CHN) |
-4 |
-5 |
8 |
-20 |
-12 |
Hamburger Hafen (GER) |
3 |
6 |
49 |
-9 |
-2 |
Intl Container Term Svcs (PHI) |
14 |
27 |
61 |
23 |
-1 |
Average |
1 |
7 |
30 |
-1 |
-6 |
Source: Refinitiv, Edison Investment Research. Note: Prices as at 8 June 2021.
Exhibit 18: Financial summary
Year end 31 December |
US$m |
2019 |
2020 |
2021e |
2022e |
||
PROFIT & LOSS |
|||||||
Revenue |
|
|
406.1 |
352.8 |
388.4 |
409.4 |
|
Cash costs |
(258.3) |
(217.1) |
(221.3) |
(225.6) |
|||
EBITDA |
|
|
147.9 |
135.7 |
167.1 |
183.8 |
|
Depreciation and amortisation |
(53.7) |
(50.2) |
(48.9) |
(49.1) |
|||
Amortisation of right to use (IFRS 16) |
(12.4) |
(10.7) |
(8.9) |
(8.4) |
|||
Profit/loss on PPE |
0.3 |
(0.3) |
0.0 |
0.0 |
|||
Share of results of JVs |
0.6 |
(4.1) |
(1.7) |
0.8 |
|||
Investment portfolio returns & interest revenue |
40.8 |
35.0 |
23.3 |
24.5 |
|||
Finance costs |
(27.7) |
(23.2) |
(23.1) |
(21.8) |
|||
Exchange gains/losses on monetary items |
(0.1) |
(7.6) |
(0.1) |
0.0 |
|||
Extraordinary goodwill impairment charge |
(13.0) |
0.0 |
0.0 |
0.0 |
|||
Profit Before Tax |
82.5 |
74.6 |
107.8 |
129.8 |
|||
Profit Before Tax (norm) |
|
|
95.6 |
74.6 |
107.8 |
129.8 |
|
Income tax |
(21.5) |
(26.6) |
(30.9) |
(35.1) |
|||
Non-controlling interests |
(14.2) |
(9.3) |
(13.9) |
(24.0) |
|||
Profit After Tax (norm) |
|
|
59.9 |
38.7 |
63.0 |
70.7 |
|
Average Number of Shares Outstanding (m) |
35.4 |
35.4 |
35.4 |
35.4 |
|||
EPS - normalised (c) |
|
|
169.3 |
109.5 |
178.2 |
200.1 |
|
Dividend per share (c) |
70.0 |
70.0 |
70.0 |
70.0 |
|||
EBITDA Margin (%) |
36.4 |
38.5 |
43.0 |
44.9 |
|||
ROE (%) |
6.0% |
5.1% |
8.2% |
8.5% |
|||
|
|||||||
BALANCE SHEET |
|||||||
Fixed Assets |
|
|
1,007.5 |
887.3 |
912.6 |
912.5 |
|
Intangible Assets |
225.4 |
179.7 |
169.1 |
160.4 |
|||
Tangible Assets |
755.6 |
681.4 |
712.5 |
720.3 |
|||
Investments |
26.5 |
26.2 |
31.0 |
31.8 |
|||
Current Assets |
|
|
460.6 |
492.8 |
530.6 |
527.8 |
|
Stocks |
10.5 |
11.8 |
13.4 |
14.1 |
|||
Debtors |
82.3 |
70.3 |
77.4 |
76.5 |
|||
Cash |
69.0 |
63.3 |
64.0 |
46.4 |
|||
Trading investments |
298.8 |
347.5 |
375.8 |
390.8 |
|||
Current Liabilities |
|
|
115.7 |
124.3 |
129.9 |
132.8 |
|
Creditor |
57.1 |
47.4 |
53.9 |
56.8 |
|||
Short term borrowings & leasings |
58.6 |
76.9 |
76.0 |
76.0 |
|||
Long Term Liabilities |
|
|
540.1 |
485.9 |
486.5 |
409.8 |
|
Creditors & leasings |
470.6 |
423.7 |
420.0 |
344.7 |
|||
Other long term liabilities |
69.5 |
62.2 |
66.5 |
65.1 |
|||
Net Assets |
|
|
785.9 |
743.7 |
795.9 |
865.9 |
|
CASH FLOW |
|||||||
Operating Cash Flow |
|
|
158.6 |
144.0 |
167.1 |
177.9 |
|
Net Interest |
(29.0) |
(10.3) |
(11.2) |
(10.4) |
|||
Tax |
(23.3) |
(22.4) |
(30.9) |
(35.1) |
|||
Capex |
(85.7) |
(62.0) |
(58.4) |
(50.0) |
|||
Acquisitions/disposals |
0.0 |
0.0 |
0.0 |
0.0 |
|||
Net acq/disposals of financial assets |
20.4 |
25.0 |
0.0 |
0.0 |
|||
Equity financing |
0.0 |
0.0 |
0.0 |
0.0 |
|||
Dividends |
(24.8) |
(24.8) |
(24.8) |
(24.8) |
|||
Other (including divs from JV,fx effects) |
(18.8) |
(63.1) |
(36.9) |
(25.8) |
|||
Net Cash Flow |
(2.5) |
(13.4) |
5.0 |
31.8 |
|||
Net change in financial leases |
(194.0) |
36.3 |
(0.1) |
26.3 |
|||
Opening net debt/(cash) with leases |
|
263.6 |
460.1 |
437.3 |
432.5 |
||
Closing net debt/(cash) with leases |
|
460.1 |
437.3 |
432.5 |
374.3 |
||
|
Source: Edison Investment Research, Ocean Wilson Holdings data |
|||||||
|
|||||||||||||||||||||||||||||||||||||||||||||
|
|
Investment Companies
Research: Industrials
The declaration of the interim dividend, albeit modest, is the next step in the recovery of Smiths News as it signals that not only was trading at the interim stage in line with management expectations, but also that the company is on track to meet market expectations for the full year. Trading beyond the current year also has good visibility given that most of its contracts are in place until at least 2024. Debt is expected to fall to 1.0x EBITDA by the end of FY23, and dividends are well covered and growing. The stock trades on a forward P/E of 4.2x in FY22e, which is undemanding, with an attractive 5.6% yield.