Silver Wheaton — Update 21 October 2015

Silver Wheaton — Update 21 October 2015

Silver Wheaton

Lord Ashbourne

Written by

Lord Ashbourne

Director of Content, Mining

Silver Wheaton

Tax and other matters

CRA and H2 preview

Metals & mining

22 October 2015

Price

C$17.79

Market cap

C$7.2bn

C$1.2935/US$

Net debt (US$m) at end-June 2015

643.1

Shares in issue

403.4m

Free float

100%

Code

SLW

Primary exchange

TSX

Secondary exchange

NYSE

Share price performance

%

1m

3m

12m

Abs

10.2

7.4

(21.2)

Rel (local)

10.8

12.6

(16.3)

52-week high/low

C$29.77

C$14.76

Business description

Silver Wheaton (SLW) is the world’s pre-eminent pure precious metals streaming company with 24 precious metals streaming agreements relating to assets in Mexico, Peru, Canada, Brazil, Chile, Argentina, Sweden, Greece, Portugal, the US and Guyana.

Next events

Q3 results

3 November 2015

Fourth quarterly dividend announcement

November 2015

Analyst

Charles Gibson

+44 (0)20 3077 5724

Silver Wheaton is a research client of Edison Investment Research Limited

On 24 September, the Canada Revenue Agency (CRA) issued notices of reassessment of tax to Silver Wheaton (SLW). The notices were not unexpected and were consistent with its earlier, 6 July notice, in which it advised that it was seeking C$273m (US$205m, US$0.50/share) in tax and transfer pricing penalties for 2005-10. However, the 24 Sept notices did also quantify interest and ‘other penalties’ at C$81m (US$60m, US$0.15/share), so that the total that it is seeking is C$353m (US$265m, US$0.66/share). Compared to this amount, the US$3.98 decline in SLW’s share price since 6 July (notwithstanding a weak interim precious metals price environment) appears excessive and leaves SLW materially cheap relative to both its peers and even the operating gold mining companies, despite being associated with materially less cost and operating risk.

Year end

Revenue (US$m)

PBT*
(US$m)

EPS*
(c)

DPS
(c)

P/E
(x)

Yield
(%)

12/13

706.5

381.6

106

45

13.0

3.3

12/14

620.2

268.8

75

26

18.3

1.9

12/15e

648.8

224.4

54

22

25.5

1.6

12/16e

804.5

275.2

68

26

20.2

1.9

Note: *PBT and EPS are normalised, excluding intangible amortisation and exceptional items.

Otherwise, business as normal

Silver Wheaton’s Q215 results were noteworthy for records in both the production and the sales of silver equivalent ounces – the latter exceeding 10Moz AgE for the first time. In addition, Constancia became a material contributor. We anticipate group AgE production in H215 will be 11.6% higher than H1, largely offsetting recent declines in precious metals prices, and resulting in financial outcomes in Q3 and Q4 that are consistent with Q1 and Q2. In addition, there is also potential for inventory drawdown in H2 versus H1 after the temporary factors that disrupted the delivery of product from both San Dimas and Constancia were successfully addressed. In the meantime, the company has proposed an up to 20.2m share buyback programme to accrete value to shareholders.

Valuation: 38.2% internal rate of return in US$

Contingent on SLW’s success against the CRA, we continue to predict an ostensibly unchanged value per share of US$41.43 (C$53.59) in FY19, representing a total internal rate of return to investors at the current share price of 38.2% in US dollar terms over five years. In the meantime, we have reduced our precious metals price assumptions for H215 and FY16, which has reduced our EPS expectations accordingly. Even so, Silver Wheaton trades on financial ratios that are cheaper than its royalty/streaming ‘peers’ in three quarters of instances considered (see Exhibit 4) and are cheaper than the miners themselves in c 46% of instances, despite being associated with materially less operational and cost risks, in particular.

The Canada Revenue Agency

On 6 July, the Canada Revenue Agency (CRA) informed SLW that it was proposing to reassess its tax, such that C$715m (US$567m) of income in the years 2005-10 would be re-characterised as earned by the parent, rather than a foreign subsidiary, and would therefore be deemed taxable. SLW estimates that the tax associated with such a reassessment could be C$201m, equivalent to US$151m (28.2% implied marginal rate), or US$0.37/share. The CRA is also announced that it would be seeking a transfer pricing penalty of C$72m (US$54m, US$0.13/share) plus interest, which was not quantified at the time.

Silver Wheaton responded to the CRA at the time, defending its position. However, the CRA has declined to alter its stance with the result that, on 24 September, it issued notices of reassessment to SLW along the lines of its 6 July notice. It also quantified interest and ‘other penalties’ at C$81m (US$60m, US$0.15/share) to bring the total of interest, tax and penalties to C$353m (US$265m – equivalent to US$0.66/share).

Therefore, from 24 September, SLW has 90 days to file a notice of objection and to lodge an appeal with the CRA (a process which would typically last from one to two years). However, it has indicated that it is more likely that it will wait for a further 91 days after filing a notice of objection (ie approximately until the end of Q116), after which it will exercise its legal right to appeal directly to the Tax Court of Canada in order to reach a conclusion as quickly as possible via litigation. Initially, this would involve a case ‘discovery phase’, in which an assessment of the strengths and weaknesses of each side would be assessed. Typically, this phase takes six to nine months, during which a meaningful amount of cases are settled out of court. If no agreement can be reached then the case will proceed to court, likely to be approximately in early 2017.

Now that a notice of reassessment has been received, SLW is obliged to make a deposit of 50% of the disputed tax, interest and penalties (ie C$177m, US$133m, or US$0.33/share) upon filing a notice of objection. Note: any cash outlay will be accounted for as a refundable deposit.

A brief consideration of some of the aspects of the case

As stated in our note of 9 July, the income the CRA is seeking to tax is earned by foreign subsidiaries from assets outside Canada. Key to the CRA’s case appears to be the assertion that services bought and contracted between SLW’s Vancouver and offshore offices were mispriced and that the profit split between the two jurisdictions was therefore distorted. Silver Wheaton is limited in what it can say publicly ahead of any legal action. However, investors should be aware of three matters relevant to this assertion:

1.

Silver Wheaton’s offshore Cayman subsidiary has an independent board and management.

2.

Silver Wheaton was aware of the issue of transfer pricing long before it received the CRA’s proposal letter of 6 July. As such, it was already putting a value on the services traded between the group’s different offices. Therefore, it is not the case that no transfer pricing was being employed and hence the validity of the CRA’s case (in our opinion) will rest on the value placed upon those services, rather than whether or not they were being charged and paid for.

3.

Since 2009, Silver Wheaton has employed the deposit method of accounting for its streams, which involves the accelerated depreciation of individual streams. Therefore, in any event (and notwithstanding point 1, above), taxable income for many of SLW’s newer streams will have been zero during the period under review.

Otherwise, it remains the case that: 1) the structure and relationship between SLW and its foreign subsidiaries is common and used by many companies both globally and within Canada; 2) any ruling against SLW could expose other multinational companies operating out of Canada to similar treatment; and 3) the CRA’s approach to the 2011-14 tax years remains unclear. In our opinion, this last point may be a risk in that the CRA may seek to similarly reassess tax during 2011-14. However, it could also be an opportunity in that its approach to these years therefore appears inconsistent compared to 2005-10.

Related matters

Since the date of the CRA’s letter, a number of lawyers in the US have solicited interest among investors for a class action lawsuit on behalf of those who purchased shares of Silver Wheaton between 30 March 2011 and 6 July 2015. In broad terms, it is alleged that, during this time, SLW issued false and misleading statements to investors, failed to disclose that its financial statements contained errors concerning income tax owed from the income generated by its foreign subsidiaries, lacked adequate internal controls over its financial reporting and that, as a result, Silver Wheaton’s financial statements were false and misleading.

In our opinion, it is self-evident that the extent to which the above allegations could be true will depend upon the outcome of SLW’s litigation against the CRA. Once again, SLW is limited in what it can say publicly, other than that it believes the suits to be ‘opportunistic’ and ‘without merit’. In this respect, it is notable that SLW disclosed the fact of the CRA’s audit publicly in H112. Moreover, no class action lawsuits have been filed in Canada, but only in the US, where there are fewer and lower barriers to such actions and (often) fewer or zero initial costs. It is also notable that the class action does not appear to have garnered the support of any significant institutional shareholders, but only two small funds claiming less than US$1m in damages.

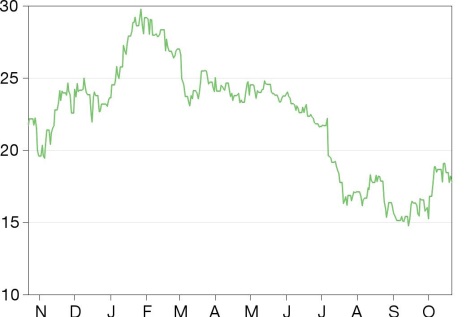
Silver Wheaton’s shares have fallen by US$3.98 since its receipt of the CRA’s original proposal letter on 6 July (the vertical line in Exhibit 1), although it is notable that the interim timespan has also coincided with a renewed period of weak precious metals prices.

Exhibit 1: Silver Wheaton share price, year to date (US dollars)

Source: Thomson Reuters Datastream, Edison Investment Research

However, whatever the cause, the extent of the share price decline is significantly in excess of the direct 66c per share being sought by the CRA. As such, the market, in this instance, appears to be discounting material, additional future income tax liabilities.

Business as usual – the evolving year

Since the end of the second quarter, notable announcements have been made by the operators of at least three assets with which Silver Wheaton has streaming agreements, including one revised mine plan. Summaries of these announcements are below.

Minto (Yukon, Canada)

The Minto deposit is spread over a series of high-grade areas interspersed with large deposits of low-grade material. The mine plan was designed for the highest-grade deposits to be mined sequentially in a series of small pits supplemented with additional ore from underground. Hitherto, the 2015 mine plan reflected the delay in receiving surface mining permits for Minto North, which contains the highest-grade open-pit reserves remaining on the property, shifting the bulk of production from Minto North into 2016. In the meantime, Minto South underground ore production, which began in late 2014, is budgeted to continue until November 2015, pausing while the mill processes Minto North ore and access is developed for the next area of underground mining. Production is expected to resume from underground in mid-2016.

However, on 5 August, Capstone announced that it had successfully received its new water use licence (WUL) for Minto, thereby completing the final stage of permitting relating to the July 2012 Phase VI pre-feasibility study (PFS) and allowing stripping at the high-grade, shallow Minto North deposit to start. Therefore, for the balance of 2015, the mill will continue to process underground and stockpiled ore, with ore from North Minto being fed into the mill from December 2015. In 2016, the mill will predominately process ore from Minto North (including a notable high-grade zone in Q216), supplemented by underground and stockpiled ore.

Despite delays surrounding the grant of a new WUL, production at Minto nevertheless continued above plan in Q2. In particular, ore from Area 118 underground continued to run significantly above model grades, while enhanced mining practices resulted in lower than expected dilution. Further unplanned production originated from the Area 2 Stage 2 pit above the water storage level, with the result that Minto is now expected to surpass its 2015 production guidance. In addition, the mine plan has been revised to allow Minto North to be mined in a staged approach to mitigate some of the WUL delay.

Penasquito (Mexico)

Penasquito achieved record gold production in Q2, with the result that output for the full year is similarly expected to be at ‘the high end’ of 2015 guidance. Output was driven by higher than expected sulphide grades and substantial mining taking place in ‘the heart of the deposit’.

Elsewhere, progress on the construction of the northern well field (NWF) has been limited owing to concerns continuing to be expressed by the local communities Remaining work has now been suspended. Goldcorp is evaluating potential mitigation strategies and contingency plans also remain in place for a fresh water supply until the NWF is fully operational.

In the meantime, the Metallurgical Enhancement Project (MEP) continues to demonstrate the potential to significantly enhance the overall economics and mine life of Penasquito. Pilot plant construction was completed in Q2 and testing started. MEP permit applications were submitted in May 2015 and the feasibility study remains on track to complete in early 2016.

Stratoni (Greece)

On 20 August, Hellas Gold (a subsidiary of Eldorado) announced that it was to suspend all mining and development activities in Halkidiki (including the Stratoni mine) from 24 August. It added that the suspension was ‘a direct result of the revocation by Greece's Ministry of Energy of the technical studies of its projects in Halkidiki’.

However, on 5 October, Eldorado further announced that Greece's Council of State (the country's supreme court on administrative and environmental matters) has issued an injunction relief in favour of the Labour Center of Halkidiki and the labour unions representing the workers of Hellas Gold, which revokes the decisions of Greece's Ministry of Energy and Environment until it (The Council of State) issues a final ruling on the matter ‘at some point in the near future.’ As a result, Eldorado confirmed that it will immediately resume mining and construction activities in Halkidiki.

Therefore, we have adjusted our estimates to reflect approximately six weeks of lost production at Stratoni, albeit the effect is negligible – amounting to only US$1.6m, or just 0.7%, of (revised) net earnings.

Quarterly forecasts

A summary of our operating and financial forecasts for Silver Wheaton in Q3 and Q415 (at revised metals prices and in the light of the changes considered above) is given in the table below. In addition, investors should note that deliveries of product from both Constancia and San Dimas were disrupted in Q2 by a number of temporary factors, which have now been addressed, creating the opportunity for inventory drawdown in H2 vs H1.

Exhibit 2: Silver Wheaton forecasts, Q1-Q415, by quarter

US$000s (unless otherwise stated)

FY14**

Q115

Q215e

Q215a

Q215 vs Q115 (%)

Q215a vs Q215e (%)

Q315e

Q415e

FY15e (current)

FY15e vs FY14a

Silver production (koz)

25,674

6,342

6,407

7,201

13.5

12.4

7,212

7,065

27,820

8.4

Gold production (oz)

142,815

55,106

53,085

50,509

-8.3

-4.9

54,070

63,381

223,066

56.2

AgE production (koz)

35,285

10,371

10,265

10,904

5.1

6.2

11,290

11,737

44,196

25.3


Silver sales (koz)

23,484

5,665

6,407

5,575

-1.6

-13.0

7,212

7,065

25,517

8.7

Gold sales (oz)

139,522

28,399

53,085

60,974

114.7

14.9

54,070

63,381

206,824

48.2

AgE sales (koz)

32,891

7,723

9,971

10,043

30.0

0.7

11,290

11,737

40,740

23.9


Avg realised Ag price (US$/oz)

18.92

16.95

16.40

16.42

-3.1

0.1

14.90

15.82

15.94

-15.8

Avg realised Au price (US$/oz)

1,261

1,214

1,192

1,195

-1.6

0.3

1,124

1,166

1,170

-7.2

Avg realised AgE price (US$/oz)

18.86

16.90

16.40

16.38

-3.1

-0.1

14.90

15.82

15.93

-15.5


Avg Ag cash cost (US$/oz)

4.14

4.14

4.50

4.26

2.9

-5.3

4.55

4.57

4.40

6.3

Avg Au cash cost (US$/oz)

386

388

394

395

1.8

0.3

395

392

393

1.8

Avg AgE cash cost (US$/oz)

4.59

4.46

4.85

4.76

6.7

-1.9

4.80

4.87

4.75

3.5


Sales

620,176

130,504

168,344

164,435

26.0

-2.3

168,228

185,673

648,840

4.6

Cost of sales


Cost of sales, excluding depletion

151,097

34,464

49,748

47,795

38.7

-3.9

54,157

57,110

193,526

28.1

Depletion

160,180

32,045

49,998

53,327

66.4

6.7

54,388

58,056

197,815

23.5

Total cost of sales

311,277

66,509

99,746

101,122

52.0

1.4

108,545

115,166

391,341

25.7

Earnings from operations

308,899

63,995

68,598

63,313

-1.1

-7.7

59,683

70,507

257,498

-16.6

Expenses and other income


- General and administrative*

37,860

8,170

8,000

7,886

-3.5

-1.4

6,486

6,486

29,028

-23.3

- Foreign exchange (gain)/loss

(609)

(373)

0

-100.0

(373)

-38.8

- Net interest paid/(received)

2,277

1,500

858

798

-46.8

-7.0

888

888

4,073

78.9

- Other (income)/expense

2,439

2,297

1,190

992

-56.8

-16.6

1,190

1,190

5,669

132.4

Total expenses and other income

41,967

11,594

10,048

9,676

-16.5

-3.7

8,564

8,564

38,397

-8.5

Earnings before income taxes

266,932

52,401

58,550

53,637

2.4

-8.4

51,120

61,943

219,101

-17.9

Income tax expense/(recovery)

(1,045)

2,982

0

(89)

N/A

N/A

2,893

-376.8

Marginal tax rate (%)

-0.4

5.7

0.0

-0.2

N/A

N/A

0.0

0.0

1.3

-437.3

Net earnings

267,977

49,419

58,550

53,726

8.7

-8.2

51,120

61,943

216,208

-19.3


Basic EPS (US$)

0.75

0.13

0.15

0.13

0.0

-13.3

0.13

0.15

0.54

-26.9

Diluted EPS (US$)

0.74

0.13

0.15

0.13

0.0

-13.3

0.13

0.15

0.54

-26.9

Source: Silver Wheaton, Edison Investment Research. Note: *Forecasts exclude stock-based compensation, **excluding impairments.

Our estimate of 54c for FY15 compares to an average consensus basic EPS estimate of 53c, within the range 48-58c (excluding Edison, source: Bloomberg, 19 October 2015). Note that FY16 estimates have been similarly revised to reflect lower precious metals prices (forecast US$16.11/oz Ag and US$1,224/oz Au). In this case, our basic EPS estimate of 68c (see Exhibit 5) compares to an average consensus estimate of 61c, within the range 32-77c.

Longer-term developments

Rosemont

Widely considered a world-class deposit, Hudbay is currently negotiating the permitting process at Rosemont and has stated that it ‘remains committed’ to the US$1.2m development of the mine. Silver Wheaton has entered a streaming deal with Rosemont, whereby it will purchase 100% of the life-of-mine output of silver and gold at Rosemont in return for a US$230m investment (note SLW’s only material future capital commitment). Whereas this had previously been expected to begin in FY18 however, comments by Hudbay to the effect that it hopes to bring the project to ‘a construction decision’ in 2016 suggest that a more likely date for commercial production is FY19, after a two-year period of construction.

Valuation

The effect of a one-year delay in the Rosemont timetable reduces our forecast of SLW’s EPS in FY19 only marginally, from US$1.68 to US$1.64.

Excluding FY04 (part year) and FY08 (during which there was an exceptional write-down), Silver Wheaton's shares have historically traded on an average P/E multiple of 25.3x current-year basic EPS (cf 25.5x currently).

Exhibit 3: Silver Wheaton historic current year P/E multiples

Source: Edison Investment Research. Note: FY14 EPS excludes impairment charge.

Applying this multiple to our updated long-term EPS forecast of US$1.64 per share in FY19 (vs US$1.68 previously) implies a potential share value of US$41.43, or C$53.59 (cf US$42.38 or C$51.61 previously).

In the meantime, the table below shows Silver Wheaton’s current rating on a number of valuation measures relative to both a sample of its ‘peer’ royalty/streaming companies and a sample of gold miners. Using our forecasts in Exhibits 2 and 5, it is notable that Silver Wheaton trades on multiples that are cheaper than its royalty/streaming ‘peers’ in three quarters of instances considered. It also trades on multiples that are cheaper than the gold miners themselves in c 46% of instances considered, despite being associated with materially less operational and cost risks, in particular.

Exhibit 4: Silver Wheaton comparative valuation vs a sample of operating and royalty/streaming companies

P/E (x)

Yield (%)

P/CF

Year 1

Year 2

Year 1

Year 2

Year 1

Year 2

Royalty companies

Franco-Nevada

89.4

81.8

1.6

1.6

26.4

23.8

Royal Gold

36.1

27.4

1.7

1.8

12.7

11.0

Sandstorm Gold

N/A

N/A

0.0

0.0

10.3

10.0

Osisko

48.2

43.6

0.8

0.9

38.7

25.6

Average

57.9

50.9

1.0

1.1

22.0

17.6

Silver Wheaton (our forecasts)

26.2

20.9

1.6

1.8

12.6

10.8

SLW (consensus)

27.2

23.5

1.4

1.6

13.8

11.5

Operators

Barrick

26.2

17.7

1.8

1.2

4.0

3.9

Newmont

18.0

23.4

0.5

0.3

4.7

5.1

Goldcorp

79.7

45.4

2.9

1.5

9.2

8.0

Newcrest

23.9

15.7

0.2

1.1

9.0

7.5

Kinross

N/A

N/A

0.0

0.0

3.3

3.1

Agnico-Eagle

89.2

73.1

1.1

1.1

9.6

9.4

Eldorado

70.9

43.2

0.5

0.5

13.1

10.9

Yamana

N/A

128.0

2.5

2.5

4.7

3.7

Average

51.3

49.5

1.2

1.0

7.2

6.4

Source: Bloomberg, Edison Investment Research. Note: Peers priced on 19 October 2015.

Exhibit 5: Financial summary

US$000s

2012

2013

2014

2015e

2016e

Dec

IFRS

IFRS

IFRS

IFRS

IFRS

PROFIT & LOSS

Revenue


849,560

706,472

620,176

648,840

804,450

Cost of Sales

(117,489)

(139,352)

(151,097)

(193,526)

(247,491)

Gross Profit

732,071

567,120

469,079

455,314

556,959

EBITDA


701,232

531,812

431,219

426,286

527,931

Operating Profit (before amort. and except.)

600,003

387,659

271,039

228,470

277,708

Intangible Amortisation

0

0

0

0

0

Exceptionals

0

0

(68,151)

0

0

Other

788

(11,202)

(1,830)

(5,296)

0

Operating Profit

600,791

376,457

201,058

223,174

277,708

Net Interest

0

(6,083)

(2,277)

(4,073)

(2,555)

Profit Before Tax (norm)


600,003

381,576

268,762

224,397

275,153

Profit Before Tax (FRS 3)


600,791

370,374

198,781

219,101

275,153

Tax

(14,755)

5,121

1,045

(2,893)

0

Profit After Tax (norm)

586,036

375,495

267,977

216,208

275,154

Profit After Tax (FRS 3)

586,036

375,495

199,826

216,208

275,153

Average Number of Shares Outstanding (m)

353.9

355.6

359.4

396.9

403.4

EPS - normalised (c)


166

106

75

54

68

EPS - normalised and fully diluted (c)


165

105

74

54

68

EPS - (IFRS) (c)


166

106

56

54

68

Dividend per share (c)

35

45

26

22

26

Gross Margin (%)

86.2

80.3

75.6

70.2

69.2

EBITDA Margin (%)

82.5

75.3

69.5

65.7

65.6

Operating Margin (before GW and except.) (%)

70.6

54.9

43.7

35.2

34.5

BALANCE SHEET

Fixed Assets


2,403,958

4,288,557

4,309,270

4,981,955

4,801,731

Intangible Assets

2,281,234

4,242,086

4,270,971

4,943,656

4,763,432

Tangible Assets

1,347

5,670

5,427

5,427

5,427

Investments

121,377

40,801

32,872

32,872

32,872

Current Assets


785,379

101,287

338,493

570,652

927,235

Stocks

966

845

26,263

756

938

Debtors

6,197

4,619

4,132

4,444

5,510

Cash

778,216

95,823

308,098

565,452

920,788

Other

0

0

0

0

0

Current Liabilities


(49,458)

(21,134)

(16,171)

(28,414)

(35,954)

Creditors

(20,898)

(21,134)

(16,171)

(28,414)

(35,954)

Short term borrowings

(28,560)

0

0

0

0

Long Term Liabilities


(32,805)

(1,002,164)

(1,002,856)

(999,963)

(999,963)

Long term borrowings

(21,500)

(998,136)

(998,518)

(998,518)

(998,518)

Other long term liabilities

(11,305)

(4,028)

(4,338)

(1,445)

(1,445)

Net Assets


3,107,074

3,366,546

3,628,736

4,524,230

4,693,049

CASH FLOW

Operating Cash Flow


720,209

540,597

434,582

458,427

534,225

Net Interest

0

(6,083)

(2,277)

(4,073)

(2,555)

Tax

(725)

(154)

(204)

(5,786)

0

Capex

(641,976)

(2,050,681)

(146,249)

(870,500)

(70,000)

Acquisitions/disposals

0

0

0

0

0

Financing

12,919

58,004

6,819

769,000

0

Dividends

(123,852)

(160,013)

(79,775)

(89,714)

(106,334)

Net Cash Flow

(33,425)

(1,618,330)

212,896

257,354

355,336

Opening net debt/(cash)


(761,581)

(728,156)

902,313

690,420

433,066

HP finance leases initiated

0

0

0

0

0

Other

0

(12,139)

(1,003)

0

0

Closing net debt/(cash)


(728,156)

902,313

690,420

433,066

77,730

Source: Company sources, Edison Investment Research

Edison, the investment intelligence firm, is the future of investor interaction with corporates. Our team of over 100 analysts and investment professionals work with leading companies, fund managers and investment banks worldwide to support their capital markets activity. We provide services to more than 400 retained corporate and investor clients from our offices in London, New York, Frankfurt, Sydney and Wellington. Edison is authorised and regulated by the Financial Conduct Authority (www.fsa.gov.uk/register/firmBasicDetails.do?sid=181584). Edison Investment Research (NZ) Limited (Edison NZ) is the New Zealand subsidiary of Edison. Edison NZ is registered on the New Zealand Financial Service Providers Register (FSP number 247505) and is registered to provide wholesale and/or generic financial adviser services only. Edison Investment Research Inc (Edison US) is the US subsidiary of Edison and is regulated by the Securities and Exchange Commission. Edison Investment Research Limited (Edison Aus) [46085869] is the Australian subsidiary of Edison and is not regulated by the Australian Securities and Investment Commission. Edison Germany is a branch entity of Edison Investment Research Limited [4794244]. www.edisongroup.com

DISCLAIMER
Copyright 2015 Edison Investment Research Limited. All rights reserved. This report has been commissioned by Silver Wheaton and prepared and issued by Edison for publication globally. All information used in the publication of this report has been compiled from publicly available sources that are believed to be reliable, however we do not guarantee the accuracy or completeness of this report. Opinions contained in this report represent those of the research department of Edison at the time of publication. The securities described in the Investment Research may not be eligible for sale in all jurisdictions or to certain categories of investors. This research is issued in Australia by Edison Aus and any access to it, is intended only for "wholesale clients" within the meaning of the Australian Corporations Act. The Investment Research is distributed in the United States by Edison US to major US institutional investors only. Edison US is registered as an investment adviser with the Securities and Exchange Commission. Edison US relies upon the "publishers' exclusion" from the definition of investment adviser under Section 202(a)(11) of the Investment Advisers Act of 1940 and corresponding state securities laws. As such, Edison does not offer or provide personalised advice. We publish information about companies in which we believe our readers may be interested and this information reflects our sincere opinions. The information that we provide or that is derived from our website is not intended to be, and should not be construed in any manner whatsoever as, personalised advice. Also, our website and the information provided by us should not be construed by any subscriber or prospective subscriber as Edison’s solicitation to effect, or attempt to effect, any transaction in a security. The research in this document is intended for New Zealand resident professional financial advisers or brokers (for use in their roles as financial advisers or brokers) and habitual investors who are “wholesale clients” for the purpose of the Financial Advisers Act 2008 (FAA) (as described in sections 5(c) (1)(a), (b) and (c) of the FAA). This is not a solicitation or inducement to buy, sell, subscribe, or underwrite any securities mentioned or in the topic of this document. This document is provided for information purposes only and should not be construed as an offer or solicitation for investment in any securities mentioned or in the topic of this document. A marketing communication under FCA Rules, this document has not been prepared in accordance with the legal requirements designed to promote the independence of investment research and is not subject to any prohibition on dealing ahead of the dissemination of investment research.
Edison has a restrictive policy relating to personal dealing. Edison Group does not conduct any investment business and, accordingly, does not itself hold any positions in the securities mentioned in this report. However, the respective directors, officers, employees and contractors of Edison may have a position in any or related securities mentioned in this report. Edison or its affiliates may perform services or solicit business from any of the companies mentioned in this report. The value of securities mentioned in this report can fall as well as rise and are subject to large and sudden swings. In addition it may be difficult or not possible to buy, sell or obtain accurate information about the value of securities mentioned in this report. Past performance is not necessarily a guide to future performance. Forward-looking information or statements in this report contain information that is based on assumptions, forecasts of future results, estimates of amounts not yet determinable, and therefore involve known and unknown risks, uncertainties and other factors which may cause the actual results, performance or achievements of their subject matter to be materially different from current expectations. For the purpose of the FAA, the content of this report is of a general nature, is intended as a source of general information only and is not intended to constitute a recommendation or opinion in relation to acquiring or disposing (including refraining from acquiring or disposing) of securities. The distribution of this document is not a “personalised service” and, to the extent that it contains any financial advice, is intended only as a “class service” provided by Edison within the meaning of the FAA (ie without taking into account the particular financial situation or goals of any person). As such, it should not be relied upon in making an investment decision. To the maximum extent permitted by law, Edison, its affiliates and contractors, and their respective directors, officers and employees will not be liable for any loss or damage arising as a result of reliance being placed on any of the information contained in this report and do not guarantee the returns on investments in the products discussed in this publication. FTSE International Limited (“FTSE”) © FTSE 2015. “FTSE®” is a trade mark of the London Stock Exchange Group companies and is used by FTSE International Limited under license. All rights in the FTSE indices and/or FTSE ratings vest in FTSE and/or its licensors. Neither FTSE nor its licensors accept any liability for any errors or omissions in the FTSE indices and/or FTSE ratings or underlying data. No further distribution of FTSE Data is permitted without FTSE’s express written consent.

Frankfurt +49 (0)69 78 8076 960

Schumannstrasse 34b

60325 Frankfurt

Germany

London +44 (0)20 3077 5700

280 High Holborn

London, WC1V 7EE

United Kingdom

New York +1 646 653 7026

245 Park Avenue, 39th Floor

10167, New York

US

Sydney +61 (0)2 9258 1161

Level 25, Aurora Place

88 Phillip St, Sydney

NSW 2000, Australia

Wellington +64 (0)48 948 555

Level 15, 171 Featherston St

Wellington 6011

New Zealand

Snakk Media — Update 8 October 2015

Snakk Media

Continue Reading

Subscribe to Edison

Get access to the very latest content matched to your personal investment style.

Sign up for free