Last close As at 06/08/2026
—
— 0.00 (0.00%)
Market capitalisation
—
Research: Financials
Park Group
Park Group |
Product innovation continues with Mastercard |
Company outlook |
Financial services |
10 February 2017 |
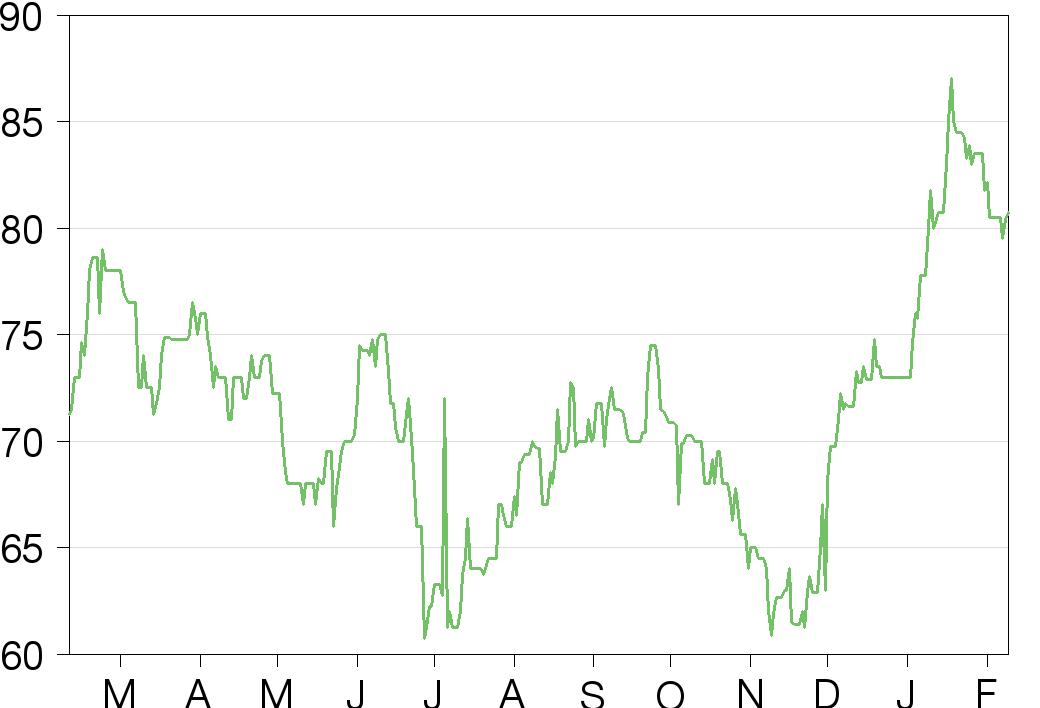
Share price performance
Business description
Next events
Analysts
Park Group is a research client of Edison Investment Research Limited |
|||||||||||||||||||||||||||||||||||||||||||||||
Park’s approval as a licensed Mastercard issuer will support further new product initiatives and is a useful third-party vote of confidence in the robustness and security of Park’s systems. However, Park is a story of continual innovation and transformation, driven by e-commerce investment, aimed at better meeting the needs of a broadening customer base. The strategy has built a solid record of sales, profits and dividend growth, which we expect to continue, funded by a cash-generative business model with a debt-free balance sheet.
Year end |
Billings** |
PBT |
EPS* |
DPS |
P/E |
Yield |
03/15 |
372.9 |
10.9 |
4.6 |
2.40 |
17.6 |
3.0 |
03/16 |
385.0 |
11.9 |
5.2 |
2.75 |
15.5 |
3.4 |
03/17e |
408.7 |
12.4 |
5.4 |
2.90 |
15.0 |
3.6 |
03/18e |
440.4 |
13.4 |
5.7 |
3.05 |
14.2 |
3.8 |
Note: PBT and EPS are on a statutory basis. *Fully diluted **billings is a non-statutory measure of sales defined as the face value of voucher sales and the amount of value loaded on to prepaid cards.
Mastercard adds additional product flexibility…
Having successfully trialled the Anywhere and Online pre-paid cards that allow customers to spend broadly at any Mastercard-accepting outlet using a third-party issuer, Park has become a licensed issuer in its own right. It will soon issue a digital prepaid card for online use at selected retailers and later in the year will provide a physical card for any Mastercard-accepting outlet. Customers have shown that in some cases they are willing to pay the premium required to gain broad retailer access, outside of the highly diversified but closed loop of Park retail partners. This new option enhances customer choice and should cost effectively support Park’s strategy of opening up new markets and reaching new customers.
…and ongoing strategy of e-commerce enablement
Ongoing investment in digital technology to support e-commerce has been at the centre of Park’s growth strategy over a number of years, and we expect that growth to continue. Constant innovation has supported steady growth in Christmas savings and has allowed the Corporate division, based around incentive and rewards services, to grow strongly into what is a very large target market (£5bn pa as defined by the UK Gift Card & Voucher Association). Digitalisation and a small EU presence in the Republic of Ireland (RoI) are opening up new territories and new markets.
Fair value increase keeps pace with share price
The shares have performed very strongly over the past three months, reducing the upside to our revised fair value, rolled forward by a year, of 88p (was 78p), which we base on our absolute DCF valuation of 90p per share and a P/E relative comparison with businesses that share similar characteristics (86p per share). Park’s earnings would benefit from an increase in interest rates.
Investment summary
Transformation and growth via e-commerce
Park has pursued a consistent strategy for growth and development over the past decade and, despite the ups and downs of the economy, has built a strong track record of sales, earnings and dividend growth over several years (Exhibits 2 and 3). Long-term ongoing investment in digital technology has been a key feature, supporting product innovation and distribution reach, customer convenience, and operational efficiency. This constant innovation supports steady growth in Christmas savings and has allowed the Corporate division, based around incentive and rewards services, to grow strongly into a very large target market (£5bn pa as defined by the UK Gift Card & Voucher Association). Digitalisation and a small EU presence in the RoI are opening up new territories and markets. The business model is highly cash generative, capable of funding ongoing investment and progressive, well-covered dividend payments, with a debt-free balance sheet.
Valuation: Increases to 89p referencing DCF and peers
A lack of directly comparable quoted peers makes it more difficult to value Park on a relative basis. Our revised current fair value, rolled forward by a year, is 88p (was 78p), which we base on our absolute DCF valuation of 90p per share and a P/E relative comparison with businesses that share similar characteristics (86p per share). Having performed very strongly over the past three months the shares are trading not far from this value, but the cash generative nature of the business, a debt-free balance sheet, a well-supported yield, and continued opportunities for growth are all positive factors with the potential to lift valuation. Park is also a beneficiary of an eventual increase in interest rates, earning interest on substantial customer cash balances; a 50bp increase in achieved rates would lift our forecast annual PBT by c 6%.
Financials: FY17 estimates trimmed
We have updated our estimates based on the new information contained within the FY17 interim results, and we have introduced for the first time a FY18 estimate. We have trimmed our (Corporate division) billings estimates slightly after a slower start to the year than we had expected. Management reports a strong H2 pipeline and a good start to Christmas 2017 marketing. The post EU referendum interest rate cut also impacts negatively. Nevertheless, we look for another year of profitability and dividend growth and for this to carry over into FY18.
Exhibit 1: Forecast changes
Billings (£m) |
Revenues (£m) |
IFRS PBT (£m) |
Reported EPS |
DPS (p) |
|||||||||||
|
New |
Old |
Change |
New |
Old |
Change |
New |
Old |
Change |
New |
Old |
Change |
New |
Old |
Change |
03/17e |
408.7 |
415.0 |
-2% |
310.6 |
315.8 |
-2% |
12.4 |
12.9 |
-4% |
5.35 |
5.61 |
-5% |
2.90 |
2.90 |
0% |
03/18e |
440.4 |
N/A |
N/A |
323.1 |
N/A |
N/A |
13.4 |
N/A |
N/A |
5.74 |
N/A |
N/A |
3.05 |
N/A |
N/A |
Source: Edison Investment Research
Sensitivities
The key sensitivities to our forecasts (discussed on page 15) are:
■
Economic growth and interest rates
■
The impact of interest rates on cash balances
■
Brand perception and customer confidence, especially in the Christmas savings operation
■
Business continuity and IT systems
■
Regulation
Innovative, well-established financial services business
Park Group is a specialised financial services business. It has come a very long way since being established in 1966 by Peter Johnson, who retired as chairman in 2016. Park began as a Christmas hampers supplier, but under Peter Johnson’s leadership and with the support of the current executive team (in place since 2004) the group has been transformed into the multi-million pound voucher, prepaid card, incentive and reward specialist that it is today.
|
Exhibit 2: Billings (sales) and PBT (£m) |
Exhibit 3: EPS and DPS history and forecasts (p) |
|
|
|
Source: Park Group, Edison Investment Research. Note: Billings is a non-statutory definition of sales. |
Source: Park Group, Edison Investment Research |
|
Exhibit 2: Billings (sales) and PBT (£m) |
|
|
Source: Park Group, Edison Investment Research. Note: Billings is a non-statutory definition of sales. |
|
Exhibit 3: EPS and DPS history and forecasts (p) |
|
|
Source: Park Group, Edison Investment Research |
Park has a strong track record of growth in sales, profits, and dividends and has become one of the UK’s leading providers of multi-retailer gift vouchers and prepaid cards, with distribution focused on the corporate (45% of FY16 billings) and consumer (55% of FY16 billings) markets.
|
Exhibit 4: Park Group retailers, customers, products and distribution |
|
|
Source: Park Group, Edison Investment Research |
The group is structured into a Consumer division (55% of sales), of which the vast majority (97%) is Christmas savings, and a Corporate division. Christmas savings enable customers to plan for Christmas, giving certainty over costs and providing a disciplined approach to saving. Customers purchase vouchers and prepaid cards, gifts, and in a minority of cases hampers, on a 45-week prepaid instalment plan. The Corporate division supplies a range of products including Park’s own vouchers and prepaid cards as well as individual retailer-branded vouchers and travel services. These are mainly used by corporate customers for incentive and reward schemes as well as for on-sale to their own customers.
The Love2shop voucher is the UK’s leading multi-retail gift voucher, accepted at more than 150 major retailers covering more than 20,000 stores across the UK and Ireland. Park’s FCA-authorised prepaid card, flexecash, was developed in-house over three years and introduced in 2010. It is now accepted by 95 retail brands covering c 13,000 outlets and it continues to be a major driver of underlying business development. Compared with vouchers it provides a broader, more flexible product offering that can be tailored to the customer and serviced online, while providing a secure and convenient alternative for customers to use. End-users can access online retailers using e-codes, obtained from the cardholders’ e-wallet account, or a digital Mastercard version of flexecash. In addition, Argos has recently begun to accept the existing flexecash card online, and Park expects other retail partners to follow. Historically, redemption of vouchers and cards has only been possible within Park’s network of retail partners from which it receives service fees; however, the digital Mastercard, offered alongside the existing products, is a broader-use prepaid card product that can be spent at any outlet accepting Mastercard or online, for which the customer pays a small premium. Park has recently become a licensed Mastercard issuer with plans for further product extensions, discussed below.
Consistent strategy for growth
Park has pursued a consistent strategy for growth and development over the past decade. Application of the strategy may have been consistent but certainly not static, with long-term ongoing investment in digital technology a key feature, supporting product innovation and distribution reach, convenience and efficiency. The strategy can be summarised as:
■
Enhancing the retailer proposition, optimising, and where possible, increasing the number of retailers. In FY16 Park continued to broaden the range of retailers and through the ‘Combi’ card has been able to give customers access to major retailers such as Asda and Primark that would otherwise be unavailable to them. The Mastercard arrangement was first introduced with the Anywhere card but is to be expanded, enhancing customer choice.
■
Growing the multi-channel offering, reaching as many potential customers as possible and making it easy for them to engage with Park. Recent progress has involved optimising group websites for mobile and tablet devices to support the growing preference of customers to transact through this medium.
■
Expanding the customer base and customer reach, in particular using digital solutions to cost effectively reach and support new markets and new customers. Having introduced flexecash into Europe, Park has been adding European brands to its retailer portfolio to support new European markets. Park’s recently introduced corporate online instant incentivisation platform, ‘Evolve’ is attracting interest from UK-based clients with overseas customers or staff.
■
Developing and exploiting the product and distribution infrastructure, allowing further product innovation, added systems functionality and improved service.
Park continues to focus on digital technology, driving product innovation and harnessing the distribution opportunities of the internet, online and mobile channels, including social media, significantly enhancing interaction with its customers. Annual IT investment is c £3m pa, the majority of which is expensed. We believe this investment has been the key factor behind the group’s growth in what have sometimes been challenging market conditions in its main distribution channels (UK small and mid-sized businesses and consumers) and depressed interest earnings on its substantial cash balances.
The flexecash prepaid card and the many product innovations that have been based on it provide a broader, more flexible product offering that can be tailored to the customer and serviced online. Past product extensions include cards that can be reloaded by internet or mobile and flexecodes (which allow customers to shop online at branded websites including Amazon using a secure digital code provided by Park). The Mastercard licensing agreement, of which more below, is the latest example of flexecash innovation. Products using the flexecash card engine are generating more business from existing customers and winning new customers, sometimes in new distribution areas (for example, the charity and insurance sectors).
The popularity of computer and smart device usage continues to change the way that customers interact with Park fundamentally; the majority of orders are now placed this way across both the consumer and corporate distribution channels and most customers are now managing their accounts and programmes directly online. Social media, particularly Facebook where Park has 95,000 followers, is now an important link with customers and provides valuable insights into customer issues and preferences.
Selective acquisitions
In addition to its organic growth plans, Park is open to acquisition opportunities as they arise and when they meet strategic and financial criteria. Management has been very selective in recent years, acquiring a toe-hold in the eurozone with the acquisition of Celtic Hampers (re-named Park Ireland) in 2010, and more recently adding to its corporate proposition with the acquisition of Fisher Moy International (FMI) in October 2016. FMI is a specialist in corporate employee and customer engagement and communications programmes. It is relatively small but management reports that it is profitable, debt free and, without disclosing the price, that the acquisition should be modestly earnings enhancing in the first full year of ownership. FMI, which Park has worked with in the past, is intended to enhance the existing position in corporate incentivisation and reward with potential for Park to assist FMI in targeting larger businesses.
A platform for European expansion
Management has made clear its interest in using technology to enter new European markets over the medium term, combining Park’s own digital product development and e-commerce capabilities, supported by EU cross-border portability of its e-money licence. We estimate that Europe-originated sales are currently less than 5% of the total but will become a more material contributor over the medium term. We see the European opportunity most clearly for the Corporate division, where a broadening European footprint should also support the group’s existing UK business, especially existing UK corporate incentive customers that operate on a pan-European basis.
Mastercard licensing provides an ‘open loop’ option
The vouchers and flexecash prepaid cards that Park has until recently offered can be spent at those outlets where Park has a relationship. Although flexecash is similar in appearance to a bank-issued debit or credit card there are technical differences (flexecash has a 19-digit card number compared with 16 digits for Mastercard), but both can be processed by the supplier using the same point-of-sale machine.
In 2016, Park established a relationship with Mastercard, allowing it to introduce broader use products such as the Anywhere and Online cards. The customer pays a small premium (up to c 10% of the face value on cards that can be redeemed anywhere), which gives them the freedom to spend the embedded value at any outlet that accepts Mastercard rather than be just those outlets with a Love2shop relationship. Park’s analysis indicates that c 50% of its Consumer division customer base does not possess a credit card and therefore value the expanded access to retail outlets that the Mastercard-supported cards provide. Park indicates billings of c £8m in the current financial year, growing rapidly, with the potential to quickly double. To provide these cards, Park has used a third-party Mastercard-licensed issuing bank as well as a third-party card processor that holds the card balance and instructs Park on how much to pay Mastercard; it considers the expense of developing its own processing to be uneconomic currently. The arrangement has also involved Park transferring the card value to the issuing bank (via the processor) and forgoing the interest earned on unspent value.
However, building on the success of the Anywhere and Online cards, in early January 2017 Park announced it had become a licensed issuer of Mastercard products, having met the stringent processing and security standards required. This enables to it to issue Mastercard prepaid cards directly, giving it full responsibility for the end-to-end settlement with Mastercard. There is no longer need for the issuing bank and Park will continue to review the option of investing in the flexecash processing engine so as to eliminate the need for third-party processing. The direct relationship with Mastercard provides greater control over the issuing process, allowing improved flexibility and speed in adapting to customer requirements.
The first product being offered is a digital prepaid card, issued to customers for online redemption at a select number of retailers, including John Lewis, Argos and Debenhams. Later this year the offering will be expanded to include a physical card that customers will be able to use at any retailer accepting Mastercard, both online and in-store.
We see the Mastercard arrangement as providing Park with new ways to service its customers with the potential to open up new products and new markets. Competition with existing products should be limited by the need to charge a fee for the cards to access the retailers that are not part of Park’s network of partner retailers from which it receives service fees. Although it is relatively early days, it seems likely that the Mastercard product will generate similar margins to the existing flexecash product, despite transactions and processing fees and faster settlement of Mastercard transactions (lower cash balances on which to earn interest income) will generate slightly lower margins than currently earned by Park. The key determinant of profitability will be the size of premium that customers will be prepared to pay for the added convenience and reach of the product.
Divisional overview
As discussed above, the Consumer and Corporate divisions are best seen as distribution channels for a substantially common product set. They nevertheless address different customer groups, operating in different market conditions, in unique ways and it is worth reviewing each in turn.
Consumer division
The Consumer division generated 55% of FY16 billings and 53% of operating profits before central costs. Around 97% of the division is represented by the Christmas prepayments business; Park is the UK market leader and operates under the Park, Family and Country brands and in Ireland under the Park Ireland brand. Christmas prepayments customers mainly purchase a range of gift vouchers and cards but also gift products and hampers (c 3% of sales), typically on a 45-week prepaid instalment plan, which offers them a way to budget for Christmas and a relatively convenient way of shopping. In our view, it is the savings discipline and convenience of shopping that are the key attractions to customers.
The investments in e-commerce described above have fundamentally changed the way customers interact with Park and continue to shape the way Park serves them. Park has traditionally dealt with customers via agents, recruited using TV, press advertising, direct mail campaigns and word of mouth, but increasingly (c 50%) customers now choose to deal direct with Park using e-commerce (tablets and smart phones) to place orders direct. Park supports this through social media networks such as Facebook, Twitter and LinkedIn, using these to promote products, post promotional competitions, and seek ‘friend’ referrals. It has found the site a useful early indicator of customer issues and concerns, allowing it to plan a timely response. Park plans to launch a Christmas savings smart device app in the near future.
As well as dealing directly with Park, around one-third of accounts are now paid using direct debit which reduces administration costs and results in high levels of retention (c 90%).
Pre-paid card sales within the Consumer division have grown at an average of c 30% pa over the past three years to reach c 20% of the total supported by ongoing product innovation such the Mastercard supported Anywhere card and the Combi card. The Combi card has allowed Park to meet the interests of customers with access to the major supermarkets and other retailers, which would otherwise be impossible to include within Park’s mainstream retailer portfolio. The Combi card provides customers with two cards: the main Love2shop card and another for a major retailer, a list that now includes Asda, Morrisons, Tesco, Sainsbury’s, Primark and Amazon.
Exhibit 5: Consumer division financial summary
Year to end March (£000's) |
2014 |
2015 |
2016 |
2017e |
2018e |
H116 |
H117 |
|
Christmas savings |
177,800 |
192,900 |
205,400 |
215,947 |
229,076 |
24,500 |
28,800 |
|
% change |
-2.7% |
8.5% |
6.5% |
5.1% |
6.1% |
17.6% |
||
Other consumer |
3,732 |
3,896 |
6,122 |
6,428 |
6,750 |
2,253 |
764 |
|
% change |
11.0% |
4.4% |
57.1% |
5.0% |
5.0% |
-66.1% |
||
Total billings |
181,532 |
196,796 |
211,522 |
222,375 |
235,826 |
26,753 |
29,564 |
|
% change |
-9.0% |
8.4% |
7.5% |
5.1% |
6.0% |
10.5% |
||
Total revenues |
161,356 |
164,682 |
173,045 |
178,231 |
180,646 |
22,379 |
24,042 |
|
Operating expenses |
(156,004) |
(158,749) |
(166,222) |
(171,102) |
(173,149) |
(24,273) |
(25,391) |
|
% change |
-12.3% |
1.8% |
4.7% |
2.9% |
1.2% |
4.6% |
||
Operating profit |
5,352 |
5,933 |
6,823 |
7,129 |
7,497 |
(1,894) |
(1,349) |
|
Operating profit/billings |
2.9% |
3.0% |
3.2% |
3.2% |
3.2% |
-7.1% |
-4.6% |
|
Operating profit/revenues |
3.3% |
3.6% |
3.9% |
4.0% |
4.2% |
-8.5% |
-5.6% |
Source: Park group, Edison Investment Research
The Consumer division has grown steadily since the fallout from the 2007 failure of Farepak in FY08, with the exception of FY14, despite pressures on consumer incomes in Park’s market demographic. For FY14 the key marketing period was negatively affected by a weak economic outlook in early 2013, uncertainty over state benefits, and a number of well-known high street retail brands (including HMV) entering administration. The H117 growth in billings of 10.5% reflects the early despatch of Christmas savings orders (billings up 17.6%). The Christmas savings order book growth of 4% (for Christmas 2016), known for several months now, will be the main driver of billings growth for the year (FY17). Attention has already turned to FY18 (Christmas 2017) where management has indicated the order book was well ahead of the same early stage last year.
Corporate division
The corporate division accounted for 45% of FY16 billings and 47% of operating profits before central costs. Including business directly transacted with Park’s online card and voucher retailer highstreetvouchers.com, the division reaches more than 28,000 corporate customers whose requirements include employee benefits, performance recognition awards, motivation programmes and customer loyalty rewards. Management has identified a lack of low-cost incentive and rewards schemes for smaller employers (which it defines at up to 350 employees) within the market, and a majority of Park’s customers fall into this bracket. It provides packages, based around own-brand vouchers and cards, e-codes, travel services, and third-party retailer vouchers, designed to be flexible in content and that can be set up and administered online. The package includes a number of product options that allow customers to develop schemes tailor-made to meet their individual requirements. Unlike many competitors, fees are not the main income source, with Park using the scale and buying power of its voucher and card operations, and earnings on its working cash balances. The acquisition of FMI referred to above, though small, provides the potential to expand the incentive and rewards consultancy and advice component of the division.
Exhibit 6: Corporate division financial summary
Year to end March (£000's) |
2014 |
2015 |
2016 |
2017e |
2018e |
H1FY16 |
H1FY17 |
|
Incentive |
87,300 |
107,600 |
113,200 |
121,124 |
133,236 |
45,000 |
46,700 |
|
% change |
0.5% |
23.3% |
5.2% |
7.0% |
10.0% |
3.8% |
||
Credit |
28,700 |
20,400 |
3,900 |
3,705 |
3,705 |
1,300 |
1,200 |
|
% change |
-45.5% |
-28.9% |
-80.9% |
-5.0% |
0.0% |
-7.7% |
||
hsv.com |
16,900 |
20,800 |
21,700 |
23,002 |
25,302 |
10,100 |
10,500 |
|
% change |
26.3% |
23.1% |
4.3% |
6.0% |
10.0% |
4.0% |
||
Other corporate |
2,400 |
3,900 |
3,300 |
1,815 |
1,997 |
1,842 |
3,509 |
|
% change |
0.0% |
62.5% |
-15.4% |
-45.0% |
10.0% |
90.5% |
||
Total billings |
154,508 |
176,091 |
173,509 |
186,315 |
204,576 |
66,042 |
68,709 |
|
% change |
1.3% |
14.0% |
-1.5% |
7.4% |
9.8% |
4.0% |
||
Revenue (£'000s) |
108,207 |
128,647 |
129,500 |
132,339 |
142,503 |
49,704 |
48,404 |
|
% change |
13.3% |
18.9% |
0.7% |
2.2% |
7.7% |
-2.6% |
||
Operating expenses (£'000s) |
(103,333) |
(122,182) |
(123,487) |
(125,788) |
(135,307) |
(48,548) |
(47,309) |
|
% change |
14.2% |
18.2% |
1.1% |
1.9% |
7.6% |
-2.6% |
||
Operating profit (£'000s) |
4,874 |
6,465 |
6,013 |
6,551 |
7,196 |
1,156 |
1,095 |
|
Operating profit/billings |
3.2% |
3.7% |
3.5% |
3.5% |
3.5% |
1.8% |
1.6% |
|
Operating profit/revenues |
4.5% |
5.0% |
4.6% |
5.0% |
5.1% |
2.3% |
2.3% |
Source: Park Group, Edison Investment Research
Investment in e-commerce has greatly enhanced Park’s ability to cost effectively tailor its products and services to the specific needs of customers. During 2016 Park completed the development of and launched Engage, a new, modular, digital platform for the corporate incentive and reward market. The online management portal allows corporate users to create and control web or smart device-based programmes for their customers or staff, providing real-time information to the customer on uptake and progress. Management is also pleased with the early progress of another new development, Evolve, which was launched in June 2016. It is again online and live, branded platform providing instant ‘gratification’ to staff and customers by delivering a broad range of digital e-codes in a convenient and cost effective way. With the interim results, Park disclosed that in the first its four months 65 customers had used the new system, generating £2m in confirmed sales in the H2 order book and a significant pipeline opportunity of more than £10m at the time of the report. Park has already seen demand for Evolve from UK based clients with Europe-based customers and anticipates that it will be a useful feature in broadening its geographic reach.
Highstreetvouchers.com is a leading UK supplier of Park own-branded and third-party gift vouchers and cards. Until FY13 it sat within the Consumer division but given its growing popularity with business and corporate customers it was transferred.
The Corporate division has a good track record of growth over recent years, despite periods of economic pressure on its predominantly SME customer base. However, in FY16 billings and operating earnings showed a slight decline as a result of the sharp contraction in sales to home collected credit (HCC) operators (from £20.4m to £3.9m), continuing a decline from peak sales of £52.7m in FY13. Over this period HCC customers changed their behaviour, in part focusing more on collections rather than customer acquisition and reducing their requirement for Park’s product set. Excluding credit, Corporate billings advanced by 9% in FY16. Credit billings are now so small that there is little room for material impact, and there is also a possibility that some of the lost billings may return.
H117 billings growth was relatively sluggish at 4%. In part this reflects quite a strong H116 when H1 billings were 38% of the annual total compared with an average 31% in the previous four years. Management is positive about the order pipeline and expects growth to pick up in H2. We look for billings growth to return to c 10% in FY18 which we note is lower than the 15% CAGR in billings (excluding credit) in the five years to FY16.
Management and governance
The executive board includes the CEO, group finance director and the managing director of Park Retail. Each has been in their current positions since 2004, together managing Park through its transformation and development. CEO Chris Houghton joined the group in 1986 and has been on the board since 2000, becoming financial director in 2001, group managing director in 2004, and CEO in 2012. The non-executive chairman is Laura Carstensen, who was elected to the board in September 2013 and became chairman in June 2016 upon the retirement of the group founder Peter Johnson. She is a former partner in City law firm Slaughter and May and a former member and deputy chairman of the UK Competition Commission (now the Competition and Markets Authority). The other two non-executive directors are Michael de Kare-Silver, who joined the board in September 2013, and John Gittins, who joined the board in September 2016 and has more than 20 years’ experience as a CFO across a number of sectors and territories. Mr de Kare-Silver recently became senior independent director, replacing John Dembitz when he retired from the board. Brief biographies of the executive board members and chairman are on page 17.
Before his retirement, in December 2015 Peter Johnson disposed of his remaining 27.3% interest in Park in a placing at 65p per share. Park shares are now widely held, with strong institutional ownership (see page 12) and a free float of 98.2%.
Financials
Seasonality and brief comment on the interims
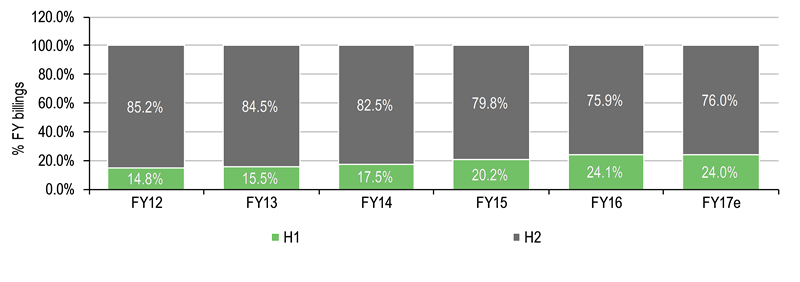
Park’s business is highly seasonal with the majority of its revenues and profits focused on the H2 Christmas period, and the first half of the year traditionally loss making. Continued investment in digital sales, distribution and products has seen the share of total annual sales (defined as billings), generated in H1 increase, from less than 15% in FY12 to 24% (our expectation in FY17), and the H1 pre-tax loss has correspondingly declined from £4.4m to £0.8m over the same period.
|
Exhibit 7: The seasonality of sales* |
|
|
Source: Park Group, Edison Investment Research. *Note: Sales defined as billings. |
Results for the first half of the current year were published in December 2016 and, in our view, are best looked at as a guide to underlying business trends and direction. The key points were:
■
Billings were 5.9% ahead of the prior year, up 4% in Corporate and 10.5% in Consumer. The growth in Consumer in part reflected a further acceleration in the shipment of Christmas orders (which were up c 4%). The order pipeline in the Corporate division indicates a stronger performance in H2.
■
With the Christmas Savings order book for Christmas 2016 (FY17) effectively known at the reporting date, the early indications from the marketing campaign for Christmas 2017 (FY18), which began in September 2016, were said by management to be ‘encouraging’.
■
Further evidence of the progress of the business, cash balances (included customer funds held in trust) peaked at a record £217m (FY16: £206m). Interest earnings increased 7.7% to £825k.
■
The seasonal pre-tax loss reduced to £760k from £1,404k.
■
The interim dividend was increased by 11.8% to 0.95p per share
We expect continued earnings growth
As discussed above, we have trimmed our forecast for corporate billings in FY17 and are now looking for just over 6% growth in group billings for the year. We expect cards to continue to take a larger share of billings (up c 25% in H117 to c 28% of the total) so, due to the accounting treatment of cards (see below), revenue growth will be lower at a little more than 2%. For FY18 we are assuming growth in billings and revenues of 8% and 4%, respectively. Gross margin on billings is assumed to be stable over the period (7.4% based on billings but increasing as a percentage of revenues due to card accounting). Our forecasts show operating profit increasing in line with billings (a margin of 2.7% whereas we previously forecast an increase to 2.8%). For the current year, total cash balances (including customer balances held in trust) peaked ahead of the Christmas trading period at £217m compared with £204m in FY16, and we expect further growth in FY18 as a result of the projected billings increase. As indicated above, interest income on the growing cash balances was up by 7.7% in H1, but the key bank base rate was cut from 0.5% to 0.25% in the wake of the EU referendum vote. This cut will continue to work its way through Park’s deposit book (spread among a number of UK regulated banks with an average maturity of less than 12 months) during H217 and into FY18, but we have assumed the base rate returns to 0.5% by September 2018 (a c £200k benefit to FY18 earnings). On this basis, there is a small, volume-driven increase in interest income in FY18. Overall, we expect statutory PBT to increase by c 6% to £12.6m in FY17, and by c 7% to £13.4m in FY18.
Strong underlying cash flow increasingly apparent
Park is highly cash generative and for many years its growing business has been funded by working capital with the balance sheet reporting negative equity, although capturing none of the goodwill value inherent in the business. The business model is based on cash being received upfront from our customer then that cash being paid, less Park’s margin, to the redeemers who accept the vouchers and prepaid cards at their outlets.
The net equity position turned positive in FY16 (£6.4m) for the first time in several years, after earlier unsuccessful attempts to diversify the original Christmas savings business had generated trading and disposal losses, leading to a negative equity position. The current executive team completed the exit of these struggling businesses in 2006 and set about delivering substantial growth in the refocused business through product and distribution development and innovation. This was an extremely helpful course of action in the light of the Farepak failure later that year and the subsequent move to segregate customer cash balances.
The Christmas Prepayment trust, a voluntary initiative to provide reassurance to customers by segregating unused customer balances, was established for the FY08 trading year. The trust deed allowed Park, under the supervision of the trustees, to access some of the accumulated balances on a limited basis to meet operating costs and working capital needs within the business period. However, to provide increasing protection to customers, the use of this facility has declined steadily over the past few years and management reports that in FY16 Park made no use of it. The flexecash prepaid card customer balances are fully segregated as required by the regulator (the FCA).
Exhibit 8: Summary balance sheet development
£m |
2007 |
2008 |
2009 |
2010 |
2011 |
2012 |
2013 |
2014 |
2015 |
2016 |
2017e |
2018e |
Trade payables |
(36.3) |
(40.6) |
(40.2) |
(42.8) |
(47.7) |
(55.8) |
(51.9) |
(58.3) |
(52.0) |
(56.0) |
(59.3) |
(63.9) |
Money held in trust |
0.0 |
17.3 |
16.5 |
21.5 |
39.6 |
46.9 |
48.3 |
57.5 |
65.7 |
75.2 |
79.4 |
85.3 |
Stocks |
0.4 |
1.0 |
0.7 |
0.9 |
1.3 |
1.9 |
1.4 |
1.6 |
3.2 |
2.2 |
2.0 |
2.2 |
Trade payables less money held in trust and stocks |
(35.9) |
(22.2) |
(23.0) |
(20.5) |
(6.8) |
(7.0) |
(2.1) |
0.8 |
16.9 |
21.4 |
22.1 |
23.6 |
Provisions |
(22.1) |
(23.7) |
(23.6) |
(30.2) |
(34.1) |
(33.0) |
(36.8) |
(37.2) |
(43.2) |
(44.8) |
(47.2) |
(49.5) |
Cash (net of overdraft) |
12.2 |
5.4 |
12.2 |
15.5 |
6.8 |
7.1 |
10.8 |
14.8 |
23.2 |
28.8 |
36.1 |
43.5 |
Other current assets/(liabilities) |
4.7 |
3.0 |
(0.9) |
0.1 |
0.1 |
3.5 |
2.8 |
5.3 |
(8.2) |
(10.8) |
(10.7) |
(11.6) |
Net current assets/(liabilities) |
(41.1) |
(37.5) |
(35.3) |
(35.1) |
(33.9) |
(29.4) |
(25.4) |
(16.4) |
(11.2) |
(5.4) |
0.4 |
6.1 |
Non-current assets |
9.8 |
8.4 |
7.8 |
9.5 |
16.6 |
15.6 |
14.4 |
13.7 |
13.9 |
13.7 |
13.1 |
13.0 |
Non-current liabilities |
(2.2) |
(2.6) |
(1.1) |
(3.8) |
(2.1) |
(1.9) |
(0.4) |
(1.5) |
(2.9) |
(1.9) |
(1.4) |
(0.7) |
Net assets (inc minorities) |
(33.5) |
(31.7) |
(28.6) |
(29.4) |
(19.5) |
(15.7) |
(11.3) |
(4.1) |
(0.2) |
6.4 |
12.1 |
18.4 |
Source: Park Group, Edison Investment Research
Exhibit 8 shows how the business has progressively moved from being fully funded by working capital with a negative equity position to positive equity (retained earnings plus a £4.2m net of expenses equity placing in FY14 to fund growth) and just a small current net liability by the end of FY16. The placing provided capital to fund investment in new products and to evaluate the potential of Europe as a new market. At the time of the placing, bank borrowing was not available given the negative net asset position.
Additionally, Exhibit 8 shows how money held in trust (first established in 2008) have steadily increased relative to trade payables (the money owing to customers), reaching a small negative balance of £21.4m in FY16 (including a small amount of stocks). Our forecasts assume this will level off and grow more in line with billings as both card and voucher customer balances are now fully covered by segregated funds held in trust.
In addition to the growing balance of segregated cash, the group (or shareholder) cash balance has also increased. We note that over short periods, the timing of cash transfers between the segregated and group cash balances can be variable and management does not move cash if interest income would suffer as a result (eg by giving up an attractive term deposit). That said, the main purpose of the group cash balance (£28.8m at FY16) is to settle the provision for outstanding vouchers that have been issued to customers but are yet to be redeemed at retailer outlets. There is also a smaller provision for corporately issued (rather than individually issued) cards where there is no right of redemption for unspent balances (see below). The cash balance backing the card and voucher provision liability is thus not strictly speaking available for distribution to shareholders as it is expected to be paid out sometime in the future.
Historically, Park’s operational cash flow has been allocated between strengthening the balance sheet, investment in growing the business (partly capitalised but also expensed) and dividend payments to shareholders. In Exhibit 9 we show operating cash flow adjusted for the impact of the movement in provisions, which as we argue above is a timing issue with no long-term impact on the ‘free cash flow’ that we estimate including interest earnings on the largely customer cash balances and after capex and tax. We have also made adjustment for non-recurring disposal proceeds.
Exhibit 9: Summary cash flow and cash conversion
£m |
2007 |
2008 |
2009 |
2010 |
2011 |
2012 |
2013 |
2014 |
2015 |
2016 |
2017e |
2018e |
Operating cash flow |
(6.7) |
(6.9) |
7.0 |
8.8 |
(0.5) |
4.7 |
7.5 |
4.1 |
14.1 |
12.2 |
14.6 |
15.0 |
Adjust for movement in provisions |
2.7 |
1.6 |
(0.1) |
6.6 |
5.3 |
(1.0) |
(0.1) |
0.4 |
6.0 |
1.6 |
2.4 |
2.3 |
Operating cash flow adjusted for movement in provisions |
(9.5) |
(8.6) |
7.1 |
2.2 |
(5.8) |
5.7 |
7.7 |
3.7 |
8.2 |
10.6 |
12.2 |
12.7 |
Interest |
3.3 |
2.6 |
3.1 |
0.9 |
1.0 |
1.7 |
1.8 |
1.9 |
1.2 |
1.3 |
1.3 |
1.6 |
Tax |
(0.2) |
(0.1) |
(0.1) |
(1.2) |
(1.3) |
(1.8) |
(2.0) |
(2.1) |
(2.1) |
(2.5) |
(3.7) |
(2.7) |
Disposal proceeds and other |
8.6 |
0.1 |
0.0 |
0.0 |
0.0 |
0.6 |
1.2 |
0.1 |
0.0 |
0.1 |
0.0 |
0.0 |
Maintenance capex |
(0.8) |
(0.5) |
(1.3) |
(2.4) |
(7.0) |
(1.5) |
(1.4) |
(1.0) |
(0.6) |
(1.1) |
(0.7) |
(1.2) |
Free cash flow excluding movement in voucher provision |
1.4 |
(6.4) |
8.9 |
(0.4) |
(13.2) |
4.8 |
7.2 |
2.6 |
6.6 |
8.4 |
9.0 |
10.4 |
Net profit |
7.2 |
3.8 |
4.1 |
3.7 |
5.3 |
6.9 |
8.0 |
7.9 |
8.9 |
10.3 |
10.6 |
11.5 |
Free cash flow as % net profit |
20% |
-169% |
214% |
-11% |
-246% |
69% |
90% |
34% |
74% |
82% |
85% |
90% |
Source: Park Group, Edison Investment Research
During the five years up to and including FY11, free cash flow averaged a negative 38% of net profit; Park was using the cash generated by operations including the ‘temporary’ cash generated by increasing provisions balances to strengthen the cash position of the voucher trust. Having done so, the free cash generation has become increasingly apparent in subsequent years, averaging a positive 70% conversion of net profit in the years up to FY16. For the reasons outlined above, we anticipate continued strong cash conversion. Park has distributed a fairly consistent c 50% of basic EPS in earnings over the past 10 years. We note that the dividend policy was changed in FY15 to better balance the pay-out between H1 and H2 in recognition of the increase in balance sheet strength, management confidence in the business and the trend to a smaller H1 seasonal loss. We would expect future dividend policy to take account of the prospects for organic investment and/or external acquisition opportunities.
Accounting for cards versus vouchers and IFRS 15 note
The accounting treatment for recognising revenues from prepaid cards is very different to that for vouchers, although ongoing discussions surrounding the proposed IFRS 15 suggest that convergence of voucher revenue with that for cards is likely. Voucher revenue is generally recorded when the vouchers have been despatched to the customer, generating a gross profit margin that represents the service fees receivable from the retailers/redemption partners at the same time, and with a provision made for the redemption liability arising. For cards, the revenue is the fees charged to cardholders and service fees receivable from retailers/redemption partners. Where the cardholder has the right of redemption, revenue is recognised when amounts are deducted from values held on cards, ie when cards are redeemed at retailers/redemption partners or when charges are levied. Where there is no right of redemption for cash (as is the case with some corporately issued cards), the accounting treatment is very similar to that for vouchers except that revenue and profit are recognised when the voucher is spent rather than when it is issued.
Card billings generate much lower reported revenues, but are recorded as 100% gross profit margin, with some delay in profit recognition.
Exhibit 10: Accounting treatment of vouchers versus prepaid cards (illustration)
£ |
Voucher |
Prepaid card |
Billings |
100 |
100 |
Revenue |
100 |
7 |
Cost of sales |
(93) |
0 |
Gross profit |
7 |
7 |
Gross margin on revenue |
7% |
100% |
Source: Park Group, Edison Investment Research
To provide greater clarity, the group reports the (non-statutory accounting) measure of billings. It represents the face value of voucher sales and the amount of value loaded on to prepaid cards, net of any discounts given to customers. Exhibit 10 shows how £100 of billings generates very different accounting revenues depending on whether it is a voucher or prepaid card, although assuming all card balances are spent in the same accounting period as the voucher sale, the gross profit contribution is the same. However, in reality, it is unlikely that all card balances will be spent in the accounting period, deferring gross profit (and a similar amount of revenue). As card balances grow, so too does the deferral. Accumulated, unspent customer card balances are held on balance sheet within the segregated e-Money Trust, a regulatory requirement. The balance as at FY16 was £19.1m, which we estimate represents c £1.5m of deferred gross profit (and revenue) that will be reported in future accounting periods.
The implementation of IFRS 15 changes to revenue recognition is yet to be fully decided and introduction is set for years ending after 1 January 2018. It is possible that sales of third-party vouchers may continue to be recognised on the existing gross basis. It is also possible that the timing of revenue and profit recognition may switch from voucher despatch to the point at which the retailer/redemption partner is paid. To the extent that accounting for vouchers converges on the accounting currently applied to cards:
■
Revenues recorded for vouchers are likely to show a material decline.
■
Ultimate gross profit and cash flow will be unaffected but the reported gross margin will increase materially to 100%.
■
Any revenue and profit recognition deferral may slightly reduce the reported numbers in period one and the deferral of previously recognised profits may reduce equity.
It is important to note that any accounting changes will have no impact on the quantum or timing of cash flows to the group, although the changes to the timing of revenue recognition may have a similar impact on split between customer and shareholder cash balances. Our forecasts have been made on the existing basis of accounting.
Valuation
There are no directly comparable quoted peers to Park, which makes it difficult to draw conclusions about relative value in a sector context. Most competitor employee benefits and service providers are private companies or relatively small parts of larger groups. Sodexo and Edenred are both much larger and more international than Park, and the overlap with Sodexho is limited; Sodexho Benefits and Rewards Services is a minor part of Sodexo Group. Because Park’s traditional Christmas prepayments customer base (c 50% of Park) has some socioeconomic overlap with that of the home-collected credit lenders, we also show valuation data for these. We would expect a premium rating for Park as it does not have similar credit risk, and we believe it has less regulatory risk. On this basis, a premium to the HCC companies but a discount to the larger incentive-related peers, our judgement is that at least 15x prospective earnings (86p per share) is a fair objective. This is supported by a DCF valuation of 90p per share discussed below.
Exhibit 11: Peer valuation comparison
|
Price (p) |
Mkt cap (£bn) |
P/E current year (x) |
P/E next year (x) |
Dividend yield (%) |
Incentive |
|||||
Park Group |
80.4 |
0.1 |
15.0 |
14.0 |
3.6% |
Edenred |
20.8 |
4.1 |
22.9 |
20.3 |
4.0% |
Sodexo |
102.0 |
13.4 |
20.0 |
18.2 |
2.4% |
Average |
19.3 |
17.5 |
3.3% |
||
Home collected credit |
|||||
Provident Financial |
2732.0 |
4.0 |
15.8 |
14.7 |
4.5% |
Morses Club |
119.5 |
0.2 |
11.2 |
10.4 |
1.8% |
Non-Standard Finance |
60.3 |
0.2 |
15.4 |
10.4 |
0.5% |
Average |
14.1 |
11.8 |
2.3% |
||
FTSE All-Share index |
3918 |
14.8 |
13.6 |
3.7% |
Source: Edison Investment Research, Bloomberg. Note: Consensus estimates for all except Park. Prices at 9 February 2017.
Discounted cash flow
Our DCF valuation is 90p per share. In our calculation we make a full deduction for the voucher provision balance (£36m or 20p per share) and the cash expected to eventually flow out in settlement of vouchers that have been issued and accounted for in earnings but not yet redeemed. This may be viewed as conservative as Park has had use of this fluctuating source of cash over a number of years, which is likely to continue for some time (with the size of the balance effectively tracking voucher sales). Additionally, we use a modified form of the usual DCF formula (which would exclude interest earnings) to include interest earned on segregated customer cash balances (but not on the group cash balance), as this is an integral part of the returns generated by Park. The customer cash itself is excluded from the overall valuation. Beyond the forecast period up to and including FY18, we grow free cash flow at 5% until year 10, enhanced by an assumed normalisation of interest rates during FY18 (to 1.5%) and FY19 (to 3.0%), valued the terminal cash flow at 10x, and discounted by 10%. The terminal value represents 47% of the total. A 1% increase in the assumed discount rate, a reduction in the terminal multiple to 11x, or a 1% reduction in the long-term growth rate reduces the value by c 7%, 5%, or 5% respectively. We note that the current share price could be said to be assuming a long-term growth in free cash flow of c 6%.
Sensitivities
As discussed in the Financials section, our forecasts are based on current accounting standards and do not allow for the potential impacts of IFRS 15. We note the following fundamental sensitivities to the performance of the business and our forecasts:
■
The impact of interest rates on cash balances. During the year, the group accumulates substantial cash balances within the Christmas savings business, peaking around November/December. Park earns interest on these balances, accounting for 12% of FY16 reported PBT (and more than 30% in FY07 before the financial crisis and interest rate decline). We note that if Park had been able to earn an additional 50bp for a full year, the FY16 PBT would have increased by c 6%.
■
General economic growth. In our view, Christmas savings is a relatively economically insensitive business, providing support and discipline to Christmas planning in difficult times. It is not fully immune, and saw billings decline by 2.7% in FY14 when prominent retailer failure and social security benefit uncertainty coincided with the peak marketing period. The corporate business depends on the health of the SME sector although staff incentivisation can display counter-cyclical qualities. Excluding HCC sales, FY16 continued the trend of multi-year billings growth through an often challenging economic environment, which we believe is a result of constant investment in the service and product offering, and the opportunity for market share gain in a substantial market.
■
Brand perception and customer confidence, especially in the Christmas savings operation. The group’s Christmas savings business is wholly dependent on the confidence of its customers and their willingness to make prepayments. Since the high-profile collapse of Farepak in 2007 the industry has moved to voluntary segregated customer balances, which should support customer confidence. As a regulated financial services product, card prepayments are 100% segregated by law.
■
Business continuity and IT systems. The group is becoming increasingly reliant on digital sales and distribution, particularly relating to prepaid e-money card transactions. Any significant loss of transaction capability or breach of security could have a serious impact on group performance and customer confidence.
Regulation. As an FCA regulated e-money issuer the group would be affected by any changes in regulation of its prepaid card products. Christmas prepayment practices are covered by voluntary industry agreements but any enforced changes in selling practices or customer protection could affect the group.
Exhibit 12: Financial summary
Year end 31 March |
£'000s |
2014 |
2015 |
2016 |
2017e |
2018e |
|
PROFIT & LOSS |
IFRS |
IFRS |
IFRS |
IFRS |
IFRS |
||
Billings* |
336,040 |
372,887 |
385,031 |
408,690 |
440,402 |
||
Revenue |
|
|
269,563 |
293,329 |
302,545 |
310,569 |
323,149 |
Cost of sales |
(245,928) |
(265,966) |
(274,060) |
(280,469) |
(290,705) |
||
Gross margin |
23,635 |
27,363 |
28,485 |
30,100 |
32,444 |
||
Distribution costs |
(2,521) |
(2,761) |
(2,909) |
(2,919) |
(3,070) |
||
Administrative expenses |
(11,421) |
(13,057) |
(13,150) |
(14,070) |
(15,338) |
||
EBITDA |
|
|
9,693 |
11,545 |
12,426 |
13,112 |
14,036 |
Depreciation & amortisation |
(1,260) |
(1,308) |
(1,309) |
(1,312) |
(1,237) |
||
Amortisation of acquired intangible, goodwill impairment, & impairment of investment property |
(390) |
(314) |
(86) |
(70) |
(70) |
||
Share-based payments |
(215) |
(235) |
(631) |
(888) |
(890) |
||
Exceptional operating income |
0 |
0 |
0 |
0 |
0 |
||
Operating profit |
7,828 |
9,688 |
10,400 |
10,841 |
11,839 |
||
Operating Profit (before amort. and except.) |
|
8,433 |
10,237 |
11,117 |
11,799 |
12,799 |
|
Net Interest |
1,576 |
1,245 |
1,457 |
1,510 |
1,600 |
||
Profit Before Tax (norm) |
|
|
10,009 |
11,482 |
12,574 |
13,309 |
14,399 |
Profit before tax (IFRS) |
|
|
9,404 |
10,933 |
11,857 |
12,351 |
13,439 |
Tax |
(2,124) |
(2,434) |
(2,169) |
(2,470) |
(2,688) |
||
Profit after tax (norm) |
|
|
7,877 |
8,926 |
10,274 |
10,647 |
11,519 |
Profit after tax (IFRS) |
|
|
7,280 |
8,499 |
9,688 |
9,881 |
10,751 |
Discontinued operations |
0 |
0 |
0 |
0 |
0 |
||
Profit after tax (IFRS) |
|
|
7,280 |
8,499 |
9,688 |
9,881 |
10,751 |
Average Number of Shares Outstanding (m) |
178.8 |
184.7 |
187.2 |
183.7 |
183.7 |
||
Basic EPS - IFRS (p) |
|
|
4.16 |
4.66 |
5.28 |
5.38 |
5.85 |
Fully diluted EPS - IFRS (p) |
|
|
4.14 |
4.60 |
5.18 |
5.35 |
5.74 |
EPS - normalised fully diluted (p) |
|
|
4.33 |
4.83 |
5.49 |
5.76 |
6.15 |
Dividend per share (p) |
2.30 |
2.40 |
2.75 |
2.90 |
3.05 |
||
Gross margin on billings (%) |
7.0 |
7.3 |
7.4 |
7.4 |
7.4 |
||
EBITDA margin as % of billings |
2.9 |
3.1 |
3.2 |
3.2 |
3.2 |
||
Operating margin (before GW and except) as % billings |
2.5 |
2.7 |
2.9 |
2.9 |
2.9 |
||
BALANCE SHEET |
|||||||
Fixed assets |
|
|
13,744 |
13,932 |
13,749 |
13,087 |
13,007 |
Intangible assets |
5,110 |
4,488 |
4,356 |
3,977 |
3,910 |
||
Tangible assets |
8,626 |
8,143 |
8,003 |
7,743 |
7,731 |
||
Retirement benefit obligation |
0 |
1,293 |
1,390 |
1,367 |
1,367 |
||
Other |
8 |
8 |
0 |
0 |
0 |
||
Current assets |
|
|
84,484 |
106,998 |
119,365 |
127,362 |
141,561 |
Debtors |
12,128 |
14,937 |
11,411 |
11,813 |
12,710 |
||
Cash held in trust |
57,514 |
65,728 |
75,219 |
79,449 |
85,345 |
||
Cash available to group |
14,842 |
26,333 |
32,735 |
36,100 |
43,506 |
||
Current liabilities |
|
|
(100,848) |
(118,190) |
(124,808) |
(126,985) |
(135,491) |
Creditors |
(63,614) |
(75,004) |
(80,041) |
(79,834) |
(86,029) |
||
Provisions |
(37,234) |
(43,186) |
(44,767) |
(47,151) |
(49,462) |
||
Short-term borrowings |
0 |
0 |
0 |
0 |
0 |
||
Long-term liabilities |
|
|
(1,515) |
(2,907) |
(1,881) |
(1,362) |
(663) |
Long-term borrowings |
0 |
0 |
0 |
0 |
0 |
||
Deferred tax |
(294) |
(273) |
(181) |
(181) |
(181) |
||
Retirement benefit obligation |
(1,221) |
(2,634) |
(1,700) |
(1,181) |
(482) |
||
Net assets |
|
|
(4,135) |
(167) |
6,425 |
12,101 |
18,414 |
Minorities |
311 |
0 |
0 |
0 |
0 |
||
Shareholders' equity |
|
|
(3,824) |
(167) |
6,425 |
12,101 |
18,414 |
CASH FLOW |
|||||||
Operating Cash Flow |
4,094 |
14,106 |
12,184 |
14,583 |
15,050 |
||
Net interest |
1,948 |
1,176 |
1,339 |
1,310 |
1,600 |
||
Tax |
(2,079) |
(2,132) |
(2,490) |
(3,741) |
(2,688) |
||
Capex |
(977) |
(597) |
(1,126) |
(743) |
(1,228) |
||
Acquisitions/disposals |
52 |
41 |
52 |
0 |
0 |
||
Financing |
4,700 |
0 |
0 |
0 |
0 |
||
Dividends |
(3,704) |
(4,198) |
(4,380) |
(4,123) |
(5,327) |
||
Other |
(1) |
0 |
(4) |
0 |
0 |
||
Net cash flow |
4,033 |
8,396 |
5,575 |
7,286 |
7,406 |
||
Opening net (debt)/cash |
10,810 |
14,843 |
23,239 |
28,814 |
36,100 |
||
Closing net (debt)/cash |
|
|
14,843 |
23,239 |
28,814 |
36,100 |
43,506 |
Source: Park Group, Edison Investment Research. *Note: billings is a non-statutory measure of sales defined as the face value of voucher sales and the amount of value loaded on to prepaid cards.
|
||||||||||||||||||||||||||||||||||||||
|
|