Last close As at 06/08/2026
GBP11.76
▲ −3.98 (−0.34%)
Market capitalisation
—
Research: Investment Companies
Ocean Wilsons Holdings
Written by
Ocean Wilsons Holdings |
An unusual proposition |
2015 results |
Investment companies |
9 June 2016 |
Share price performance
Business description
Next event
Analysts
Ocean Wilsons Holdings is a research client of Edison Investment Research Limited |
|||||||||||||||||||||||||||||||||||||||||||||||||
Ocean Wilsons Holdings (OCN) is an investment holding company that offers investors an unusual proposition: a controlling interest in a long-established Brazilian maritime services company (Wilson Sons) and a diversified investment portfolio, both run with a long-term view. While the trading background in Brazil is challenging, this is factored into market thinking and Wilson Sons has demonstrated resilience. An investor in OCN also gains the diversification provided by the global portfolio and a substantial discount cushion (35% based on a look-through NAV).
Year end |
Revenue (US$m) |
PBT* (US$m) |
EPS* (c) |
DPS (c) |
P/E (x) |
Yield (%) |
12/14 |
633.5 |
78.5 |
65.6 |
63 |
17.5 |
5.5 |
12/15 |
508.9 |
68.9 |
43.7 |
63 |
26.2 |
5.5 |
12/16e |
427.9 |
105.1 |
105.4 |
63 |
10.9 |
5.5 |
12/17e |
443.0 |
112.6 |
115.4 |
64 |
9.9 |
5.6 |
Note: *PBT and EPS exclude exceptional items.
Recent results: Currency and economic headwinds
OCN’s Wilson Sons subsidiary reported Q1 results in May, with the devaluation of the Brazilian real (-26.5% vs Q115) and the soft Brazilian economy holding back revenues and EBITDA (-26% and -25% respectively). The fact that nearly half of revenues are earned in dollars and costs are primarily in Brazilian reals mitigated the impact. At the net income level, a positive move in the Brazilian real in the first quarter gave rise to currency gains relating to monetary items, deferred taxes and loans and investments that resulted in a move from the $8.1m net loss recorded in Q115 to net income of $22.0m. The OCN investment portfolio generated a return of 1% during 2015, but the value reported for end April showed a decline of 1.9% from the year end following a turbulent period in equity markets.
Outlook: Hints of improvement in prospect
The operating environment for Wilson Sons is challenging, with the Brazilian economic and political background remaining troubled and oil prices still at relatively depressed levels. However, container port volumes are being boosted by stronger exports and in the oil-related businesses long-term contracts with Petrobras provide stability in a difficult environment. The diversity of the investment portfolio provides a measure of protection and the manager’s core expectation is that equity markets will make progress this year. The start of the process of impeachment of President Rousseff has given the equity market hope that the economy can achieve a more positive trajectory in time and OCN’s proven Brazilian business stands to benefit from the resolution of the country’s current problems.
Substantial discount to NAV and cheaper than peers
The 35% discount to look-through NAV appears to provide a significant cushion for adverse developments, either at the company or in Brazil, while looking at Wilson Sons compared with its international peer group (see page 11) suggests it is modestly valued in terms of P/E and EV/EBITDA multiples.
Investment summary
Company description: A long-term investor
OCN is a Bermudian investment holding company whose main assets are a controlling interest in Wilson Sons (WSON) and an international investment portfolio, both run with a long-term view. WSON is a public Brazilian port, maritime and logistics company. On a look-through basis, including Wilson Sons’ market value, the NAV split is 62:38 between WSON and the investment portfolio.
Valuation: Substantial discount provides cushion/opportunity
OCN is trading at a 35% discount to look-though NAV, with the market value of its holding in Wilson Sons only 4% below OCN’s own market capitalisation. Compared with a group of local and international peers, both P/E and EV/EBITDA valuations for Wilson Sons appear modest. More detail is given on pages 10 and 11.
Sensitivities: Brazil, international trade and oil
Wilson Sons reports in US dollars and earns around 48% of its revenues in that currency. As a Brazilian company, its costs are mostly in reals. Currency fluctuations therefore have a more limited effect on the company’s EBITDA. Accounting for foreign exchange movements can make the reported progression of earnings appear lumpy, although the underlying businesses have been relatively stable and EBITDA has grown at a compound rate of 7.9% between 2008 and 2015.
As a port operator and offshore services provider, trends in Brazilian trade volumes and oil industry activity are important drivers of Wilson Sons’ revenue and profits. Brazilian GDP is expected to contract in 2016, creating a weak backdrop although export volumes have increased, supporting port volumes. While the oil price has staged a rally this year, it is still trading at less than half the level seen in recent years and an early pick up in exploration activity at Petrobras appears unlikely. This is likely to affect the oil-exposed offshore support business (Wilson Sons UltraTug Offshore, WSUT and Brasco), although long-term contracts and prospects for exploitation of the pre-salt oil reserves are positive factors.
The Brazilian equity market has rallied strongly this year (+19%) on expectation of and then the beginning of the process of impeachment of President Dilma Rousseff. OCN lagged the Bovespa index initially (Exhibit 1) reflecting its qualified sensitivity to Brazilian developments. The impeachment process and implementation of structural changes by a new government are likely to take time with fluctuating sentiment as the process unfolds, but the prospect of an end to the previous unsatisfactory political situation is certainly positive. On a longer view, it seems likely that Ocean Wilsons would respond further to such news, potentially reducing the discount to NAV that it trades on and further reversing the recent underperformance versus Wilson Sons (Exhibit 2).
|
Exhibit 1: OCN relative to Bovespa and FTSE All-Share |
Exhibit 2: OCN relative to WSON |
|
|
|
Source: Datastream |
|
Exhibit 1: OCN relative to Bovespa and FTSE All-Share |
|
|
Source: Datastream |
|
Exhibit 2: OCN relative to WSON |
|
|
Source: Datastream |
Company description: Brazilian business, global portfolio
OCN is an investment company based in Bermuda with two main assets: a controlling interest in Wilson Sons, a quoted Brazilian maritime services company; and an international investment portfolio held in its Ocean Wilsons Investments (OWIL) subsidiary. OCN is managed with a long-term view, which has enabled WSON to complete a significant programme of capital investment, while the international portfolio is also managed with the objective of producing long-term capital growth.
OCN has a 58.25% holding in Wilson Sons, which was fully owned by OCN before its initial public offering in May 2007. Wilson Sons has a free float of 41.75%, including 14.5% owned by funds managed by Aberdeen Asset Management. The IPO was a means of creating a transparent valuation for Wilson Sons while the proceeds were invested, constituting the majority of the assets in OWIL’s international portfolio, which in turn provides diversification for holders of OCN. The structure of the business is illustrated in Exhibit 3.
|
Exhibit 3: Ocean Wilsons’ corporate structure |
|
|
Source: Ocean Wilsons |
Wilson Sons: Ports, maritime and logistics services
Wilson Sons is among Brazil’s largest and oldest port, maritime and logistics services companies. Within the port and logistics area are the container terminals, oil and gas support base and logistics activities. Under the maritime services heading are towage, shipyards and a 50% share in a JV operating offshore support vessels for the oil and gas industry.
|
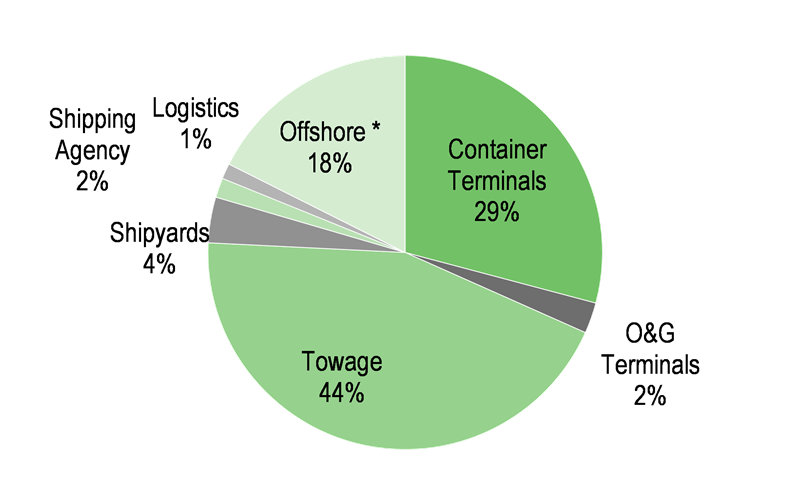
Exhibit 4: Revenue analysis (2015) |
Exhibit 5: EBITDA analysis (2015) |
|
|
|
Source: Wilson Sons. Note: *Offshore is pro forma share of JV. |
|
|
Exhibit 4: Revenue analysis (2015) |
|
|
|
|
Exhibit 5: EBITDA analysis (2015) |
|
|
|
|
Source: Wilson Sons. Note: *Offshore is pro forma share of JV. |
Exhibit 5 shows a divisional analysis of revenue and EBITDA: the largest contributors have been container terminals and towage. These divisions accounted for 58% of revenues and 70% of EBITDA from 2008 to 2015 (excluding corporate costs). Their revenue is driven by the volume of containers moved and the number of manoeuvres performed respectively. They are therefore sensitive to the volume rather than the value of trade (both international and domestic) that passes through Brazil. Directly oil and gas related businesses (the Brasco terminal and the offshore vessels JV) accounted for about 22% of EBITDA over the period. While these activities may be affected by the oil price (and to a lesser extent by the troubles of Petrobras), the effect is mitigated by having long-term contracts primarily supporting oil and gas production rather than exploration.
Container terminals
Wilson Sons operates the Rio Grande do Sul and Salvador container terminals in the south and north-east of Brazil respectively. The concession contracts are for 25 years, renewable for a further 25 years. In the case of Rio Grande, the option for renewal to operate between 2022 and 2047 is explicit in the amended contract signed by the state government and the delegated port authority as a result of Wilson Sons’ investment in the third berth at the terminal in 2007/08. For Salvador, the company continues exclusive discussions with the relevant government authorities for the renewal of the right to operate between 2025 and 2050 and believes satisfactory agreement on this renewal will be reached in due course. At both ports international trade makes up around 70% of the volume of full containers (which are more valuable to move), with Rio Grande having a higher proportion of exports. Recent relative dollar strength has been good for export volumes but weighed on imports; however, cabotage (domestic shipping trade) has benefited from increased use of this transport mode and growth in domestic consumption.
Both ports also have upgrade plans, with Salvador securing the first stage of approval for an increase in capacity at the end of last year. The timing of final approval is unpredictable, but eventually the company reports there is the potential to double the port’s capacity for a cost of approximately US$125m. This would take its handling capacity to nearly 1.1m TEU compared with 1.35m for Rio Grande, which itself has space for expansion that may help it continue to attract traffic from other large southern Brazilian (and Uruguayan) ports over the long term. Given that both ports were operating at about 55% of capacity in 2015 and that the company indicates capital expenditure is likely to remain low in the next few years, the expansion opportunities are an indicator of the capacity for secular growth rather than a signal for near-term investment plans.
Towage
Wilson Sons operates the largest tug fleet in Brazil with 75 (at end 2015) modern, mostly azimuth propulsion boats operating in all the major Brazilian ports and executing 50% of all manoeuvres in Brazilian ports in 2015. Apart from moving ships, tugs perform special operations such as firefighting, salvage and ocean towage. These command higher rates and margins, and have on average contributed 14% of the division’s revenues since 2008. Consolidation of shipping lines and the trend to larger ships have tended to slow the growth in the number of harbour manoeuvres, but increased the average deadweight towed at a compound rate of 3.9% CAGR between 2008 and 2015, supporting revenue growth. Owning its own shipyards provides an advantage in acquiring new tugs and in fleet maintenance. All domestic Brazilian operators enjoy regulatory protection and long-term, low-cost finance from the Fundo de Marinha Mercante (FMM). These benefits seem unlikely to change.
Oil and gas terminal (Brasco)
Brasco operates a port terminal that services oil platforms. It buys, stores and delivers parts, consumables and food, and processes waste. The acquisition of Briclog in 2013 provided scope to expand capacity, the uptake of which may be slow in 2016 due to the oil industry backdrop. In the longer term, as Brazil’s large pre-salt reserves are more fully exploited, demand for the extra capacity should grow.
Offshore support vessels (OSVs)
Wilson Sons UltraTug Offshore (WSUT), a 50:50 JV with Ultramar, a Chilean offshore services company, has a fleet of 19 OSVs, which will increase to 23 in 2016. Regulatory protection and low-cost finance exist, similar to those enjoyed by the towage business and the group’s shipyard facilities are also of benefit to the OSV business. The fleet transports machine parts, consumables and other supplies to offshore oil and gas production and exploration operations in Brazilian waters. It operates under contracts with Petrobras, which have an average unexpired term of four years.
Petrobras’s future plans are not certain, although it will continue to focus on production and exploration of the pre-salt reserves (already 36% of Brazil’s oil production). The remaining contract duration provides good revenue visibility for WSUT and two of the three new vessels to be delivered in 2016 have secured long-term operating contracts. WSUT took delivery of one new vessel in Q415 and expects four more in 2016. In December WSUT recontracted three vessels for two years, demonstrating confidence in demand. As with Brasco, although near-term growth may be muted as a result of the low oil price, in the longer term development of pre-salt oil production seems likely to generate growth for WSUT.
Shipyards, logistics and agency
The shipyards in Brazil’s biggest port of Santos are well-placed for the construction and maintenance of OSVs due to their proximity to the Santos and Campos oil basins. The order book at the end of 2015 was six tugboats for Wilson Sons and four OSVs for third parties (two of them for WSUT). Two more contracts have been signed in 2016 for tugboats to be delivered to third parties with options for four more. Including these options, the order book amounted to nearly $69m. In the immediate future, the business will also be seeking to win maintenance work to sustain activity levels and controlling costs to protect margins.
The logistics division includes distribution centres, transport and bonded warehousing with a focus on the latter. The depreciation of the real affected the bonded warehousing business as a result of reduced imports, while the withdrawal from low-margin dedicated operations has contributed to reduced revenues.
Agency is the longest-established business line for Wilson Sons and operates in Brazil’s main ports. It makes up a small part of the group and has had reduced revenues recently as shipping lines have taken the function in-house.
Revenue and EBITDA progression
Exhibit 6 below shows the development of revenues and EBITDA since 2008 including WSUT on a pro forma basis. The period shown includes the global financial crisis and Brazil’s own worsening difficulties over the last two years. Since 2013 revenue has fallen 22% in dollar terms, although with the benefit of c 48% dollar-denominated revenues, costs primarily in Brazilian reals and internal operating efficiencies, the company managed to marginally increase EBITDA. Towage and offshore made the biggest contributions to growth and since 2008 EBITDA has grown at a compound rate of 7.9%. For a discussion of Wilson Sons’ Q116 results see page 7.
Exhibit 6: Wilson Sons revenue and EBITDA analysis (US$m)
2008 |
2009 |
2010 |
2011 |
2012 |
2013 |
2014 |
2015 |
|
Divisional net revenues |
||||||||
Container Terminals |
155.5 |
148.7 |
178.8 |
203.5 |
189.5 |
227.4 |
189.6 |
152.5 |
O&G Terminal (Brasco) |
15.0 |
26.7 |
49.2 |
68.3 |
37.9 |
42.7 |
39.0 |
23.5 |
Towage |
147.1 |
145.7 |
156.2 |
167.4 |
179.1 |
196.6 |
211.0 |
213.8 |
Shipyards |
52.5 |
27.4 |
43.3 |
56.7 |
61.8 |
100.3 |
103.4 |
53.9 |
Shipping Agency |
17.6 |
15.2 |
17.6 |
20.3 |
24.6 |
24.5 |
17.1 |
15.4 |
Logistics |
89.3 |
75.8 |
102.4 |
140.5 |
108.2 |
96.8 |
73.4 |
49.9 |
Corporate |
(0.3) |
0.2 |
0 |
0.0 |
0.0 |
0.0 |
0.0 |
0.0 |
Offshore* |
21.6 |
38.1 |
28 |
41.4 |
47.0 |
54.4 |
76.9 |
71.0 |
Total |
498.3 |
477.8 |
575.5 |
698.0 |
647.9 |
742.8 |
710.4 |
579.9 |
Divisional EBITDA |
||||||||
Container Terminals |
60.6 |
49 |
61.4 |
74.6 |
75.4 |
75.5 |
74.4 |
66.9 |
O&G Terminal (Brasco) |
2.8 |
9.3 |
14.9 |
16.7 |
9.3 |
10.7 |
11.3 |
5.8 |
Towage |
54.5 |
61.3 |
53.4 |
61.4 |
62.4 |
74.6 |
85.8 |
101.3 |
Shipyards |
6.2 |
9.9 |
6.1 |
15.3 |
14.0 |
21.8 |
13.3 |
8.6 |
Shipping Agency |
3.3 |
2.3 |
0.8 |
2.7 |
4.9 |
4.1 |
0.8 |
3.7 |
Logistics |
6.6 |
7.1 |
13.1 |
24.5 |
13.2 |
18.2 |
2.8 |
2.9 |
Corporate |
(24.2) |
(29.7) |
(41.5) |
(43.1) |
(38.1) |
(22.2) |
(28.4) |
(21.1) |
Offshore* |
12.9 |
19.2 |
13.1 |
11.3 |
1,6.0 |
23.1 |
39.2 |
40.4 |
Total |
122.7 |
128.4 |
121.3 |
163.3 |
157.1 |
205.9 |
199.3 |
208.5 |
Source: Wilson Sons. Note: *Offshore is pro forma share of JV.
Ocean Wilsons Investments (OWIL)
Hanseatic Asset Management manages OWIL’s investment portfolio on an unconstrained global basis, aiming to achieve long-term returns while emphasising capital preservation. The manager seeks to achieve this objective by allocating between three silos: (1) core regional funds that form the core of the portfolio, aiming to capture the natural long-term growth in these markets; (2) an eclectic sector silo that gives exposure to selected areas seen as having strong long-term growth characteristics, such as biotechnology and technology; and (3) an eclectic diversifying silo including sectors that will provide an element of protection to the portfolio as the business cycle matures.
Four types of investment are made: public equities; private assets (mainly private equity); market neutral funds; and bonds. Cash is managed with a view to meeting commitments to future investments (such as private equity). The manager is more concerned about absolute loss of capital than short-term underperformance and the benchmark is absolute rather than relative (US CPI plus 3% over rolling three-year periods). The manager expects most investments to be in equity given the long-term investment horizon and to be either through collective funds or limited partnerships, using Hanseatic’s network to access the best opportunities through expert managers in specialised sectors and markets.
Investment approach
Manager selection is regarded as the key to successful management of the portfolio. Managers are initially considered after a search for exposure to a particular market or sector, a referral from the investment manager’s network or after introductions through sell-side relationships. The investment manager favours active specialist managers who can demonstrate an ability to add value over the long term and who invest on conviction rather than to meet short-term targets. Excessive size may be an impediment to outperformance so there is a bias towards managers who will restrict assets under management to suit the underlying opportunity. Qualitative considerations are important in the selection process, including assessment of the integrity, skill and motivation of a fund manager, as well as normal performance, risk assessment and legal checks. Once an investment has been made, regular reviews are conducted to monitor ongoing compatibility with the portfolio, signs of style-drift or changes of personnel.
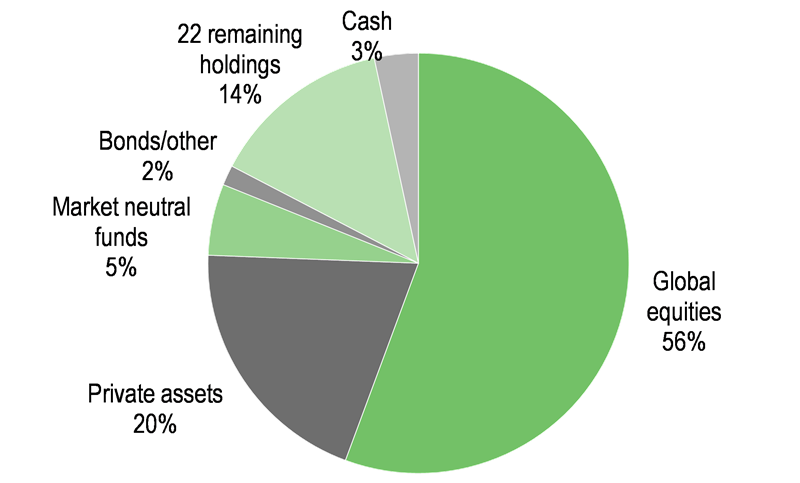
The portfolio has similarities with the endowment model: an emphasis on real returns, a perpetual time horizon and broad diversification, while avoiding assets with low expected returns (such as government bonds currently). The investment manager believes that illiquid assets such as private equity offer outsized returns given less efficient pricing, so the outperformance of better managers is greater. As Exhibit 7 shows, the portfolio has a significant private equity component, although global equities account for more than half the total. The manager notes that the portfolio retains an overweight position in emerging markets, which accounted for 32% of net assets at the 2015 year end (34% prior year). An analysis of the geographical disposition of the top 30 funds is shown in Exhibit 8.
|
Exhibit 7: OWIL portfolio by investment type (2015) |
Exhibit 8: OWIL top 30 holdings by geography (2015) |
|
|
|
Source: Ocean Wilsons |
|
Exhibit 7: OWIL portfolio by investment type (2015) |
|
|
Source: Ocean Wilsons |
|
Exhibit 8: OWIL top 30 holdings by geography (2015) |
|
|
Source: Ocean Wilsons |
Performance
In 2015 OWIL returned 1% following a strong fourth quarter, which saw a return of 1.7%. While this lagged the absolute benchmark of US CPI plus 3%, which was up 3.7% in 2015, it was ahead of world and emerging market equity indices. The MSCI All Country World Index and MSCI EM Index were down by 2.4% and 14.9%, respectively. The performance demonstrated the benefits of diversification: European investments with low energy and commodity exposure performed well, as did the short portfolios of some US funds and some US private equity funds performed well too. These offset a bad year for commodities and emerging markets as well as the effect of exposure to Valeant Pharmaceuticals through Pershing Square Holdings. In its quarterly update in May, Ocean Wilsons reported that the portfolio value was $239.5m, 1.9% below the end-2015 value.
Q1 for Wilson Sons and FY15 for Ocean Wilsons
Wilson Sons reported its first quarter results on 11 May. These were significantly influenced by Brazilian currency and economic weakness. Details of divisional revenues, EBITDA and margins are shown in Exhibit 9.
On average, the Brazilian real (BRL) saw a 26.5% devaluation against the US dollar in the first quarter compared with the same period in 2015. While nearly 50% of revenues (including the majority of Towage division revenues) are in US dollars, the drag from the poor economic background and reduced volume in the Shipyards activity also contributed to a near 26% decline in group revenues compared with the first quarter of last year.
There was a 25.1% decline in EBITDA (pro forma including Wilson Sons’ share of the offshore vessels JV). Here the mix of partial US dollar revenues and Brazilian costs did provide some protection; at Towage, the largest contributor, EBITDA was slightly ahead despite a modest revenue reduction. The progress here was more than offset by sharp reductions elsewhere, including a marginal move into loss at Shipyards, reflecting the incidence of workload in the quarter and, more generally, an unfavourable background for new ship orders currently. Logistics, although small within the group, also saw a marked reduction, reflecting the planned withdrawal from dedicated operations.
Exhibit 9: First quarter 2016 revenue, EBITDA and margins versus Q115 (US$m)
Division |
Revenue |
% change |
EBITDA |
% change |
Margin Q116 |
Margin Q115 |
Containers Terminal ("TECONs") |
29.3 |
-28.9 |
11.6 |
-35.3 |
39.6% |
43.4% |
O&G Terminal ("Brasco") |
5.1 |
-25.0 |
1.3 |
-28.4 |
25.5% |
27.9% |
Towage |
48.6 |
-5.1 |
24.0 |
1.1 |
49.4% |
46.3% |
Shipyards |
4.9 |
-76.2 |
(0.2) |
N/A |
-4.1% |
23.8% |
Shipping Agency |
3.3 |
-9.7 |
1.0 |
100.0 |
30.3% |
13.5% |
Logistics |
10.6 |
-32.5 |
1.0 |
-51.7 |
9.4% |
12.7% |
Corporate |
0.0 |
0.0 |
(4.3) |
12.3 |
N/A |
N/A |
Offshore Vessels* |
14.7 |
-16.3 |
6.6 |
-24.6 |
44.9% |
50.0% |
Total (pro forma) |
116.4 |
-25.7 |
41.0 |
-25.1 |
35.2% |
35.0% |
Source: Wilson Sons. Note: *Offshore JV included on a pro forma basis reflecting 50% participation. Revenue lines do not sum due to rounding differences.
A 12% positive move in the spot BRL/US$ exchange rate from end 2015 to end March resulted in positive foreign exchange effects relating to net monetary assets, deferred taxes and US dollar debt (in subsidiaries reporting in Brazilian reals); these totalled $13.4m (versus a $30.3m net negative figure for the first quarter last year). This explains the significant swing from a loss of $8.1m in Q115 to a $22m profit at the net income level in Q116.
Other points to pick out from the first quarter announcement include a sharp jump in first quarter capital spending (from $20.8m to $41.3m, excluding the offshore JV), mainly resulting from a one-off acquisition of six tugboats that had previously been leased. This will help maintain operations in the northern part of Brazil and secure cost savings of some $3.5m per annum. Capital spending is also underway on towage vessels and container port terminal equipment, but management has indicated the level of spend is set to remain below historical levels in the medium term.
For 2015, Ocean Wilson’s full year operating profit rose by 23% to $109.8m, mainly as a result of higher operating margins reflecting foreign exchange moves and cost control factors at Wilson Sons. The investment portfolio had a limited net impact on profits, with investment income largely balanced by costs and other gains and losses. OWIL’s investment portfolio was valued at $244.1m, or $6.91 per share at the end of 2015 (2014: $251.7m, $7.12/share); this was after paying dividends of $7m to the parent company and management and other fees of $2.7m. As noted above, the end April value stood at $239.5m. At the pre-tax profit level, foreign exchange related items, including exchange losses on foreign currency borrowings, contributed to a reduction from $78.5m to $69m. Cash generation increased to $145.5m from $105.6m, reflecting the lower capital expenditure at Wilson Sons, positive working capital movements and lower tax paid. The dividend of 63 cents was unchanged.
Outlook
For Wilson Sons, the macroeconomic backdrop in Brazil remains challenging and the political outlook uncertain. Positively, the suspension of President Rousseff and the initial steps in the formation of a technocratic interim government had been anticipated by and then well received in the stock market. The previously very low oil price and corruption investigations involving Petrobras have been significant negatives for oil-related activities in Brazil. The change in government, which led to management change at Petrobras, and a stronger oil price, now c $50, could start to create a more positive environment. These hopeful indicators help explain a rise of 19% in the Bovespa equity index and a 14% gain in the BRL/US$ exchange rate from January to early June. However, a genuine improvement in the Brazilian economy seems likely to be a prolonged process, perhaps threatening a reality check in markets at some point. The IMF in its latest forecasts looks for a 3.8% decline in GDP in the current year following a similar contraction in 2015, with a stabilisation rather than growth expected next year.
Given this background, and on the expectation of only a slow recovery in oil-related activity, Wilson Sons retains a strong focus on maximising efficiency. An important positive feature has been the strengthening in Brazilian exports following earlier depreciation in the currency and, in the first four months of the current year, export volumes through the container terminals were up 28% y-o-y, contributing to a 4% increase in total volume despite a 25% decline in import volume. In the oil sector, Wilson Sons does not expect exploration activity to revive in the near term, despite the partial rally in the oil price, but demand for OSVs and for Brasco’s services should be supported by international oil company production plans. WSUT’s contracts with the company have an average of four years to run. Two of WSUT’s newly built OSVs now have six-year contracts with Petrobras and 18 of the existing 19 are contracted to Petrobras throughout 2016 and beyond.
Wilson Sons shares have lagged the sharp rally in the broader market year to date (-9%), probably reflecting its relatively resilient nature and significant exposure to dollar-denominated turnover, confirming its status as a less sensitive play on long-term development in the Brazilian market.
|
Exhibit 10: Brazil GDP growth and inflation (%) |
Exhibit 11: Brazil imports and exports of goods |
|
|
|
Source: IMF World Economic Outlook April 2016 database |
|
|
Exhibit 10: Brazil GDP growth and inflation (%) |
|
|
|
|
Exhibit 11: Brazil imports and exports of goods |
|
|
|
|
Source: IMF World Economic Outlook April 2016 database |
Turning to the outlook for OWIL, the investment manager’s core expectation is for global equity markets to rise in the year ahead supported by positive economic growth, still accommodative monetary policy and fair market valuations. The manager remains positive on the long-term prospects for emerging markets with the possibility of a recovery in commodity markets potentially providing a boost at some point. The possible effects of a further increase in US interest rates, a further slowdown in China (which would have an impact on the Brazilian economy too) and the unwinding of quantitative easing could weigh on markets and the manager acknowledges that the business cycle is maturing. As a result, there is increased focus on how the portfolio might perform in a weaker market and identification of those funds and hedge funds that could provide protection in more difficult times.
Changes in our forecasts for 2016 are shown in Exhibit 12 below, with the significant reduction in revenue reflecting the substantial foreign exchange devaluation since our previous forecast was prepared last year. Variations in the foreign exchange related items also affect pre-tax profits and EPS. The assumed absence of the significant negative foreign exchange items seen in the 2015 figures, particularly within financing costs, helps to limit the impact on pre-tax profits in 2016. Details on the profit and loss, balance sheet and cash flow expectations for the forecast periods, including 2017 for the first time, are shown in Exhibit 15. Earnings per share are estimated to increase from 43.7c last year to 105.4c and 115.4c in 2016 and 2017 respectively.
Exhibit 12: Estimates old and new – FY16
Revenue (US$m) |
PBT (US$m) |
EPS (c) |
DPS (c) |
|
2016e old |
663.8 |
103.7 |
128.1 |
67.0 |
2016e new |
427.9 |
105.1 |
105.4 |
63.0 |
2017e new |
443.0 |
112.6 |
115.4 |
64.0 |
Source: Edison Investment Research
Currency sensitivity
OCN’s finance director, Keith Middleton, has prepared a detailed explanation of currency effects on the company accounts, which can be found on the company website. At an operational level, roughly half of revenues are in dollars but only 10% of costs. Therefore a weaker real reduces US dollar reported revenues but has a positive effect on margins. At the EBITDA level, Wilson Sons and OCN indicate that the net effect is roughly neutral. The accounting effects include the income statement line relating to net monetary items (showing exchange translations relating to working capital items), movements on debt (included in finance costs) and deferred tax adjustments relating to loans and fixed assets. The effects of exchange rate changes on the volume of imports and exports and on the wider Brazilian economy affect the company’s operations too.
Dividend policy
OCN has previously paid out the full dividend received from Wilson Sons in the period as well as a percentage of the average capital employed in the investment portfolio. A dividend of 63 cents was paid (3 June) in relation to 2015, the same as 2014. This consisted of 58.6 cents per share from Wilson Sons (all of the Wilson Sons dividend) and 4.4 cents from OWIL. Wilson Sons increased its dividend by 23% in the year to reflect a strong operating performance and the end of the capital investment cycle. In future management indicates that part of the Wilson Sons dividend will be used to fund the parent company’s costs, which have hitherto been covered entirely by dividends from the investment portfolio.
Management
The board comprises six non-executive directors and the finance director, Keith Middleton. Mr Middleton joined in 1996 having worked at a number of international companies. The chairman is José Francisco Gouvêa Vieira, who has been a director since 1991 and chairman since 1997. He is the chairman of Wilson Sons and a director of several other companies. William Salomon is the deputy chairman, a director of Wilson Sons, a non-executive director of Hansa Trust and chairman of the investment manager, Hanseatic Asset Management. Christopher Townsend was appointed a non-executive director in 2011 and is also on the board of Hansa Capital. Andrés Rozental, the senior independent director, is a director of Wilson Sons as well as several large industrial companies and is an expert in international affairs. The other two independent directors are Colin Maltby and Andrey Berzins. Mr Maltby holds a variety of directorships and served as head of investments at BP from 2000 to 2007. Mr Berzins is a director of Aberdeen Asian Income Fund and was appointed to OCN’s board in 2014.
Valuation: A substantial discount
The market value of OCN’s holding in Wilson Sons is only 4% below OCN’s own market capitalisation, with OCN’s discount to the look-through NAV standing at 35% (Exhibit 13). The look-through NAV is made up of the quoted price of Wilson Sons and the latest valuation of OWIL’s portfolio. While OCN may be less sensitive to Brazilian developments than some stocks, the substantial discount could be seen as offering a decent cushion for investing in a Brazilian business with a long track record and resilience provided by its dollar revenues as well as the diversification of the OWIL portfolio.
Exhibit 13: Ocean Wilsons’ share price discount to look-through NAV
|
p |
£m |
Last OWIL value per Ocean Wilsons share (end April 2016) |
465.3 |
164.5 |
Wilson Sons market value per Ocean Wilsons share (7 June 2016) |
766.4 |
271.0 |
Ocean Wilsons look-through value |
1,231.7 |
435.6 |
Ocean Wilsons share price/market cap (7 June 2016) |
795.0 |
281.1 |
Discount |
35% |
35% |
Source: Datastream, Ocean Wilsons. Note: using exchange rate of US$1.45/£.
We also consider Wilson Sons’ valuation in the context of its peers using consensus valuations. Exhibit 14 shows a selection of Brazilian and international port and shipping companies with consensus P/E and EV/EBITDA multiples. Although differences in liquidity, levels of analyst coverage and the nature of operations makes comparison difficult, Wilson Sons does not appear to be expensively rated compared with its peers.
Exhibit 14: Selected Wilson Sons comparator valuations
Company |
Market cap (US$m) |
P/E FY1 |
P/E FY2 |
EV/EBITDA FY1 (x) |
EV/EBITDA FY2 (x) |
Price to book (x) |
Wilson Sons |
663 |
14.8 |
12.9 |
4.3 |
4.0 |
1.4 |
Santos Brasil |
493 |
48.2 |
32.4 |
9.1 |
7.8 |
1.2 |
JSL (BRA) |
606 |
24.8 |
11.0 |
6.1 |
5.3 |
2.5 |
China Merchants (HKG) |
7,115 |
12.9 |
12.1 |
17.2 |
13.1 |
0.8 |
Dalian Port (HKG) |
3,906 |
28.2 |
30.0 |
N/A |
N/A |
0.9 |
Far Eastern Shipping (RUS) |
89 |
N/A |
3.3 |
10.6 |
8.1 |
N/A |
Hamburger Hafen (GER) |
1,257 |
20.1 |
16.6 |
5.7 |
5.2 |
2.1 |
Port Of Tauranga (NZL) |
1,883 |
34.6 |
30.7 |
22.0 |
19.6 |
3.0 |
Sinotrans (HKG) |
2,047 |
9.3 |
8.5 |
7.8 |
6.7 |
0.9 |
Total/average |
18,060 |
24.1 |
17.5 |
10.4 |
8.7 |
1.6 |
Source: Bloomberg. Note: prices as at 8 June 2016.
Exhibit 15: Financial summary
Year end December |
$m |
2012 |
2013 |
2014 |
2015 |
2016e |
2017e |
|
PROFIT & LOSS |
||||||||
Revenue |
|
|
610.4 |
660.1 |
633.5 |
508.9 |
427.9 |
443.0 |
Cash costs |
(469.2) |
(492.4) |
(479.3) |
(344.6) |
(286.7) |
(283.5) |
||
EBITDA |
|
|
141.2 |
167.7 |
154.2 |
164.3 |
141.2 |
159.5 |
Depreciation and amortisation |
(55.9) |
(58.7) |
(65.1) |
(53.2) |
(49.6) |
(58.2) |
||
Operating Profit |
|
|
85.3 |
109.1 |
89.1 |
111.1 |
91.6 |
101.3 |
Profit/loss on PPE |
(0.5) |
10.0 |
0.3 |
(1.3) |
0.0 |
0.0 |
||
Share of results of JVs |
0.7 |
2.4 |
7.1 |
4.8 |
4.4 |
5.1 |
||
Investment revenue |
18.3 |
17.8 |
17.0 |
16.9 |
15.9 |
15.5 |
||
Other gains and losses |
16.4 |
13.7 |
6.2 |
(1.4) |
5.0 |
5.1 |
||
Finance costs |
(9.9) |
(21.9) |
(23.6) |
(45.4) |
(14.6) |
(14.4) |
||
Exchange gains/losses on monetary items |
(11.6) |
(30.6) |
(17.6) |
(15.8) |
2.7 |
0.0 |
||
Profit before tax |
|
|
98.6 |
100.5 |
78.5 |
68.9 |
105.1 |
112.6 |
Income tax |
(33.7) |
(42.2) |
(41.9) |
(39.7) |
(38.8) |
(38.8) |
||
Non-controlling interests |
(23.6) |
(20.4) |
(13.4) |
(13.8) |
(29.0) |
(33.0) |
||
Earned |
|
|
41.3 |
37.9 |
23.2 |
15.5 |
37.3 |
40.8 |
Average number of shares m |
35.4 |
35.4 |
35.4 |
35.4 |
35.4 |
35.4 |
||
EPS - normalised and fully diluted (c) |
|
116.7 |
107.1 |
65.6 |
43.7 |
105.4 |
115.4 |
|
Dividend per share (c) |
42.0 |
60.0 |
63.0 |
63.0 |
63.0 |
64.0 |
||
EBITDA Margin (%) |
23.1 |
25.4 |
24.3 |
32.3 |
33.0 |
36.0 |
||
Operating Margin (%) |
14.0 |
16.5 |
14.1 |
21.8 |
21.4 |
22.9 |
||
BALANCE SHEET |
||||||||
Fixed Assets |
|
|
695.6 |
768.1 |
819.6 |
713.6 |
773.3 |
806.9 |
Intangible Assets |
45.0 |
84.3 |
73.6 |
53.7 |
50.2 |
46.0 |
||
Tangible Assets |
650.7 |
683.8 |
746.0 |
660.0 |
723.1 |
760.9 |
||
Investments |
0.0 |
0.0 |
0.0 |
0.0 |
0.0 |
0.0 |
||
Current Assets |
|
|
615.2 |
564.4 |
493.0 |
486.7 |
459.8 |
482.0 |
Stocks |
37.5 |
29.1 |
32.5 |
28.3 |
23.8 |
24.6 |
||
Debtors |
199.5 |
150.8 |
96.2 |
84.0 |
70.6 |
73.1 |
||
Cash |
136.7 |
106.5 |
103.8 |
97.6 |
80.3 |
87.7 |
||
Other |
241.6 |
278.0 |
260.5 |
276.9 |
285.2 |
296.6 |
||
Current Liabilities |
|
|
(213.2) |
(175.8) |
(133.7) |
(126.6) |
(114.1) |
(116.4) |
Creditors |
(176.5) |
(136.2) |
(81.0) |
(84.0) |
(71.4) |
(73.7) |
||
Short term borrowings |
(36.7) |
(39.5) |
(52.6) |
(42.7) |
(42.7) |
(42.7) |
||
Long Term Liabilities |
|
|
(354.1) |
(386.6) |
(411.6) |
(393.2) |
(386.0) |
(378.8) |
Long term borrowings |
(326.9) |
(339.2) |
(347.2) |
(323.8) |
(318.8) |
(313.8) |
||
Other long term liabilities |
(27.1) |
(47.4) |
(64.3) |
(69.4) |
(67.2) |
(65.0) |
||
Net Assets |
|
|
743.6 |
770.1 |
767.3 |
680.5 |
733.0 |
793.7 |
CASH FLOW |
||||||||
Operating Cash Flow |
|
|
154.9 |
148.7 |
150.5 |
182.3 |
152.1 |
161.4 |
Net Interest |
(0.5) |
1.7 |
(0.6) |
1.8 |
0.5 |
0.3 |
||
Tax |
(31.9) |
(27.3) |
(29.5) |
(22.7) |
(34.7) |
(33.8) |
||
Capex |
(101.5) |
(88.2) |
(101.0) |
(64.8) |
(103.0) |
(88.0) |
||
Acquisitions/disposals |
0.0 |
(10.2) |
(26.7) |
0.0 |
0.0 |
0.0 |
||
Equity financing |
0.0 |
0.0 |
0.0 |
0.0 |
0.0 |
0.0 |
||
Other (including divs from JV) |
(2.3) |
(45.9) |
17.9 |
(33.1) |
10.0 |
10.0 |
||
Dividends |
(22.5) |
(23.9) |
(34.5) |
(36.4) |
(37.1) |
(37.5) |
||
Net Cash Flow |
(3.8) |
(45.2) |
(23.8) |
27.2 |
(12.3) |
12.4 |
||
Opening net debt/(cash) |
|
|
223.2 |
227.0 |
272.2 |
296.1 |
268.9 |
281.2 |
Other |
0.0 |
0.0 |
(0.0) |
(0.0) |
0.0 |
(0.0) |
||
Closing net debt/(cash) |
|
|
227.0 |
272.2 |
296.1 |
268.9 |
281.2 |
268.8 |
Source: Ocean Wilsons, Edison Investment Research
Exhibit 16: Ocean Wilsons debt structure
US$m |
2012 |
2013 |
2014 |
2015 |
2016e |
2017e |
Short-term debt and finance leases |
36.7 |
39.5 |
52.6 |
42.7 |
42.7 |
42.7 |
Long-term debt and finance leases |
326.9 |
339.2 |
347.2 |
323.8 |
318.8 |
313.8 |
Total debt |
363.7 |
378.8 |
399.9 |
366.5 |
361.5 |
356.5 |
Cash and cash equivalents* |
156.7 |
139.5 |
127.8 |
138.3 |
121.0 |
128.4 |
Net debt |
207.0 |
239.2 |
272.1 |
228.2 |
240.5 |
228.1 |
Share of JV debt |
208.5 |
250.9 |
257.4 |
273.8 |
||
Net debt including JV share |
415.5 |
490.1 |
529.5 |
502.0 |
||
OCN net debt/equity |
28% |
31% |
35% |
34% |
33% |
29% |
OCN +JV net debt/equity |
56% |
64% |
69% |
74% |
Source: Ocean Wilsons, Edison Investment Research. Note: *Cash and cash equivalents include short-term investments held in Wilson Sons that are intended to fund operations in Brazil.
|
|||||||||||||||||||||||||||||||||||||||||||
|
Investment Companies
