Last close As at 05/08/2026
—
— 0.00 (0.00%)
Market capitalisation
—
Research: Financials
Key themes from Numis’s FY18 results were the continued growth in the corporate client base, significant investment in staff and other costs to support growth, and maintenance of its institutional client base following MiFID II implementation. Cost growth meant that while revenue reached a new record, profits were lower. Recent market trends suggest profits could be lower again this year and we have reduced our estimate accordingly. Looking beyond this, the investment in strengthening the franchise should mean that Numis is well placed to achieve further significant growth through market cycles.
Written by
Numis Corporation |
Keeping its eye on longer-term growth |
FY18 result and outlook |
Financial services |
14 January 2019 |
Share price performance
Business description
Next event
Analysts
Numis Corporation is a research client of Edison Investment Research Limited |
|||||||||||||||||||||||||||||||||||||||||||||||
Key themes from Numis’s FY18 results were the continued growth in the corporate client base, significant investment in staff and other costs to support growth, and maintenance of its institutional client base following MiFID II implementation. Cost growth meant that while revenue reached a new record, profits were lower. Recent market trends suggest profits could be lower again this year and we have reduced our estimate accordingly. Looking beyond this, the investment in strengthening the franchise should mean that Numis is well placed to achieve further significant growth through market cycles.
Year end |
Revenue (£m) |
PBT* |
EPS* |
DPS |
P/E |
Yield |
09/16 |
112.3 |
32.5 |
22.4 |
12.0 |
11.4 |
4.7 |
09/17 |
130.1 |
38.3 |
25.9 |
12.0 |
9.8 |
4.7 |
09/18 |
136.0 |
31.6 |
23.0 |
12.0 |
11.1 |
4.7 |
09/19e |
124.9 |
25.4 |
18.0 |
12.0 |
14.2 |
4.7 |
Note: *PBT and EPS are diluted on a reported basis.
Results for FY18
Numis had already indicated in its September trading update that H218 results would be affected by the timing of transactions and a lower average transaction fee level than in the first half. In the event revenue for the full year was 4.6% ahead of FY17. Cost growth was pushed up by investment in additional staff and increases in other costs to strengthen the Numis platform in order to enhance service for existing clients and provide capacity for further growth. Overall cost growth of 11.5% resulted in a 17.4% reduction in pre-tax profits while a lower tax rate meant the earnings per share reduction was 8.4%. The full year dividend was held at 12p and the balance sheet remained strong with cash of over £111m and significant capital head room. The group retains its commitment to controlling the share count and returning excess capital to shareholders through share buybacks.
Investing to build the franchise further
Numis is setting its strategy in the context of its vision of becoming the “investment bank of a generation”. The investment in staff last year led to a 16% increase in the number of staff at the end of the year and this will make an important contribution to a strategy that includes: building the size and quality of the corporate client base, becoming the leading UK equities platform and developing complementary products and services (more detail on page 3). Near-term results will be subject to market conditions but Numis appears well-placed to realise its ambition in the medium term without having to consider the consolidation that may feature elsewhere in the sector.
Valuation: Estimates cut but price has adjusted
Reflecting more challenging current market conditions, we have reduced our FY19 EPS estimate by 30%, but the shares have already fallen by over 45% from their 12-month high and there could be upside for estimates if market uncertainties ease. A ROE/COE model suggests the share price discounts an ROE of c 15%, which appears cautious.
Aspiring to be the investment bank of a generation
Formation and management succession
Numis was founded in the late 1980s and listed on AIM in 1996. It has grown to become a leading UK corporate advisory and stockbroking business and has stated its vision as becoming “the investment bank of a generation”. The current co-CEOs, Alex Ham and Ross Mitchinson, joined the company in 2005 and 2008 respectively and assumed their roles in September 2016. The success of the management transition was signalled when former CEO and founder Oliver Hemsley stepped down from the board and all executive responsibilities in May 2017.
Evidence of franchise strength
Underpinning the growth of the business has been the steady addition of corporate clients with an accompanying increase in their average market capital: at the end of FY18 there were 210 clients with an average market cap of £800m (Exhibit 1). While the average size has increased, Numis has not given up its traditional area of strength in small-cap broking and the median market cap is around £400m. For the last three financial years Numis has ranked number one in the Bloomberg league table for equity capital markets transactions on London markets; it also ranked first in the Extel survey for UK small and mid-caps for the sixth year running underlining the strength of the research and sales team which has also been confirmed by the maintenance of the client base and revenues through the implementation of MiFID II.
Revenue CAGR of 18% since 2012
The evolution of revenues since 2012 is shown in Exhibit 2 demonstrating that growth has been seen across the business but is most striking for the deal fees generated by the capital markets segment that achieved 33% compound growth and contributed more than 40% of last year’s revenue. Institutional commissions account for 28% of the total and have recorded 10% CAGR despite persistent pressure on commission rates, even before changes that took place in the run up to the implementation of MiFID II. Corporate retainers provide a resilient source of annual fees and have grown with the client base. As would be expected, trading has seen fluctuations in income but has contributed positively in each year and grown significantly over the period shown. Finally, advisory has grown, now accounting for 13% of revenues and is an area of focus for future growth.
The largest element of cost for the business is staff remuneration and for most of the period since 2012 the compensation ratio has remained close to the average value of 54% while the overall cost income ratio has been managed close to the corresponding average of 76%. This has allowed an operating profit margin of between 22% and 29% for the years shown with the exception of 2012 when profitability was still depressed in the wake of the financial crisis (operating margin 7.5%).
|
Exhibit 1: Corporate client numbers and market cap |
Exhibit 2: Revenue progression (year to 30 September) |
|
|
|
Source: Numis, Edison Investment Research |
|
Exhibit 1: Corporate client numbers and market cap |
|
|
Source: Numis, Edison Investment Research |
|
Exhibit 2: Revenue progression (year to 30 September) |
|
|
Source: Numis, Edison Investment Research |
Vision and strategy
Within the group’s overall vision of becoming the investment bank of a generation, management has identified five strategic pillars that, if executed successfully, should secure sustainable growth (subject to market cycles), profitability and attractive shareholder returns.
1)
Build the size and quality of the corporate franchise. Here, as noted above, Numis has a strong starting base and track record of success. The aim is to grow across the range of market caps and to be a natural home for interesting small-cap companies. The investment made in additional staff will help support this effort enabling high levels of service to be maintained as the client base expands. To help achieve the target, sector performance will be monitored and teams will be given accountability. While the significant increase in headcount seen in FY18 is unlikely to be repeated in the current year further hires will be made where there is scope to fill gaps. Technology investment also contributes here with the recently launched app for corporate clients providing them with relevant information from the Numis platform in a readily accessible manner. While there is no shortage of competition in the market for corporate clients, Numis appears well-placed given the position it already has and the access to institutional clients it has maintained following MiFID II.
2)
Become the leading UK equities platform. This reflects the ambition to grow the equity capital markets market share further and to build on the success to date in maintaining institutional relationships and research ranking. Achieving this will involve making the most of the staff additions during FY18 and ensuring that institutional relationships are sustained as these clients continue to refine their budgets in the wake of MiFID II. The latter point remains a source of uncertainty for all brokers but, again, Numis appears relatively well-placed given its research coverage and existing position.
3)
Develop complementary products and services. Numis seeks to increase its advisory revenues, continue to develop its private markets activity and identify additional new areas for development. The strengthening of the advisory business will help deepen the group’s engagement with corporate clients, incorporating strategic advice in addition to existing corporate finance services. The private markets area actually experienced a disappointing level of private placements in FY18 but, strategically, this remains a business Numis is keen to develop given the trend for developing businesses to remain unquoted for longer and the potential it offers to enlarge the network of companies from which future public market flotations may flow. It also enables Numis to develop additional relationships with those institutions that invest in unquoted companies.
4)
Maintain operating and capital discipline. While the investment in new staff over the last financial year has affected the cost base, the group remains committed to managing cost ratios over the cycle. Attention is to be paid to realising efficiency improvements and there is cost accountability across the different activities that should help ensure that there is a balanced and targeted approach taken to additional spending. The test of this approach could come if there is a significant market downturn where there is not an immediate correction. In this circumstance the challenge will be to maintain the benefits of the investment made in strengthening the platform whilst moderating the impact of lower revenues on profitability.
5)
Deliver shareholder returns. The first four strategic pillars should feed into attractive returns for shareholders over the cycle. Revenue growth paired with maintained or improved profit margin would generate higher earnings and a sustained or improved ROE. New complementary products and services would help diversify revenues and reduce their volatility to some extent. Finally, the continued commitment to offsetting share issuance from staff compensation schemes with buybacks and using the same mechanism to return excess cash to shareholders should help protect returns and earnings per share.
FY18 results
Revenue growth of 4.6% for FY18 versus FY17 was slightly ahead of the indication of approximately 3% given at the time of the trading update in September reflecting the timing of transactions close to the year end. Cost growth of 11.5%, driven mainly by investment in additional staff, left pre-tax profits down by 17.4% and EPS 8.4% lower after a reduced effective tax rate of 15.7% versus 20.7%. Exhibit 3 provides a summary of the figures including the segmental revenue analysis while key points are noted below. Figures are compared with FY17 unless stated.
Exhibit 3: Profit and loss analysis
£m unless stated |
FY17 |
FY18 |
FY18/FY17 |
H217 |
H118 |
H218 |
H218/H217 |
|
Net trading gains |
9.0 |
9.6 |
6.0% |
4.1 |
4.6 |
5.0 |
24.4% |
|
Institutional commissions |
35.8 |
37.9 |
5.9% |
17.3 |
18.7 |
19.1 |
10.6% |
|
Equities |
44.8 |
47.5 |
5.9% |
21.4 |
23.3 |
24.2 |
13.2% |
|
Corporate retainers |
11.6 |
12.4 |
7.4% |
6.0 |
6.1 |
6.3 |
5.8% |
|
Advisory fees |
14.4 |
17.3 |
20.8% |
8.0 |
11.7 |
5.6 |
(30.1%) |
|
Placing commissions / capital markets |
59.4 |
58.8 |
(0.9%) |
42.4 |
33.0 |
25.8 |
(39.1%) |
|
Corporate broking and advisory |
85.3 |
88.6 |
3.9% |
56.3 |
50.9 |
37.7 |
(33.0%) |
|
Total revenue |
130.1 |
136.0 |
4.6% |
77.7 |
74.1 |
61.9 |
(20.3%) |
|
Other operating income |
3.4 |
1.7 |
(49.5%) |
2.0 |
0.4 |
1.3 |
(33.0%) |
|
Total income |
133.5 |
137.8 |
3.2% |
79.7 |
74.5 |
63.2 |
(20.6%) |
|
Staff costs |
(69.0) |
(75.3) |
9.2% |
(38.7) |
(40.0) |
(35.4) |
()8.7% |
|
Non-staff costs |
(26.4) |
(31.0) |
17.5% |
(13.3) |
(14.9) |
(16.2) |
21.4% |
|
Total administrative expenses |
(95.4) |
(106.3) |
11.5% |
(52.1) |
(54.8) |
(51.5) |
(1.0%) |
|
Operating profit / loss |
38.1 |
31.4 |
(17.6%) |
27.6 |
19.7 |
11.7 |
(57.6%) |
|
Finance income/expense |
0.2 |
0.2 |
12.8% |
0.2 |
(0.2) |
0.4 |
85.8% |
|
Pre-tax profit |
38.3 |
31.6 |
(17.4%) |
27.9 |
19.5 |
12.1 |
(56.5%) |
|
Tax |
(7.9) |
(5.0) |
(37.5%) |
(6.3) |
(2.7) |
(2.3) |
(64.3%) |
|
Effective tax rate |
20.7% |
15.7% |
(24.3%) |
22.6% |
13.9% |
18.6% |
(18.0%) |
|
Attributable profit |
30.4 |
26.7 |
(12.2%) |
21.5 |
16.8 |
9.9 |
(54.2%) |
|
Diluted EPS (p) |
25.9 |
23.0 |
(11.1%) |
18.3 |
14.6 |
8.5 |
(53.6%) |
|
Dividend (p) |
12.0 |
12.0 |
0.0% |
6.5 |
5.5 |
6.5 |
0.0% |
Source: Numis, Edison Investment Research
■
Equities revenue showed progress (+6%) for the year despite the changes brought about by implementation of MiFID II. The second half also showed progress both sequentially and y-o-y. The institutional client base has not seen a material change and institutional revenues alone mirrored the overall Equities divisional trend.
■
Corporate broking and advisory revenues were 4% ahead with mixed trends between sub-segments. Strongest was advisory, an area of focus for Numis, where fees were up 21%. Corporate retainer fees were ahead on an increased client count (210 versus 202) and capital markets was close to the record level of FY17 after a sharp reduction in H2 revenue, reflecting the timing of transactions and a lower level of average fees in the period.
■
The year was one of investment in staff recruitment to support service levels to existing clients and further growth in the business. Additions have been made for both the corporate broking and advisory and equities businesses with the period-end headcount up 16% to 273. Investment has also been made in strengthening the IT infrastructure of the platform. As a result the compensation ratio increased from 53% to 55%.
■
As noted this resulted in a 17.4% pre-tax profit reduction from £38.3m to £31.6m with a steeper fall in the second half, reflecting the weighting of revenues to the first half.
■
The full year dividend was unchanged at 12p/share. The group aims to pay a stable dividend while remaining committed to returning excess cash to shareholders and mitigating the dilutive impact of share awards; during the year £16.3m (£22.9m) was spent on buying back shares.
■
The capital and liquidity position of the group remains strong with cash of £111.7m at the year end compared with £95.9m. Qualifying capital stands at roughly double the regulatory requirement.
Focusing on the investment in additional staff more closely, Exhibit 4 shows how headcount has increased with the corporate client list in recent years. The addition of 38 staff during FY18 represented a step up and the average headcount increased by 7%. This contributed to the reduction in revenue per head (which fell by 9%) after two years of growth of over 12% following 2015, which also saw a large increase in the average number of staff (+11%) and a decline in revenue per head (-5%).
New hires in FY18 were made across both the corporate broking and advisory and equities businesses enhancing coverage and capabilities across a number of sectors. New products and services facilitated by recruitment included an event-driven offering within equities and debt advisory and market intelligence within corporate broking and advisory. Signalling a desire to bring in talent at an earlier stage and confidence in the culture that exists in the business, the group completed both its first graduate recruitment (nine graduates who joined in September) and also undertook its first formal intern programme that involved 16 summer interns. The inclusion of a high proportion of senior staff among the new joiners magnified the impact on costs and hence cost to revenue ratios. As shown in Exhibit 5, both compensation and non-compensation ratios increased as Numis also invested in its technology platform to help meet new regulatory requirements and enhance current and future service levels. The other point to note from this chart is that although there have been variations as noted, cost ratios have been managed with a relatively narrow range over this period (for comparison, during the financial crisis the compensation ratio peaked at 70% in FY09).
|
Exhibit 4: Expanding headcount to service clients |
Exhibit 5: Cost to revenue ratios |
|
|
|
Source: Numis, Edison Investment Research |
|
Exhibit 4: Expanding headcount to service clients |
|
|
Source: Numis, Edison Investment Research |
|
Exhibit 5: Cost to revenue ratios |
|
|
Source: Numis, Edison Investment Research |
As announced at the interim stage, the Numis Mid Cap fund was liquidated during the second half, a decision based on the view that its performance record over three years (broadly in line with its benchmark) would not justify marketing the fund to third-party investors. This released £12.5m and was the main factor behind a reduction in the investment portfolio from £28.1m to £16.3m during FY18. The portfolio generated a net gain of £1.7m for the year (£3.4m FY17). The portfolio is now primarily unquoted investments (96%) and the aim is to focus on early-stage investments which could benefit from access to the business network that Numis can provide with investments being recycled as they become more mature.
Trading background and outlook
UK equity markets fluctuated during the Numis financial year to end September, notably in early 2018 when volatility spiked, but over the year as a whole the FTSE All-Share, Small Cap and AIM All-Share indices were all in positive territory. Since then a mixture of macroeconomic and geopolitical uncertainties and concerns gained traction prompting a sharp market correction in October and further weakness subsequently (Exhibit 6 shows the index performance for Numis in FY18 and FY19 to date and from five-year highs).
Exhibit 6: Equity indices recent performance
FTSE AIM All-Share |
FTSE All-Share |
FTSE Small Cap |
|
FY18 |
9% |
2% |
2% |
FY19 year-to-date |
(18%) |
(8%) |
(8%) |
From 5-year high |
(18%) |
(12%) |
(12%) |
Source: Thomson Datastream as at 10 January 2019
In addition to the recent equity market weakness, Exhibit 7 highlights the larger movements seen in the FTSE AIM All-Share index over the last five years compared with the All-Share and the FTSE Small Cap index. Putting the recent rise in market volatility into context, Exhibit 8 shows how the FTSE 100 volatility index is now nearer to the higher level that prevailed between 2014 and mid-2016.
|
Exhibit 7: FTSE AIM, All-Share and Small Cap indices |
Exhibit 8: FTSE 100 volatility index |
|
|
|
Source: Thomson Datastream |
|
Exhibit 7: FTSE AIM, All-Share and Small Cap indices |
|
|
Source: Thomson Datastream |
|
Exhibit 8: FTSE 100 volatility index |
|
|
Source: Thomson Datastream |
Turning to London Stock Exchange (LSE) issuance data, Exhibits 9 and 10 show a mixed picture for activity between the Main market and AIM. The Main market has been resilient with total issuance up 16% in H2 to November and also ahead for the months of October and November alone (the first two months of Numis’s financial year). In contrast, AIM issuance has been very weak (down 42% and 55% for the same periods).
|
Exhibit 9: LSE Main market issuance |
Exhibit 10: LSE AIM issuance |
|
|
|
Source: LSE (calendar years) |
|
Exhibit 9: LSE Main market issuance |
|
|
Source: LSE (calendar years) |
|
Exhibit 10: LSE AIM issuance |
|
|
Source: LSE (calendar years) |
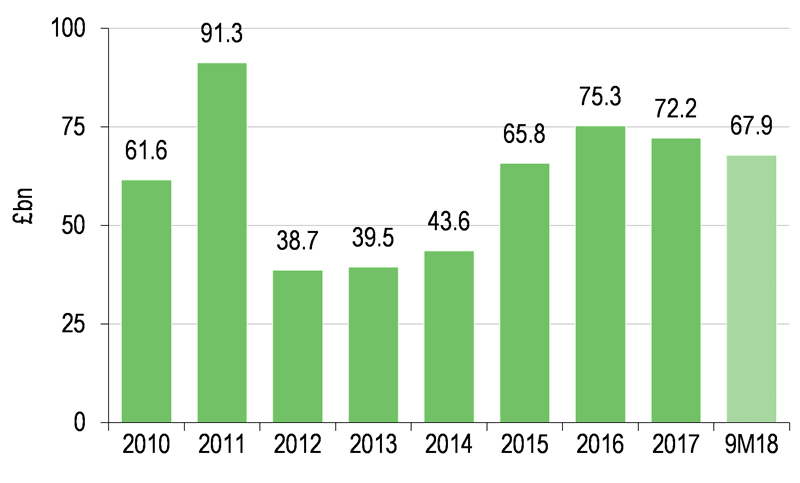
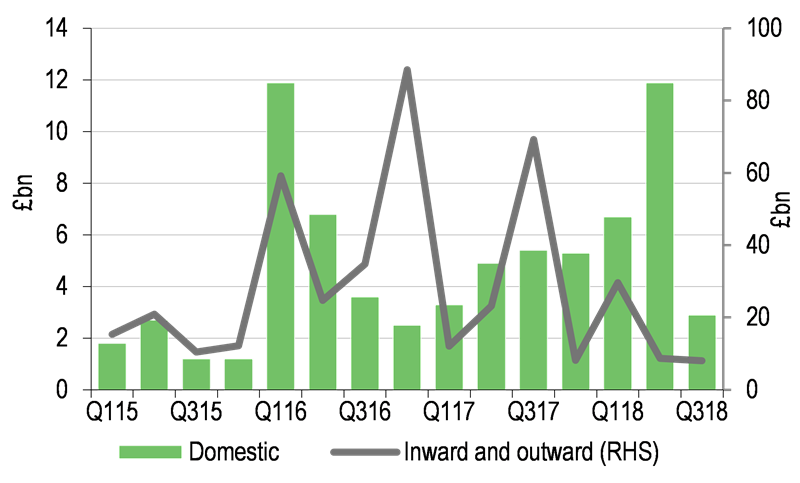
UK M&A data for the longer term (Exhibit 11) show that the transaction value for the first nine months of 2018 was running at above the annual rate for 2017 although quarterly numbers (Exhibit 12) show a marked drop in domestic activity in the latest quarter, potentially showing the chilling effect of market and political uncertainty (with the caveat that these figures have historically shown considerable volatility between quarters).
|
Exhibit 11: UK M&A transaction value |
Exhibit 12: UK M&A value, recent quarterly trends |
|
|
|
Source: ONS. Note: Inbound, outbound and domestic. Excludes deals above £10bn that affected 2016/17 data. Calendar years. |
Source: ONS. Note: Not adjusted for large deals 2016/17. Calendar quarters. |
|
Exhibit 11: UK M&A transaction value |
|
|
Source: ONS. Note: Inbound, outbound and domestic. Excludes deals above £10bn that affected 2016/17 data. Calendar years. |
|
Exhibit 12: UK M&A value, recent quarterly trends |
|
|
Source: ONS. Note: Not adjusted for large deals 2016/17. Calendar quarters. |
Numis’s own experience in terms of corporate transactions has been that the number of transactions in its second half was similar to the first half but that the average deal fee (key variables being deal size and Numis’s role) was lower.
Prospectively, the main economic and geopolitical uncertainties that appear to have contributed to the increase in market volatility remain in play, but the easing of concerns surrounding trade tensions, tightening of monetary policy and Brexit could create a more favourable background in equity markets in due course.
In the near term, as Numis itself has noted, the market background is more challenging for share issuance, trading and M&A activity. In the first two months of FY19, the company completed 14 deals including three IPOs, which was nevertheless a reduction on the level achieved in FY18. Positively, deal fees remained in line with the average level for FY18 and general activity levels in the corporate broking and advisory business were high and the transaction pipeline was strong. Three new corporate clients with an average market capitalisation of £1.4bn have been added since the year end. The equities business has been affected by the increase in volatility and trading profits and institutional revenues were lower than the prior year period in the first two months of FY19.
Looking further ahead, the continued addition of corporate clients combined with the investment in staff provides a sound base for further growth in the business through fluctuations in market levels and activity. On the equities side of the business the signs are that Numis has successfully navigated the introduction of MiFID II, although buy and sell side commentators agree that the market is continuing to assimilate the changes entailed so further jockeying for position may result in additional revenue pressures or gains in market share as institutions refine their budget allocations. If successful, the group’s push to expand the advisory and private markets businesses and new services such as event driven and debt advisory will not only enlarge but also diversify revenue.
In the next section we discuss changes in our estimates for the current year.
Financials
Our estimates for the current year are reduced given the more challenging conditions being experienced currently and highlighted above. As is always the case for capital market participants such as Numis, estimates are particularly vulnerable to changes in market level and sentiment. The impact of positive and negative revenue surprises is mitigated to some extent by the variable component of compensation but there is still a noticeable degree of operational gearing when revenue estimates are changed. As shown in Exhibit 13, our revenue estimate for FY19 is reduced by 15% which, with the assumption that the cost income ratio increase is limited to under three percentage points (to 80%), feeds through to a 30% reduction at the pre-tax profit level. There would probably be upside for estimates if market uncertainties ease. Conversely, a more marked revenue reduction would potentially push the cost income ratio materially higher until activity levels recovered, as management would probably be reluctant to compromise the investments made in the platform for the longer term.
Exhibit 13: Estimate revisions
Revenue (£m) |
PBT (£m) |
EPS (p) |
DPS (p) |
|||||||||
Old |
New |
Change |
Old |
New |
Change |
Old |
New |
Change |
Old |
New |
Change |
|
09/18 |
133.7 |
136.0 |
1.8% |
27.9 |
31.6 |
13.5% |
19.8 |
23.0 |
16.5% |
12.0 |
12.0 |
0.0% |
09/19e |
147.7 |
124.9 |
-15.4% |
36.3 |
25.4 |
-30.0% |
25.8 |
18.0 |
-30.1% |
12.0 |
12.0 |
0.0% |
Source: Edison Investment Research. Note: 2018 new = actual.
Exhibit 14 details our segmental revenue assumptions for FY19 compared with FY18. We have allowed for an increase in revenue in corporate retainers, reflecting the increase in the number of clients. All other areas are assumed to see a reduction in revenues, particularly in net trading gains that are set closer to the five-year average, resulting in an overall reduction of 6% for the group. Advisory fees are expected to be only marginally lower, buoyed by a focus on expanding the business, including the addition of a debt advisory capability.
Exhibit 14: Analysis of revenue estimate
£000 |
2018 |
2019e |
Change |
Net trading gains |
9,594 |
7,900 |
-18% |
Institutional commissions |
37,866 |
35,800 |
-5% |
Equities |
47,460 |
43,700 |
-8% |
Corporate retainers |
12,430 |
13,000 |
5% |
Advisory fees |
17,335 |
17,200 |
-1% |
Placing commissions / capital markets |
58,822 |
51,000 |
-13% |
Corporate broking and advisory |
88,587 |
81,200 |
-8% |
Total revenue |
136,047 |
124,900 |
-8% |
Source: Edison Investment Research
As noted earlier, the balance sheet remains strong with net cash of £111.7m, an increase of £15.8m during the year partly arising from the realisation of the investment in the Numis Mid Cap fund. Including this realisation (£12.5m), overall cash generated from operations amounted to nearly £46m and principal uses of cash were share buybacks (£16.3m) and dividend payments (£12.8m). Shareholders’ funds were £143m and, less the final dividend declared (£6.9m), qualifying capital is £136m which Numis reports is more than twice the regulatory requirement leaving a surplus in excess of £68m. The headroom in terms of capital and liquidity provides a valuable cushion in varying market conditions and is helpful in supporting market making, facilitating client trading and securing some equity capital markets transactions.
Valuation
We start with our comparative valuation table which includes UK brokers together with a selection of US and European investment banks and advisory firms. The absence of published estimates for some other UK brokers explains the gaps in current year P/Es in the comparison. While the businesses have different profiles they do constitute a broadly related peer group. In terms of P/Es (calculated on last reported earnings), the Numis multiple is slightly below the average across the whole list (11.9x), while its above-average current year P/E should probably be seen in the context of the estimate reduction we have put in place and the potential for other estimates to be adjusted in due course as companies provide their next trading updates. Numis trades on an above-average price to book ratio but this is supported by the above-average historical return on equity.
Exhibit 15: Peer comparison
Price |
Market cap |
Last reported |
Current P/E |
Yield |
ROE |
Price to book |
|
UK brokers |
|||||||
Numis |
255 |
274 |
11.1 |
15.2 |
4.7 |
19.3 |
1.9 |
Arden |
27 |
8 |
Loss |
N/A |
0.0 |
N/A |
0.9 |
Cenkos |
70 |
38 |
5.3 |
N/A |
5.8 |
25.3 |
1.4 |
Shore Capital |
205 |
44 |
16.0 |
17.9 |
4.9 |
4.8 |
0.8 |
WH Ireland |
65 |
21 |
Loss |
N/A |
0.0 |
N/A |
1.8 |
UK brokers average |
10.8 |
16.5 |
3.1 |
16.5 |
1.4 |
||
US, European IB and advisory |
|||||||
Bank of America |
25.8 |
252,814 |
13.9 |
10.1 |
1.5 |
7.9 |
1.1 |
Evercore |
79.1 |
3,755 |
14.5 |
10.9 |
1.8 |
51.6 |
5.7 |
Goldman Sachs |
176.5 |
65,642 |
8.9 |
7.1 |
1.6 |
11.1 |
0.8 |
Greenhill |
26.7 |
548 |
N/A |
N/A |
5.2 |
-4.5 |
3.5 |
JP Morgan |
100.4 |
333,871 |
14.4 |
10.9 |
2.0 |
9.9 |
1.3 |
Moelis |
37.1 |
2,086 |
16.2 |
12.7 |
4.0 |
54.2 |
3.8 |
Morgan Stanley |
41.7 |
71,799 |
11.6 |
8.6 |
2.2 |
9.4 |
1.1 |
Stifel Financial |
45.0 |
3,243 |
11.3 |
8.7 |
0.4 |
11.9 |
1.1 |
Credit Suisse |
11.6 |
29,547 |
13.6 |
11.4 |
2.2 |
4.3 |
0.7 |
Deutsche Bank |
7.5 |
15,459 |
8.0 |
20.5 |
1.5 |
2.9 |
0.2 |
UBS |
12.9 |
49,661 |
9.4 |
9.4 |
5.0 |
10.0 |
0.9 |
US, European IB and advisory average |
12.2 |
11.0 |
2.5 |
15.3 |
1.8 |
||
Source: Thomson Reuters. Note: Priced at 10 January 2019, P/Es are for financial years therefore not all same period end.
Exhibit 16 shows the history of the price to book ratio over the last five years showing how the recent price correction has pulled the ratio below its five-year average (2.4x). If we extend the period to 10 years, including the impact from the financial crisis, when Numis traded close to book value, the average value falls to 1.9x: still in line with rather than below the current value.
|
Exhibit 16: Five-year history of the price to book value ratio for Numis |
|
|
Source: Thomson Datastream, Edison Investment Research |
As previously, we have used a ROE/COE valuation model to infer the ROE assumption required to match the 255p share price at time of writing: this gives a value of 15.4% (based on the FY18 NAV of 135p and assuming a cost of equity of 10% and growth of 4%). Our current forecast indicates an ROE of 14% for FY19 but on a medium-term view, with a return to more favourable market conditions and as benefits from the investment in staff flow through, a return in line with or above the five-year historical average of 20% appears well within reach. The sensitivity of the valuation to changing growth and ROE assumptions is illustrated in Exhibit 17.
Exhibit 17: ROE/COE valuation output variations (value per share, p)
Growth rate (right) |
2.0% |
3.0% |
4.0% |
5.0% |
6.0% |
10% |
135 |
135 |
135 |
135 |
135 |
12% |
169 |
174 |
180 |
189 |
203 |
15% |
219 |
231 |
248 |
270 |
304 |
18% |
270 |
289 |
315 |
351 |
405 |
20% |
304 |
328 |
360 |
405 |
473 |
Source: Edison Investment Research
Finally, for reference we have included a table summarising the recent share price performance of the peer group stocks. While there is divergence between the individual stocks, all have experienced negative movements over three months and one year and all have seen significant reductions from their 12-month highs, reflecting the more recent increase in market volatility. On average the UK stocks have been weaker than the US and European investment banks and advisory firms. Numis shares have generally performed in line with or modestly better than its UK peers.
Exhibit 18: Recent share price performance comparison
One month |
Three months |
One year |
YTD |
From 12m high |
|
UK brokers |
|||||
Numis |
-2.3 |
-17.5 |
-22.7 |
6.5 |
-43.2 |
Arden Partners |
-11.5 |
-19.4 |
-49.5 |
-5.3 |
-51.5 |
Cenkos |
11.2 |
-11.5 |
-40.1 |
-3.5 |
-43.2 |
Shore Capital |
-9.7 |
-21.2 |
-1.4 |
-4.7 |
-32.8 |
WH Ireland |
9.2 |
-30.9 |
-49.0 |
-3.7 |
-58.3 |
UK brokers average |
-0.6 |
-20.1 |
-32.6 |
-2.1 |
-45.8 |
US, European IB and advisory |
|||||
Bank of America |
1.3 |
-14.1 |
-14.9 |
4.5 |
-22.1 |
Evercore |
3.0 |
-15.8 |
-16.0 |
10.6 |
-32.6 |
Goldman Sachs |
-1.8 |
-20.8 |
-30.5 |
5.6 |
-35.9 |
Greenhill |
7.0 |
-4.3 |
39.9 |
9.5 |
-20.1 |
JP Morgan |
-2.8 |
-12.3 |
-7.9 |
2.8 |
-15.9 |
Moelis |
-4.1 |
-30.5 |
-20.8 |
7.9 |
-43.8 |
Morgan Stanley |
1.0 |
-9.6 |
-21.7 |
5.3 |
-29.7 |
Stifel Financial |
-0.7 |
-12.1 |
-31.1 |
8.7 |
-34.5 |
Credit Suisse |
6.9 |
-16.5 |
-35.2 |
7.0 |
-38.5 |
Deutsche Bank |
2.8 |
-21.9 |
-51.9 |
7.4 |
-53.9 |
UBS |
5.9 |
-12.1 |
-30.7 |
5.3 |
-34.8 |
US, European IB and advisory average |
1.7 |
-15.5 |
-20.1 |
6.8 |
-32.9 |
Source: Thomson Reuters, Edison Investment Research. Note: Priced at 10 January 2019.
Exhibit 19: Financial summary
£'000s |
2015 |
2016 |
2017 |
2018 |
2019e |
||
Year end 30 September |
|||||||
PROFIT & LOSS |
|||||||
Revenue |
|
|
97,985 |
112,335 |
130,095 |
136,047 |
124,900 |
Administrative expenses (excl. amortisation and depreciation) |
(65,018) |
(76,120) |
(83,626) |
(94,603) |
(88,338) |
||
Share based payment |
(4,104) |
(6,229) |
(10,454) |
(10,583) |
(10,600) |
||
EBITDA |
|
|
28,863 |
29,986 |
36,015 |
30,861 |
25,962 |
Depreciation |
|
|
(882) |
(1,126) |
(1,226) |
(1,113) |
(1,200) |
Amortisation |
(111) |
(125) |
(89) |
(49) |
(50) |
||
Operating Profit (before amort. and except). |
|
|
27,870 |
28,735 |
34,700 |
29,699 |
24,712 |
Net finance income |
190 |
37 |
188 |
212 |
210 |
||
Other operating income |
(1,978) |
3,759 |
3,431 |
1,733 |
500 |
||
Profit before tax |
|
|
26,082 |
32,531 |
38,319 |
31,644 |
25,422 |
Tax |
(4,533) |
(6,132) |
(7,942) |
(4,967) |
(4,864) |
||
Profit after tax (FRS 3) |
|
|
21,549 |
26,399 |
30,377 |
26,677 |
20,558 |
Average diluted number of shares outstanding (m) |
117.6 |
118.0 |
117.2 |
115.8 |
114.1 |
||
EPS - basic (p) |
19.5 |
23.5 |
27.4 |
25.1 |
19.6 |
||
EPS - diluted (p) |
|
|
18.3 |
22.4 |
25.9 |
23.0 |
18.0 |
Dividend per share (p) |
11.50 |
12.00 |
12.00 |
12.00 |
12.00 |
||
NAV per share (p) |
102.0 |
113.5 |
125.0 |
135.0 |
138.8 |
||
ROE (%) |
19% |
22% |
23% |
19% |
14% |
||
EBITDA margin (%) |
29.5% |
26.7% |
27.7% |
22.7% |
20.8% |
||
Operating margin (before GW and except.) (%) |
28.4% |
25.6% |
26.7% |
21.8% |
19.8% |
||
BALANCE SHEET |
|||||||
Fixed assets |
|
|
6,724 |
5,522 |
6,147 |
8,215 |
7,565 |
Current assets |
|
|
279,114 |
312,462 |
407,850 |
533,033 |
534,159 |
Total assets |
|
|
285,838 |
317,984 |
413,997 |
541,248 |
541,724 |
Current liabilities |
|
|
(170,319) |
(188,895) |
(280,371) |
(398,112) |
(398,112) |
Long term liabilities |
0 |
(12) |
0 |
0 |
0 |
||
Net assets |
|
|
115,519 |
129,077 |
133,626 |
143,136 |
143,612 |
CASH FLOW |
|||||||
Operating cash flow |
|
|
6,467 |
48,735 |
43,369 |
45,830 |
27,018 |
Net cash from investing activities |
(3,632) |
84 |
(198) |
(1,014) |
(210) |
||
Net cash from (used in) financing |
(17,510) |
(19,580) |
(36,359) |
(29,035) |
(30,682) |
||
Net cash flow |
|
|
(14,675) |
29,239 |
6,812 |
15,781 |
(3,874) |
Opening net (cash)/debt |
|
|
(74,518) |
(59,591) |
(89,002) |
(95,852) |
(111,673) |
FX effect |
|
|
(252) |
172 |
38 |
40 |
0 |
Closing net (cash)/debt |
|
|
(59,591) |
(89,002) |
(95,852) |
(111,673) |
(107,799) |
Source: Company data, Edison Investment Research
|
|||||||||||||||||||||||||||||||||||||||||||||||||
|
|
Research: TMT
Boku has confirmed that total processed value (TPV), monthly active users, revenues and EBITDA saw strong growth in FY18, and it expects to report metrics at least in line with Edison and consensus expectations. This provides support for our FY19/FY20 growth forecasts for the core payments business. The recently acquired Danal business provides a second path to extend Boku’s growth in the longer term, while close co-operation with Danal Korea could open up payment opportunities in Korea.