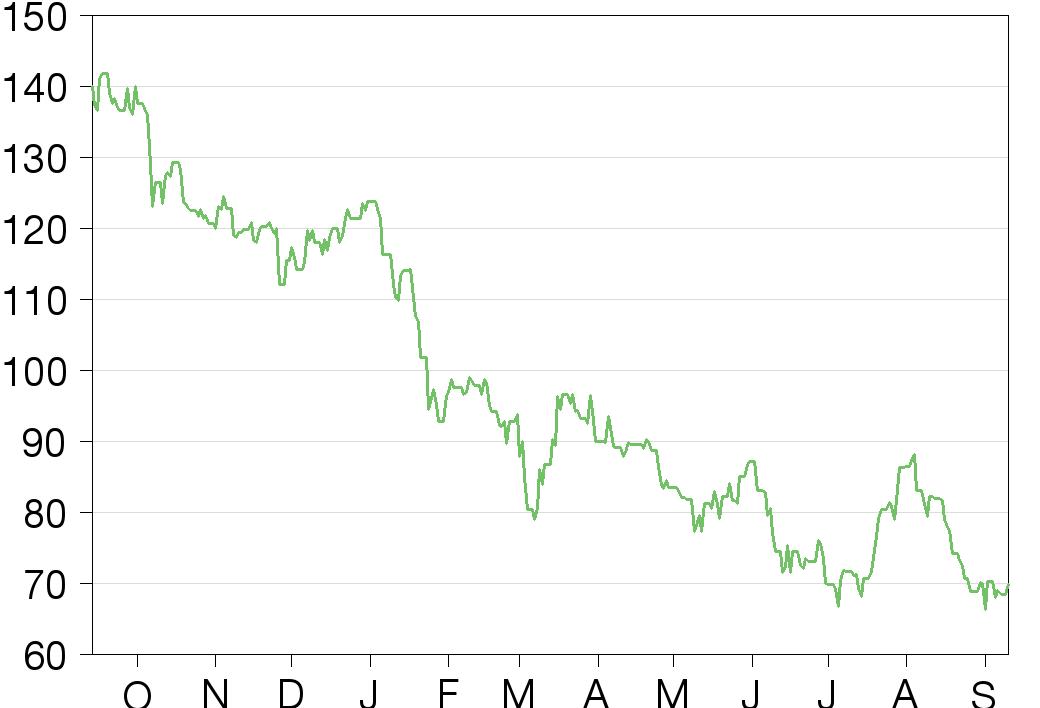
Last close As at 05/08/2026
GBP0.69
▲ 1.40 (2.08%)
Market capitalisation
GBP607m
Research: TMT
IP Group is well-financed and trading at a discount of c 50% to its H122 NAV/share (137p), which we believe represents a compelling opportunity for long-term and impact investors. If management can deliver on targeted average gross returns of 20% for FY22–26 through a renewed focus on its priority companies, we believe IP Group’s discount to NAV would narrow, further lifting average annual NAV/share over this timeframe. IP Group provides liquid exposure to a growing portfolio of high-growth science-based start-ups from its international ecosystem. The company invests primarily in life sciences, deep tech and renewables, and is increasingly focused on companies that will have an impact, to deliver a sustainable, healthier and tech-enriched future. After a 15+ year gestation period, its model appears to have started to mature in FY19, with returns and realisations accelerating (FY19–21 NAV/share growth of 24%).
IP Group |
International investor in impactful innovation |
Initiation of coverage |
Listed venture capital |
12 September 2022 |
Share price performance
Business description
Next events
Analysts
IP Group is a research client of Edison Investment Research Limited |
|||||||||||||||||||||||||||||||||||||||||||||||
IP Group is well-financed and trading at a discount of c 50% to its H122 NAV/share (137p), which we believe represents a compelling opportunity for long-term and impact investors. If management can deliver on targeted average gross returns of 20% for FY22–26 through a renewed focus on its priority companies, we believe IP Group’s discount to NAV would narrow, further lifting average annual NAV/share over this timeframe. IP Group provides liquid exposure to a growing portfolio of high-growth science-based start-ups from its international ecosystem. The company invests primarily in life sciences, deep tech and renewables, and is increasingly focused on companies that will have an impact, to deliver a sustainable, healthier and tech-enriched future. After a 15+ year gestation period, its model appears to have started to mature in FY19, with returns and realisations accelerating (FY19–21 NAV/share growth of 24%).
Period |
Net cash* (£m) |
Portfolio fair value** (£m) |
NAV |
NAV/ |
Price/ |
12/20 |
203.0 |
1,185 |
1,332 |
125.3 |
0.56 |
06/21 |
249.4 |
1,246 |
1,440 |
135.4 |
0.52 |
12/21 |
270.1 |
1,508 |
1,738 |
167.0 |
0.42 |
06/22 |
191.6 |
1,266 |
1,414 |
136.7 |
0.51 |
Note: *Includes restricted cash but not funds held on behalf of EIS/VCT investors. **Portfolio fair value includes US platform and other LP interests.
A mature, scaling science-based model
IP Group has helped build three unicorns to date (Oxford Nanopore, Ceres Power and Hinge Health). Among its focus portfolio, it has a number of priority companies that have the potential to achieve unicorn status (US$1bn+). Management’s ambition is to support another five businesses to values in excess of US$1bn and at least one worth more than US$10bn within the next five years.
Well-funded, B2B portfolio with long-term potential
Management recognises that realisations will be slower in the current market environment. However, critically, IP Group remains well funded, with £236m of gross cash and deposits at 30 June 2022, supplemented by £105m of additional liquidity post period end from a private debt placement. This provides comfort that the group can support key investee companies, take advantage of the downcycle for new investments and crucially will not have to sell assets at depressed prices. As well as providing market insight and cementing its relationship with university partners, Parkwalk Advisors, its wholly owned fund management business, delivers regular fee income that meaningfully defrays the group’s operating costs.
Valuation: Targeting a 20%+ five-year CAGR
IP Group has delivered a gross IRR over its 20-year life to FY21 of over 14%, with a more recent two-year NAV per share CAGR of 24% FY19–21. Management aims for venture returns and as such is targeting 20% on average over the next five years to FY26 as the group accelerates its portfolio of priority companies, a number of which are close to value inflection points. IP Group is well-financed and currently trading at a c 50% discount to its latest H122 NAV (137p), and we believe this represents a compelling opportunity for long-term and impact investors.
Investment summary
Investing for impact as well as financial return
IP Group creates businesses predominantly based on research from universities, research centres and other networks, helping to create, build and support IP-based companies. Since it was launched in the UK, IP Group’s model has evolved to become international, with investment platforms in Australia, New Zealand, the United States and China, with a particular focus on investment in impact and innovation. IP Group invests thematically, primarily in the life sciences, deep tech and renewable sectors, but is increasingly focused on companies with products and services that meaningfully contribute to a sustainable, healthier and tech-enriched future.
|
Exhibit 1: Portfolio by segment (H122) |
Exhibit 2: Breakdown of H122 NAV |
|
|
|
Source: IP Group |
Source: IP Group |
|
Exhibit 1: Portfolio by segment (H122) |
|
|
Source: IP Group |
|
Exhibit 2: Breakdown of H122 NAV |
|
|
Source: IP Group |
Value proposition: A scaling, self-financing business model
IP Group offers liquid public market exposure to impactful private technology and life sciences companies from across the English-speaking world. Its university and investment networks are international, with a deep thematic focus on building market-leading global companies, with the potential to scale above US$1bn in value. The group’s permanent balance sheet capital provides the flexibility to build companies from inception to scale that a traditional fixed fund life GP/LP structure typically lacks, whilst allowing the group to retain influential shareholdings. IP Group has refocused its capital allocation policy to drive returns from its priority companies. The group has delivered a gross internal rate of return (IRR) of 14% since its inception in 2001 to FY21, with management targeting an average gross annual return of 20% over the next five years.
Financials: Mature portfolio gives confidence in the outlook
Having taken 15 years to reach maturity, since FY19 IP Group has shown a growing track record of successful exits, having deployed a total of £291m of capital and realised £486m of investments. The group remains well-capitalised, with gross cash falling to £236m at 30 June 2022 (subsequently supplemented by the £105m debt placing) after £52m of capital was deployed in H122. Realisations in FY21 included Oxford Nanopore (initial public offering (IPO)), Inivata, Wave Optics, Hinge Health and Inflowmatix. In H122, despite the increase in the value of First Light Fusion, NAV per share fell by 18% from 167p at 31 December 2021 to 137p at 30 June 2022, largely due to the impact of Oxford Nanopore, whose share price fell from 697p at 31 December 2021 to 276p at 30 June 2022.
Sensitivities: Realisations required for re-investment
As a people-based business, IP Group remains reliant on its senior leadership team (the majority of whom have been with IP Group for over 10 years), its university, research centre and related networks of relationships, as well as its broader team’s market reputation to identify valuable intellectual property (IP) and support the best entrepreneurs to build the next generation of market-leading companies. With a mature portfolio, the company relies on regular realisations to support reinvestment. Realisations are subject to market cycles, the valuations of quoted peers and investor appetite to continue to invest in science-based companies at IPO or by way of a trade sale.
Valuation: Attractive returns with long-term impact
IP Group offers a mature portfolio of late-stage investments and a track record of realisations that has delivered 24% FY19–21 NAV/share growth, as well as a growing third-party fund management business. The current c 50% discount to NAV suggests that investors are still looking backwards to the group’s longer-term track record before the portfolio matured, which has been solid but not spectacular. As the share price recovers, underpinned by a strong investment performance, we would expect this discount to narrow, further lifting investment returns. In the current environment, the group’s strong balance sheet, its mature portfolio of resilient IP-based B2B companies and clear focus on impact investment provides a differentiated proposition. and represents a compelling opportunity for long-term and impact investors. By our calculation, the market is pricing IP Group’s portfolio (ex ONT) at c 29p per share, a 70% discount to its current carrying value.
Company overview
History
IP Group’s story began with the signing of a 15-year exclusive agreement between IP2IPO Limited (now a subsidiary of IP Group) and the University of Oxford’s Department of Chemistry in December 2000.
IP Group itself was formed in April 2001 as a subsidiary of UK investment bank Beeson Gregory, with the first spin-outs from Oxford University in 2001. The group listed on AIM in October 2003 and moved to the Official List in June 2006 and is now a constituent of the FTSE 250. IP Group has also completed a number of acquisitions, including Techtran in 2005 (securing rights to University of Leeds IP), Fusion IP in 2014 (broadening the group’s portfolio and securing IP rights from four partner universities) and Parkwalk Advisors (strengthening the group’s third-party fund management offering) and Touchstone Innovations in 2017 (broadening IP Group’s portfolio and securing the rights to Imperial College IP). IP Group employed 104 people on average in FY21.
A more detailed history of the group’s major milestones can be found on IP Group’s website.
Business description
IP Group is an investment company initially founded to commercialise ideas from UK universities into businesses, by helping to create, build and support IP-based companies. Early-stage IP-based companies have typically taken 10–15 years to commercialise and mature, so that, despite the age of the business, the maturity of the portfolio has only shown through over the last few years.
Historically, IP Group had exclusive rights to IP spin-outs from 14 UK universities, but those rights have now largely expired (Parkwalk Advisors retains exclusive relationships with Oxford, Cambridge, Bristol and Imperial for their alumni funds). However, the duration and depth of the group’s relationships mean that it remains well-placed to secure preferential rights even without contractual exclusivity. IP Group typically makes five to fifteen new investments each year (FY21: 8, H122: 7).
Since launch, IP Group’s model has evolved to become international, with investment platforms based on university ecosystems in Australia, New Zealand, the United States as well as a China-based fund soon to be launched, with a particular focus on investment in impact and innovation. IP Group invests thematically, primarily in the life sciences, deep tech and renewable sectors but is increasingly focused on companies with products and services that meaningfully contribute to a sustainable, healthier and tech-enriched future.
NAV/share on a sustainably improving path
IP Group acquired Touchstone Innovations in 2017 in a share for share merger, whereby Touchstone shareholders received c 34% of the enlarged group, valuing the acquisition at £500.5m. Certain portfolio company valuations were subsequently written down. However, as at FY21 year end, investments that came through Touchstone represented 50% of the group’s top 20 investments, though only one of IP Group’s top five holdings (Featurespace).
As can be seen in Exhibit 3, IP Group’s five-year NAV per share track record was disrupted by asset write-downs following the Touchstone acquisition and related £207m placing, contributing to falls in NAV per share in each of 2018 (8% fall) and 2019 (6% fall). NAV/share has subsequently resumed growth in FY20 and FY21, with average growth for FY19–21 of 24%. Reflecting market falls in H122, particularly affecting the value of Oxford Nanopore, the latest H122 NAV/share of 137p represents an 18% reduction from the FY21 year-end figure of 167p.
|
Exhibit 3: IP Group’s improving NAV/share track record |
|
|
Source: IP Group, Edison Investment Research |
Oxford Nanopore, IP Group’s principal holding
The most important event for IP Group in 2021 was the IPO of Oxford Nanopore. IP Group was a founding shareholder of Oxford Nanopore in 2005 and held a 14.4% stake in the company in the run up to its IPO, with a carrying value of £359m as at 30 June 2021, ahead of the flotation. Oracle Corporation became a cornerstone investor for the IPO, committing £150m, with the IPO successfully launched on 30 September 2021 at 425p per share (a market cap of £3.5bn). IP Group realised £84m through selling down shares at IPO, but retained 82m shares or 10% of the company. The shares traded up to 613p (£5.05bn) on the first day of trading and were valued at 698p (£572m) as at 31 December 2021), but since then have fallen back, and currently trade at 287p (£2.37bn), over 30% below the IPO price. As at 30 June 2022, IP Group’s holding in Oxford Nanopore was valued at £226m, or 22p per share, representing 17% of NAV, down from 33% at 31 December 2021.
Strategy: Impact, focus and concentration of resource
Greg Smith was appointed CEO in FY21, taking over from Alan Aubrey. Greg had previously been group CFO for 10 years, with shareholders supporting an evolutionary rather than a revolutionary strategy for the next phase of IP Group’s growth.
The group’s emerging strategy is very much to continue what it does well, investing in early-stage science-based businesses out of ecosystems based around university, research centre and other networks, but also to refocus on impact. Impact has always been at the heart of IP Group’s model, but this is now set out more clearly with the group’s evolving purpose to contribute to a better future through the impact of science and technology-based businesses.
To support these goals, on 22 June 2022, IP Group announced that it had rebranded its cleantech business as Kiko Ventures. IP Group plans to invest approximately £200m through the Kiko Ventures platform over the next five years, into both new and existing cleantech companies.
The group is increasingly focusing on its priority list, which it believes it can build into companies worth more than US$1bn within the next three to five years. Management has identified a number of these investee companies, in addition to the three unicorns already created (Oxford Nanopore, Ceres Power and Hinge Health) and its ambition is to grow and support another five businesses to values in excess of US$1bn, with at least one worth more than US$10bn within the next five years, through the increased allocation of resources and capital to these opportunities to accelerate their development.
Management believes that this change of strategy will help IP Group deliver gross returns of more than 20% over the next five years as its priority companies accelerate.
Investment portfolio
IP Group has invested in c 400 companies over its lifetime. Following exits and attrition, the UK portfolio includes 164 companies (including its ‘de minimis’ holdings), together with 14 holdings through its Australia and New Zealand platform. The 29 companies in its US portfolio are no longer included in IP Group’s reporting, having been deconsolidated in the FY21 accounts.
IP Group sub-divides its portfolio based on size of holding (as at 30 June 2022):
■
Top 20 – IP Group’s 20 largest holdings, with an average holding size of £43m (£33m ex ONT).
■
Focus – investments not within the 20 most valuable companies, but on which the investment teams focus a significant proportion of their resource and capital. Included 32 companies with an average holding size of £6.3m.
■
Other – a broad selection of early-stage companies that includes recent seed investments that typically receive a lower level of capital. Includes 51 companies with an average holding size of £3.2m.
■
Organic and de minimis – companies at a very early stage, or in which the group’s holding is of minimal value that take up little management time. Organic holdings are investments in which the group has acquired a shareholding due to the technology transfer relationship with Imperial College (now expired), but in which IP Group has not actively invested. Includes c 70 companies with an average holding size of £0.2m.
|
Exhibit 4: Portfolio by segment (H122) |
Exhibit 5: Portfolio by sector (H122) |
|
|
|
Source: IP Group, Edison Investment Research |
|
Exhibit 4: Portfolio by segment (H122) |
|
|
Source: IP Group, Edison Investment Research |
|
Exhibit 5: Portfolio by sector (H122) |
|
|
Source: IP Group, Edison Investment Research |
Management has also recently identified a subset of investments considered priority holdings:
■
Priority investments – companies that can potentially achieve a valuation of over US$1bn within the next three to five years. Leading and priority companies include Istesso, First Light Fusion, Featurespace, Garrison Technology, Pulmocide, Hysata, Genomics and Oxbotica, in addition to the three unicorns already created (ONT, Hinge Health and Ceres Power). Management plans to allocate additional resources and capital to these opportunities to accelerate their development over the next few years.
We provide a breakdown of IP Group’s portfolio in Exhibit 6. As well as direct equity investments, the total portfolio includes direct debt investments and includes IP Group’s interests in its limited partnership (LP) funds, most significantly the US platform.
Exhibit 6: IP Group’s core portfolio (as at 30 June 2022)
Company name |
Primary valuation basis |
Fair value of holding |
Holding as % of NAV |
Cumulative share of NAV |
|
£m |
% |
% |
|||
1 |
Oxford Nanopore |
Quoted (bid price) |
226.5 |
16% |
16% |
2 |
First Light Fusion |
*Adjusted funding |
114.5 |
8% |
24% |
3 |
Istesso |
DCF |
95.6 |
7% |
31% |
4 |
Featurespace |
*Revenue multiple |
65.0 |
5% |
35% |
5 |
Hinge Health |
*Adjusted funding |
64.3 |
5% |
40% |
6 |
Ultraleap |
*Adjusted funding |
32.1 |
2% |
42% |
7 |
Garrison Technology |
Revenue multiple |
25.7 |
2% |
44% |
8 |
Ieso Digital Health |
Recent financing (< 12m) |
21.8 |
2% |
46% |
9 |
Bramble Energy |
Recent financing (< 12m) |
20.7 |
1% |
47% |
10 |
Oxford Science Enterprises |
Future market/commercial events |
20.6 |
1% |
49% |
11 |
Salt Pay |
*Adjusted funding |
20.5 |
1% |
50% |
12 |
Nexeon |
Recent financing (< 12m) |
19.8 |
1% |
51% |
13 |
Crescendo Biologics |
Recent financing (< 12m) |
18.7 |
1% |
53% |
14 |
Artios Pharma |
Recent financing (< 12m) |
18.2 |
1% |
54% |
15 |
Mission Therapeutics |
Recent financing (> 12m) |
18.1 |
1% |
55% |
16 |
Oxbotica |
Recent financing (> 12m) |
16.3 |
1% |
56% |
17 |
Microbiotica |
Recent financing (< 12m) |
16.1 |
1% |
58% |
18 |
PsiOxus Therapeutics |
*Adjusted funding |
15.5 |
1% |
59% |
19 |
Oxular |
Recent financing (> 12m) |
14.7 |
1% |
60% |
20 |
Hysata |
Future market/commercial events |
13.3 |
1% |
61% |
Top 20 |
|
858.0 |
61% |
||
Focus portfolio |
|
201.3 |
14% |
75% |
|
Other companies |
|
161.0 |
11% |
86% |
|
De minimis and organic investments |
|
16.2 |
1% |
87% |
|
Gross portfolio |
|
1,265.5 |
|||
Net assets |
|
1,414.0 |
|||
NAV per share (pence) |
|
136.7 |
Source: IP Group accounts, Edison Investment Research. Note: *Adjusted funding reflects market-derived valuations adjusted to reflect considerations including technical, financial, market and sales measures; discounted cash flows; and price-earnings multiples.
|
Exhibit 7: Top 10 holdings after ONT (% of H122 NAV) |
|
|
Source: IP Group, Edison Investment Research |
Together the top 20 holdings represent 61% of H122 net assets, and including the focus portfolio (top 52) represent 75% of H122 NAV. As mentioned earlier, by virtue of its long-term investment model where start-ups take a number of years to mature and achieve commerciality, IP Group retains a long tail of smaller holdings, but in general IP Group management spends limited time on these smaller holdings, concentrating on the focus portfolio and other priority assets.
Track record on an improving trend as portfolio has matured
The impact of the Touchstone acquisition can be seen in FY17, with NAV rising 88% to £1.33bn, but NAV per share holding steady at 125p. The impact of the acquisition continued to be felt in FY18 and FY19, with portfolio fair value and NAV falling over those two years as IP Group integrated the two portfolios and revalued certain investments. FY19 was the year that IP Group’s portfolio reached maturity, the first year when realisations exceeded investment, with net realisations of just over 1% of initial portfolio fair value. This trend has continued into FY20 and FY21, with net realisations of 12% and 9%, respectively, contributing to gross portfolio returns of 25% and 36%.
Exhibit 8: Key performance indicators
31/12/2017 |
31/12/2018 |
31/12/2019 |
31/12/2020 |
31/12/2021 |
30/06/2022 |
||
FY17 |
FY18 |
FY19 |
FY20 |
FY21 |
H122 |
||
Portfolio fair value |
£m |
1130.6 |
1128.2 |
1045.6 |
1184.9 |
1507.5 |
1265.5 |
Change y-o-y |
84% |
0% |
(7)% |
13% |
27% |
(34)% |
|
Realisations |
£m |
6.6 |
29.5 |
79.5 |
191.0 |
213.4 |
2.1 |
Realisations/PFV |
1% |
3% |
7% |
18% |
18% |
0% |
|
Investments |
£m |
71.2 |
100.9 |
64.7 |
67.5 |
103.7 |
52.0 |
Net realisations/PFV |
(11)% |
(6)% |
1% |
12% |
9% |
(2)% |
|
Gross portfolio return |
74% |
(7)% |
(6)% |
25.1% |
36.5% |
(41.8)% |
|
Net cash |
£m |
222.3 |
121.2 |
112.4 |
203.0 |
270.1 |
191.6 |
NAV |
£m |
1326.2 |
1217.5 |
1141.5 |
1331.5 |
1738.1 |
1414.0 |
Change y-o-y |
88% |
(8)% |
(6)% |
17% |
31% |
(2)% |
|
NAV per share |
p |
125.3 |
115.0 |
107.8 |
125.3 |
167.0 |
136.7 |
Change y-o-y |
0% |
(8)% |
(6)% |
16% |
33% |
1% |
Source: IP Group accounts, Edison Investment Research
IP Group has delivered a gross IRR over its 20-year life to FY21 of over 14% and a five-year NAV CAGR FY16–21 of 20%, but a corresponding five-year NAV per share CAGR of only 6%, with the difference principally reflecting the share dilution from the Touchstone acquisition. More recently, the group has recorded a two-year NAV per share CAGR of 24% FY19–21, closely in line with NAV growth of 23% over the period.
|
Exhibit 9: IP Group offers an improving NAV per share track record |
|
|
Source: Edison Investment Research |
Investment strategy
Deal identification
IP Group builds deal flow through its network of relationships, its broader ecosystem and through the team’s reputation in the market. Its team of specialists has the experience and sector knowledge to dig deep in its due diligence to help identify good investments from attractive marketing. IP Group will only invest where it feels it has a competitive edge (such as strong relationships, better understanding of the science) and where management can leverage its broader ecosystem to add value to the potential investee company.
Large initial stakes diluted through multiple funding rounds
IP Group invests in the very earliest stage of spin-outs from universities, research centres and related networks, with a low level of initial investment, usually only a few hundred thousand pounds, often alongside university funds. From there, IP Group nurtures and supports the investment to refine the proposition and build a team to exploit the IP.
In very general terms, IP Group takes a large initial stake of up to 50% of the equity at the outset, with IP Group’s shareholding then steadily falling through subsequent funding rounds. IP Group is the largest shareholder in many of its companies, including Oxford Nanopore (10.0%), Featurespace (19.5%), Istesso (56.5%) and First Light Fusion (27.5%), with levels of dilution increasing as the company raises progressively larger rounds.
IP Group has typically committed up to £1–3m to an individual funding round. However, by exception the group has significantly exceeded this level, with investments into Oxford Nanopore of £18.7m in 2021 and £14m in 2016 as part of larger funding rounds. More recently, with the focus on its priority list, IP Group is concentrating its capital commitments and has invested £10m into Istesso and £9.5m into Bramble in H122. We expect this trend of larger commitments to priority assets to continue.
Over multiple rounds, IP Group’s commitments to an individual company can add up to over £20m (eg Featurespace, Ieso, Autifony, Diurnal, PsiOxus and Athenex). IP Group also provided almost £50m to Oxford Science Enterprises which it co-founded by way of a plc-level fund-raising (much of this investment has now been realised) and the group’s commitment to Oxford Nanopore reached over £74m in total, with realisations to date totalling £106m.
Capital allocation policy to accelerate priority plays
The group’s purpose is to generate capital appreciation in a liquid, quoted vehicle with dividends as a small but growing component of total shareholder returns. Management reserves a minority proportion of any cash realisation to supplement returns to shareholders through the most appropriate mechanism, including share buybacks. We estimate that total returns, including dividends, will represent approximately 20% of exits in a given year.
The group is primarily equity funded but also uses debt. In parallel with its H122 results, the group announced that it had agreed to issue £120m of long-dated private loan notes to London-based institutional investors at an average fixed rate of 5.25%. The loan notes will be used to repay £15m of the shorter-dated of the group’s European Investment Bank (EIB) debt, providing the group with additional liquidity of £105m and additional flexibility to manage the timing of realisations and exits. Management has stated that the group is unlikely ever to exceed 10% of gross assets (H122: £1.6bn) in debt.
IP Group’s capital allocation policy is intended to ensure that it allocates appropriate resources to its most promising investments, including its priority companies (those with the potential to become unicorns), which the group hopes to accelerate over the next three to five years, as well as its most disruptive start-ups.
Alongside attractive financial returns, IP Group also aims to provide impact. In this context, impact means investment in companies with products and services that meaningfully contribute to a sustainable, healthier and tech-enriched future.
Leveraging the portfolio with third-party capital
Over the four years to 31 December 2021, IP Group committed £340m of capital to its portfolio companies, with funds managed by Parkwalk Advisors committing a further £40m – a total of £380m. Over this same period, IP Group’s portfolio raised over £4.6bn in capital, meaning that IP Group (including Parkwalk) committed only approximately 8% of overall capital, although this percentage is far higher for smaller, earlier-stage portfolio companies.
|
Exhibit 10: IP Group leverages significant third-party capital to support its portfolio |
|
|
Source: IP Group, Edison Investment Research |
As can be seen in Exhibit 10, as the total capital raised annually has increased, IP Group’s proportion of overall investment has fallen from 17% in 2018 to 4% in 2021. The majority of this additional capital has come from strategic investors, EIS investors, universities and institutional investors.
IP Group’s ability to leverage third-party capital from its partners, co-investors and investor network to support its portfolio is a major strength of its model and a factor that undoubtedly attracts companies to IP Group.
Competitive and co-investment landscape
As an early-stage investor, IP Group competes with a variety of other investors, ranging from local angel investors, seed funds, venture capital firms as well as special purpose permanent capital vehicles, including Oxford Science Enterprises (OSE) and Cambridge Innovation Capital (CIC), both of which it co-founded and in which it now holds minority stakes. Rather than competition, more accurately the relationship might be described as ‘co-opetition’, with funds often collaborating to co-invest in specific opportunities. As such, the list of co-investors in IP Group’s portfolio (Exhibit 11) includes many of the group’s closest competitors.
In the UK, as well as OSE and CIC, which both focus on a single university ecosystem, the closest businesses to IP Group might be Mercia Asset Management (MAM.L), a broad-based investor focused on UK regional investment (although of a smaller scale than IP Group), and Northern Gritstone, a private fund launched last year to provide a similar role to IP Group, but specifically working with universities in the Midlands and the north of England. We also understand that a similar fund based around the University of Birmingham may be in the offing.
IP Group’s scale and international footprint differentiate it as an early-stage investor, combining the expertise to identify promising IP, the support to develop that IP into a business and the funding and experience to develop that start-up into a market-leading commercial enterprise.
Exhibit 11: Named co-investors in IP Group’s top 20 portfolio holdings (H122)
Holding name |
Investors include |
Oxford Nanopore |
LSE quoted |
First Light Fusion |
OSE, Hostplus, Tencent, Braavos |
Istesso |
Puhua Capital |
Featurespace |
Highland Europe, Insight, Invoke, MissionOG, TTV Capital, Robert Sansom, Merian Chrysalis |
Hinge Health |
Atomico Advisors, Bessemer, Coatue, Insight, Lead Edge, Tiger Global |
Ultraleap |
Cornes, Dolby Ventures, Hostplus, Mayfair Partners |
Garrison Technology |
BGF, Dawn Capital, NM Capital |
Ieso Digital Health |
Morningside, Molten Ventures |
Bramble Energy |
Hydrogen One Capital, BGF Investments, Parkwalk Advisors |
Oxford Science Enterprises |
Blue Pool, Fosun Pharma, Invesco, Lansdowne, Redmile, Sequoia, Temasek, Tencent |
Salt Pay |
Scottish Mortgage, Tiger Global, Social Capital, Hedosophia |
Nexeon |
Invesco, Nortrust, SKC, Wacker Chemie |
Crescendo Biologics |
Sofinnova Capital, BioDiscovery 5, Millennium Pharmaceuticals, Quan Venture Funds |
Artios Pharma |
Arix Bioscience, BioDiscovery 5, SV Life, Sciences, Pfizer, Merck Ventures |
Mission Therapeutics |
Pfizer, Roche, Sofinnova Partners, SR one |
Oxbotica |
Fundamental Insurance Investments, BT Technology Ventures, BGF, bp venture, Ocado |
Microbiotica |
Tencent, Fleurie Invest, British Patient Capital, Cambridge Innovation Capital |
PsiOxus Therapeutics |
SR One, Lundbeckfond Ventures, Invesco, Sedgwick Yard |
Oxular |
Forbion, NeoMed, V-Bio Ventures |
Hysata |
Clean Energy Finance Corporation |
Holding name |
Oxford Nanopore |
First Light Fusion |
Istesso |
Featurespace |
Hinge Health |
Ultraleap |
Garrison Technology |
Ieso Digital Health |
Bramble Energy |
Oxford Science Enterprises |
Salt Pay |
Nexeon |
Crescendo Biologics |
Artios Pharma |
Mission Therapeutics |
Oxbotica |
Microbiotica |
PsiOxus Therapeutics |
Oxular |
Hysata |
Investors include |
LSE quoted |
OSE, Hostplus, Tencent, Braavos |
Puhua Capital |
Highland Europe, Insight, Invoke, MissionOG, TTV Capital, Robert Sansom, Merian Chrysalis |
Atomico Advisors, Bessemer, Coatue, Insight, Lead Edge, Tiger Global |
Cornes, Dolby Ventures, Hostplus, Mayfair Partners |
BGF, Dawn Capital, NM Capital |
Morningside, Molten Ventures |
Hydrogen One Capital, BGF Investments, Parkwalk Advisors |
Blue Pool, Fosun Pharma, Invesco, Lansdowne, Redmile, Sequoia, Temasek, Tencent |
Scottish Mortgage, Tiger Global, Social Capital, Hedosophia |
Invesco, Nortrust, SKC, Wacker Chemie |
Sofinnova Capital, BioDiscovery 5, Millennium Pharmaceuticals, Quan Venture Funds |
Arix Bioscience, BioDiscovery 5, SV Life, Sciences, Pfizer, Merck Ventures |
Pfizer, Roche, Sofinnova Partners, SR one |
Fundamental Insurance Investments, BT Technology Ventures, BGF, bp venture, Ocado |
Tencent, Fleurie Invest, British Patient Capital, Cambridge Innovation Capital |
SR One, Lundbeckfond Ventures, Invesco, Sedgwick Yard |
Forbion, NeoMed, V-Bio Ventures |
Clean Energy Finance Corporation |
Source: IP Group
Valuation methodology
IP Group follows the International Private Equity and Venture Capital Valuation (IPEV) Guidelines, which set out best practice where private investments are reported at ‘fair value’. Its conclusions are then independently reviewed by its auditor, KPMG, with details of the review process set out on page 151 of IP Group’s FY21 report and accounts.
Management seeks to use observable market data as the primary basis for determining fair value, where appropriate. Other valuation methods include market-derived valuations adjusted to reflect considerations including technical, financial, market and sales measures; discounted cash flows; and price-earnings multiples. Management also uses third-party independent valuation specialists as part of the valuation process, which provide a broader market perspective and independent challenge to support carrying values.
Typically, where a funding round has been completed in the last 12 months, management uses this as the carrying value, but where there has been third-party funding invested and a material change of circumstances, or the last funding round is more than 12 months old, management applies a multiples-based valuation. Updating the valuation from the basis of historical funding rounds offers a more up-to-date view of fair value, but still leaves NAV as a significantly trailing indicator for a high-growth portfolio. IP Group’s overall valuation approach for its unquoted portfolio was assessed as ‘mildly cautious’ by KPMG for both FY20 and FY21.
The overall prudence of management’s valuation approach can be assessed through whether the group makes realised gains on disposal. IP Group’s conservative carrying values are validated by recent data showing that realisations in each of FY20 (£191m) and FY21 (£213m) were 77% and 62% higher than the respective carrying values of those assets in the prior year.
|
Exhibit 12: Basis of valuations across IP Group’s portfolio (H122, by value) |
|
|
Source: IP Group |
Of IP Group’s top 20 holdings, representing 61% of H122 NAV, the vast majority (16 of 20 by number and 90% by value) are valued either based on a recent funding round or their quoted share price. Only one (Istesso) is valued based on a DCF approach, with Garrison Technology valued based on a revenue multiple and the two remaining holdings (Hysata and OSE) valued based on the anticipated (impending) rounds, both of which have subsequently been announced.
Sector review
IP Group invests across three principal sectors, life sciences, deep tech and cleantech. Following the acquisition of Touchstone in 2017, which significantly boosted the life sciences portfolio, IP Group remains life sciences led. As can be seen in Exhibit 13, life sciences remains the largest sector by value, even when the strategic segment (principally Oxford Nanopore) is broken out separately.
|
Exhibit 13: Breakdown by value (ex ONT) |
Exhibit 14: Sector split by company number |
|
|
|
Source: IP Group, H122 |
|
Exhibit 13: Breakdown by value (ex ONT) |
|
|
Source: IP Group, H122 |
|
Exhibit 14: Sector split by company number |
|
|
Source: IP Group, H122 |
IP Group’s three investment sectors share common attributes
IP Group’s life sciences, deep tech and cleantech segments all share common characteristics that differentiate them from more general investment sectors. Each sector takes scientific knowledge with the potential to solve or address a challenge, supports and commercialises it to create a healthier future, improve lifestyles with breakthrough technologies or address climate challenges.
Life sciences: A healthier future
Thematically, the life sciences team invests in understanding disease, focusing on disease cure and prevention rather than simply treating symptoms, thereby helping to create healthier, rather than just longer, lives.
Companies that exemplify this approach are Istesso (reprogramming cells to treat autoimmunity), PsiOxus (reconditioning tumours to enhance cancer immunotherapy) and Genomics (redirecting patient behaviour to mitigate the risk of, for example, cardiovascular disease).
In FY21, the life sciences portfolio saw a second year of strong growth with an uplift of £78.1m (FY20: £85.1m). The largest contributions came from Hinge Health (£32m), Inivata (£31m) and Athenex/Kuur (£11m). Reflecting management’s more focused investment approach, there were also write-downs totalling £24m, as support for a number of companies was curtailed.
Deep tech: A tech-enriched future
The deep tech team targets differentiated, defensible innovations with a strong value proposition and the potential to disrupt a multibillion-dollar global market. These are assets that IP Group believes will enable digital resilience, create prosperity and enable new capabilities.
Thematic focus areas include cybercrime and fintech (Featurespace and Garrison), next-generation networks (AccelerComm), human-machine interface (Ultraleap and WaveOptics) and neuromorphic and quantum computing (Oxford Quantum Circuits and Quantum Motion).
Deep tech had a strong year in FY21, delivering uplifts of £72.4m (FY20: £6.6m), including realisations from WaveOptics (£29.5m), Perpetuum and Inflowmatix (£4.9m). The valuation uplift included contributions from WaveOptics, Ultraleap, Featurespace and SaltPay, the latter of which tripled in value during the year to £24.6m.
Cleantech: A sustainable future
IP Group has rebranded its cleantech business, now called Kiko Ventures, a platform fully owned and funded by IP Group. Management has indicated that IP Group intends to invest £200m via Kiko Ventures over the next five years, into both existing and new cleantech companies.
Thematic focus areas include renewable electricity and alternative fuels (Bramble Energy – fuel cells, Hysata – high efficiency electrolyser), mobility and transport (Oxbotica – universal autonomy software), land use, greenhouse gas capture/removal and storage (C-Capture – transforming carbon capture) and climate risk and change management (Mixergy – decarbonised home energy), as well as food and agriculture.
The cleantech portfolio saw uplifts of £30.9m in FY21, primarily due to First Light Fusion, which completed a financing on strong technical progress. Post year end, Bramble Energy, a fuel cell business, also made significant advances, completing a substantial funding round in early FY22.
Third-party fund management business
Parkwalk Advisors, the cornerstone of third-party FUM
Parkwalk had funds under management (FUM) at 31 December 2021 of £388m (FY20: £350m) including alumni funds managed in conjunction with the universities of Oxford, Cambridge, Bristol and Imperial College London.
Parkwalk strengthens IP Group’s relationships with these universities. Parkwalk and IP Group have separate investment teams and mandates, and although they share insight and co-invest, this is the exception rather than the rule. Parkwalk’s managed funds deliver a regular fee income to the group, responsible for £7.9m (FY20: £5.1m) of the group’s £13.9m (FY20: £6.2m) of third-party fee income in FY21 and £3.7m in H122. The management of third-party funds is an important element of IP Group’s business model, adding insight and enhancing the group’s market presence, with the management fees helping to defray the group’s operating costs.
In total, the group managed or advised over £540m in third-party capital across its Parkwalk and Australasian business units as at 31 December 2021. The group is also launching a further fund management platform for China, through a joint venture with China Everbright. The platform is awaiting regulatory permissions but management anticipates a first close in H222. The rationale behind the Chinese platform is to provide the capital and expertise to support IP Group companies to effectively access the Chinese market.
Management has indicated that it intends to grow its third-party fund management business. As FUM scales, net operating costs are expected to continue to decline as a percentage of NAV.
North American investment platform
IP Group’s North American platform was established to replicate IP Group’s IP-based investment approach through partnerships with US universities. The fund builds early-stage companies, based on technology emerging from US universities and national laboratories, including the universities of Pennsylvania, Yale, Princeton, Columbia, Johns Hopkins and Washington. The scale of the US markets and research output suggests that the opportunity and capital requirement could be substantially larger than for the UK market and management believes that North America represents a significant growth opportunity for the group.
The fund had 29 investments in total worth nearly US$200m as at 31 December 2021, following net portfolio gains of £7.9m in FY21. The platform secured US$59m in new capital in 2021, including US$10m from IP Group. As a result, IP Group holds 58% of the platform equity, but with a minority of board seats, the holding was deconsolidated in IP Group’s FY21 accounts. Key events in FY21 included MOBILion’s US$60m crossover funding in July 2021. In H122, Carisma Therapeutics (novel cancer immunotherapies) signed an agreement with Moderna, which included a US$45m cash investment and a US$35m convertible note. Aptatek BioSciences (in-home health monitoring solutions for chronic disease) also completed a strategic funding round from Canterbury Scientific.
IP Group Inc. is now structured as a separate management company, which employs the US team directly. IP Group pays 58% of total platform costs of c US$6m pro rata to its holding in the general partner/limited partner (GP/LP) fund structure.
Investment platform for Australia and New Zealand
In 2017, IP Group signed commercialisation agreements with nine universities, eight of which are in Australia and one in New Zealand. The group committed to invest at least A$200m over a 10-year period to fund investments in IP-based spin-outs.
IP Group continues to work with Hostplus, one of Australia’s largest superannuation funds with over A$73bn in FUM, through the IP Group Hostplus Innovation Fund. Hostplus has now committed A$210m (c £110m) following its latest A$75m commitment in H122.
The Australia and New Zealand portfolio now comprises 14 investments and delivered fair value uplifts of A$14.6m in FY21 against an opening portfolio of A$12.9m, with A$19.3m of capital invested over the year. Notable events in H122 included an oversubscribed A$43m series A funding round for Hysata, developer of a novel capillary-fed electrolyser, which has demonstrated cell performance at 98% energy efficiency, a significant step change in efficiency that exceeds the 2050 IRENA target.
Experienced management team
The IPO of Oxford Nanopore in September 2021 represented a key milestone for IP Group. Not only was this the realisation of a ‘unicorn’, for an investment first made by IP Group in 2005, but it also marked the transition from one management team to another. Greg Smith stepped up from CFO to become CEO and David Baynes moved from COO to become chief financial and operating officer (CFOO).
Both Greg and David have considerable executive and finance experience, as well as extensive experience within IP Group. Greg Smith joined IP Group in 2008, becoming CFO in 2011, and David Baynes, having previously been CEO of Fusion IP (which he co-founded in 2004), joined as COO in 2014, with the acquisition of Fusion IP by IP Group.
The senior leadership team comprises 12 people, including Greg and David, the heads of each of IP Group’s business lines, as well as regional leaders and operational heads of department. Most of the senior team has been with IP Group for over 10 years, critical in a business that has been built around fostering long-term relationships with universities, research centres and their related academic networks. Management profiles can be found on IP Group’s website. IP Group had an average of 104 employees in FY21 (FY20: 103), falling to 96 staff at year end, following the deconsolidation of the US investment platform in November 2021 (see page 13).
ESG: Impact considered alongside financial returns
With a strong track record of investment returns that are closely aligned with social purpose, impact has always been integral to IP Group. The group contributes to a better future for people and the planet, through its investments in early-stage science and technology companies that have the potential to significantly impact society for the better.
IP Group integrates ESG using a bottom-up approach, looking at each deal individually, using a dual lens of potential positive impact to the world, incorporating sustainability factors / ESG materiality, as well as financial metrics. IP Group is committed to supporting the goals of the energy transition, as set out at COP26, both operationally and through its various portfolio companies, with its cleantech group (Kiko Ventures) leading on ground-breaking initiatives around climate change mitigation and adaptation.
IP Group also supports and participates in a number of industry-wide initiatives, such as the ESG Data Convergence Initiative, that seeks to create a critical mass of meaningful, performance based, comparable ESG data from private companies.
|
Exhibit 15: High-level overview of IP Group’s ESG framework |
|
|
Source: IP Group |
IP Group has recently tightened its focus around ESG, responsible investing and impact. Building on the recommendations of the materiality assessment study carried out in 2020, details of which can be found in the 2022 ESG report, management is working to strengthen its overall ESG approach and strategy, and has recently hired a head of ESG to lead this strategy.
Further details can be found in IP Group’s FY21 annual report and accounts, on its ESG and Responsible Investment webpage, with copies of the group’s reports, including its latest 2022 ESG report, available on its ESG and responsible investment reporting page.
Market overview
Zooming in on IP commercialisation and UK spinouts
Investors have committed £10.9bn into around 3,200 UK university spinouts over the past decade, according to latest research from Beauhurst (Equity investment into UK Spinouts 2022). After UK investors (c 2,500 deals), US investors have been the most active investors by far, involved in 378 deals, with the Netherlands (37 deals) and China (33 deals) ranked third and fourth.
|
Exhibit 16: Equity investment into UK spinouts (2012–21) |
Exhibit 17: Deal sizes have risen steadily over the past decade |
|
|
|
Source: Beauhurst |
Source: Beauhurst |
|
Exhibit 16: Equity investment into UK spinouts (2012–21) |
|
|
Source: Beauhurst |
|
Exhibit 17: Deal sizes have risen steadily over the past decade |
|
|
Source: Beauhurst |
In 2021, £2.54bn was invested in UK university spinouts, compared to £405m in 2012, a more than fivefold increase over the decade. Over the period, average deal sizes increased markedly, from just under £2m in 2012 to £6.5m in 2021. Foreign investor interest in UK university spinout deals more than trebled in 2021, with international backers participating in 40% of 2021 deals (2020: 20%). We also note the government’s recent £1.4bn ‘Global Britain’ investment fund, intended to help encourage overseas investment in key knowledge intensive companies.
According to Beauhurst data, IP Group’s fund management business, Parkwalk Advisors, was the single biggest investor into UK spinouts in 2021, with 31 deals, followed by Scottish Enterprise and the UK Government’s £1.14bn Future Fund, designed to help fund fast-growth companies through the COVID-19 pandemic. IP Group itself was the fourth most prolific investor with 14 deals, taking IP Group’s total count to 45 deals.
|
Exhibit 18: Top investors into UK spinouts by number of equity deals (2021) |
Exhibit 19: Top UK universities by value of spinout investment (2021) |
|
|
|
Source: Beauhurst |
Source: Beauhurst |
|
Exhibit 18: Top investors into UK spinouts by number of equity deals (2021) |
|
|
Source: Beauhurst |
|
Exhibit 19: Top UK universities by value of spinout investment (2021) |
|
|
Source: Beauhurst |
|
Exhibit 20: Largest spinout exits (2012–21) |
Exhibit 21: Nationalities of top acquirors of UK spinouts (by number of acquisitions) |
|
|
|
Source: Beauhurst |
Source: Beauhurst, 2012–21 |
|
Exhibit 20: Largest spinout exits (2012–21) |
|
|
Source: Beauhurst |
|
Exhibit 21: Nationalities of top acquirors of UK spinouts (by number of acquisitions) |
|
|
Source: Beauhurst, 2012–21 |
Only one in five exits is an IPO
Of the more than 3,000 investment deals over the past decade, 166 have realised an exit, with 134 (81%) exiting by way of M&A and 32 (19%) listing. Oxford Nanopore leads the way in the sector with the largest exit to date following its £3.4bn IPO in September 2021.
In terms of M&A, US acquirors hold the top ranking, accounting for more exits than UK companies, with Japanese acquirors in a distant third place.
The one in five ratio underlines the fact that IP Group (and deep tech investors in general) are not reliant on the IPO market for exits, but see building relationships with strategic investors as critical to the success of their investments on their path to a likely trade sale.
Sensitivities
A summary of the principal risk factors relating to IP Group is set out below:
■
Early-stage business risk: the early-stage nature of IP Group’s portfolio businesses carries a high degree of risk, with IP Group also exposed to risks related to non-controlling investments. Not all of the fund investments will achieve their hoped-for potential.
■
Reputation and deal flow: IP Group is reliant on the reputation of its senior investment team, its strategic contacts and ecosystem to source appropriate deal flow and deliver the quality of investment opportunity to drive attractive investment returns.
■
Portfolio concentration: despite a broad underlying portfolio, IP Group relies on a relatively concentrated portfolio of investments to deliver returns. Realisations and investor returns may be dominated by a limited number of investee companies.
■
Sector-risk: the company is subject to risks associated with developments in the technology and life sciences sectors in particular, including the cyclicality of valuations, as well as other unforeseen future developments.
■
Valuation risk: IP Group’s investments are difficult to value accurately, with valuation methodologies subject to significant subjectivity. There can be no assurance that the reported values of the company’s investments will be realised, particularly given the time lag between public and private market valuations.
■
Liquidity events: exits are uncertain and difficult to predict and proceeds from trade sales/IPOs are likely to vary substantially from year to year, with the potential for liquidity events to slow if valuations fall.
Financials
H122 interim results: Public market falls now priced in
IP Group’s H122 interim results were in line with guidance given at the end of May. Management reported an NAV per share of 136.7p, an 18% fall over the six months since FY21 year-end that reflects broader market declines. The reduced NAV was largely driven by falls in the quoted portfolio, principally Oxford Nanopore (87% of £395m decline), with the value of the private portfolio rising by £104m to partially offset the quoted decline.
IP Group invested £52m in H122 across 22 new and existing investments (H121: £71m, 42; FY21: £107m, 67), with £2m of realisations (H121: £112m; FY21: £214m), resulting in net investment of £50m (H121: net realisations of £41m; FY21: net realisations of £107m). Given the market backdrop, management is anticipating reduced levels of cash realisations in FY22, with investment lower than originally envisaged.
Several of IP Group’s lead assets showed continuing progress in H122, with Istesso preparing to commence a Phase IIb trial for its lead drug MBS2320 in rheumatoid arthritis (the trial commenced at the end of August 2022 on an expected two-year timeline), and First Light Fusion achieving first fusion, externally validated by the UK Atomic Energy Authority. After the period end, another portfolio company, Hysata, raised A$43m (£24m) to help develop a pilot manufacturing facility for low-cost green hydrogen. IP Group committed £11m to the funding round, split between IP Group Australia and Kiko Ventures, its cleantech platform. On completion, IP Group's stake is valued at £19m, a net gain of £8m (0.8p per share). In August, Diurnal received a cash offer from Neurocrine Biosciences, valuing IP Group’s 29% holding at £14m and the company at approximately £48m.
To reassure investors over its portfolio valuations, management secured external valuations for five of its top 20 holdings at 30 June 2022 (First Light Fusion, Featurespace, Hinge Health, Ultraleap and PsiOxus), with valuations for the majority of the remainder being based off recent or forthcoming funding rounds.
As part of management’s IR initiatives, recordings of the H122 interim results and other recent presentations are available on the Investor Meet Company website.
FY21 was a record year with a 31% rise in net assets
FY21 was a record year for IP Group. Portfolio fair value as at 31 December 2021 rose to £1.45bn (FY20: £1.16bn), with realisations of £213m and investments of £104m. This led to a net portfolio return (portfolio fair value less net investment) of 31% (FY20: 23%).
Along with the FY21 net fair value gain of £495m (FY20: £228m), IP Group also recorded fee income from advisory services, fund management, licensing and royalties of £13.6m (FY20: £6.2m), with Parkwalk fund management fees contributing £7.9m of this figure. This drove a rise in revenue for FY21 of 117% to £509m, from £234m in FY20. As a result of the increase in fee income, net overheads fell from £21.6m in FY20 to £19.5m in FY21, representing 1.6% and 1.1% of NAV, respectively.
Administrative costs rose to £53.0m in FY21 (FY20: £46.6m), with combined carried interest and share-based payment charges rising by 15% to £19.8m in FY21 (FY20: £17.2m). IP Group reported PBT of £455m (FY20: £186m) and PAT of £449m (after a 1.2% tax charge), a rise of 142% from £185m in FY20. The low tax charge is because IP Group benefits from unused tax losses totalling £264.4m in FY21 (2020: £267.1m).
Carry balances accrue to management teams (including IP Group employees) based on the portfolio fair value at period end. In FY21, carry was accrued at 3.5% of net portfolio gains (£497m) and represented 2.3% of portfolio fair value at the end of FY21 (FY20: 1.7%).
Net assets increased by £407m (31%) in FY21 to £1.74bn (FY20: £1.33bn), broadly reflecting profit after tax (FY21: £449m), less dividend payments (FY21: £15m), less the cost of share repurchases (£27m).
Well-funded with FY21 gross cash and deposits of £322m
IP Group remains in a strong position to support its portfolio as well as to invest in new businesses, with gross cash and deposits of £236m at 30 June 2022 (FY21: £322m) and net cash of £192m (FY21: £270m), reflecting £44m of outstanding EIB debt at 30 June 2022. After the period end, management agreed terms on a £120m debt private placement at an average interest rate of 5.25%, providing £105m of increased liquidity after the repayment of £15m of short-dated EIB debt. IP Group will draw down 50% of the loan notes in December 2022, with the remainder to be drawn in June 2023.
Included in the group’s gross cash is restricted cash, the majority of which relates to six months of interest and debt repayments for the group’s EIB debt facilities (H122: £8.5m, FY21: £9.4m), with the balance relating to capital requirements for its regulated entities.
Valuation
Uplift based on realisations, funding rounds and peer multiples
Growth in portfolio fair value is irregular and the timing of realisations and exits can be hard to predict. Given this variability, there is no easily defined revenue and profitability trend for investment companies and so businesses like IP Group are typically valued at a premium or discount to NAV rather than on a profit multiple.
Consequently, the principal value driver for IP Group is the increase in value of its investment portfolio (FY21: 27% growth year-on-year, five-year CAGR FY16–21 of 20%). This in turn is driven by a combination of realisations, funding rounds involving third-party investors at higher values as well as revenue growth in the underlying portfolio businesses, driving increased peer multiples-based valuations.
|
Exhibit 22: IP Group discount to NAV FY17 to date |
|
|
Source: Refinitiv, Edison Investment Research |
As can be seen in Exhibit 22, over the last five years IP Group’s share price has moved from a premium to a discount, with that discount today starting to climb back from its recent lows, although still well below its average value over the period of 0.84x.
What 20% annual growth over five years means for IP Group
IP Group’s H122 NAV per share was 136.7p. If portfolio fair value, net assets and NAV/share were each to grow at an average of 20% over the five years H122–27, in line with management’s target, this would imply the following targets for H127: portfolio fair value of £3.1bn (H122: £1.3bn), net assets of £3.5bn (H122: £1.4bn) and NAV/share of 340p (H122: 137p). If the share price discount to NAV were to close (which we would expect after a period of prolonged strong performance) to the group’s average discount to NAV of 0.84x from 0.51x currently, then this would further boost returns to an average annual return of over 30% for shareholders investing at today’s share price levels.
Exhibit 23: The potential implications for a 20% average gross annual return over five years
Portfolio fair value |
NAV |
NAV/s |
Discount |
S/P |
|
£bn |
£bn |
p |
x |
p |
|
H122 |
1.3 |
1.4 |
137 |
0.51 |
70 |
H127 |
3.1 |
3.5 |
340 |
0.84 |
286 |
CAGR |
20% |
20% |
20% |
10% |
33% |
Source: Edison Investment Research
Looking ahead, what three more unicorns might look like
Management is aiming to create more unicorns, companies with a valuation of US$1bn+. As such, we have looked at what this might mean for IP Group as a theoretical exercise (Exhibit 25), although the creation of additional unicorns will depend critically on market conditions and portfolio companies executing on their strategic plans.
First of all, we have normalised the valuation of Oxford Nanopore. Were Oxford Nanopore to be valued at its IPO price (£4.25), IP Group would see an uplift of £123m (12p per share). Secondly, we have looked at the valuation uplift that IP Group would enjoy if Istesso, First Light Fusion and Featurespace were each to be valued at £1bn, with IP Group seeing valuation uplifts of £468m (45p per share), £161m (16p per share) and £130m (13p per share), respectively (assuming no dilution of IP Group’s current holdings).
|
Exhibit 24: The potential for a future premium |
|
|
Source: Edison Investment Research |
Collectively, these events would lead to a 62% rise in NAV to £2,296m (222p per share) from the H122 NAV of £1,414m.
Portfolio (ex ONT) priced at a 70% discount to NAV
We have also considered what the current share implies for the valuation of IP Group’s portfolio, excluding Oxford Nanopore. At 30 June 2022, IP Group’s stake in Oxford Nanopore was worth c 22p per share, with net cash of £192m, or c 19p per share. If we subtract these amounts from the H122 NAV per share of 137p, we calculate a NAV for the remaining portfolio of 96p per share. If we similarly adjust the latest share price (12 September 2022: 69.85p) by 22p for ONT and 19p for net cash, we calculate that the market is pricing IP Group’s remaining portfolio at c 29p per share, a 70% discount to its current carrying value.
Looking forward, prospective returns hold real promise
IP Group’s H122 NAV per share of 136.7p represented an 18% fall over the six months since FY21 year-end (FY21: 167p), reflecting broader market declines. However, there are a number of factors that suggest IP Group’s future prospects may be brighter than its medium-term track record would indicate: (1) the acquisition of Touchstone and its impact on IP Group’s five-year track record will be gradually removed over the next two to three years; (2) the growing maturity of IP Group’s portfolio as reflected in net realisations from the portfolio since FY19 and the 24% FY19–21 NAV/share CAGR; and (3) management’s more disciplined capital allocation policy and focus on its priority holdings, leading to target average gross returns of 20% from FY22–26, which we believe would be likely to drive average annual NAV/share returns over this period in excess of 30%.
Value of the funds business incremental to NAV
IP Group’s management has indicated that it is looking to build its third-party funds business, which should increase fee income as FUM increase, providing a relatively stable and predictable income stream to offset operational costs.
Research carried out by Marco Bigelli and Fabio Manuzzi (The Valuation of Asset Management Firms, 2019) found that the average value of asset management firms was 3% of assets under management (AUM) based on average annual fees of 1% of AUM, with higher valuations significantly positively correlated to higher fees percentages.
By our calculation, IP Group derives management fees of £7.9m on £540m of FUM, indicating average fees of c 1.5%, meaningfully above the average benchmark noted in the analysis above. On this basis, we would propose to reflect the value of the group’s fee-earning funds business at 4% of FUM. With FUM of £540m, this implies a valuation for the funds business of £22m, or 2p per share, on top of the H122 NAV of 137p.
Market: A broad church of direct investment vehicles
We set out below the quoted peer group for IP Group, including companies with different business models, focused on investing in private companies, both technology and life sciences.
The peers can be placed into four groups:
■
IP commercialisation (Frontier IP, Malin, Syncona): IP commercialisation companies invest at an earlier stage than VCs (seed or even pre-seed).
■
Venture capital (Arix Bioscience, Augmentum, Molten, TMT Investments): VC companies focus on fast-growing, early-stage technology businesses. However, each has a different strategy, with bespoke specialities by sector and/or size and stage of investment.
■
Private equity (HgCapital, Oakley Capital): Private equity companies hold later-stage, profitable portfolio companies, allowing them to mark to market quarterly and recognise fair value gains without a transaction or funding round taking place.
■
Specialist asset manager (Mercia Asset Management): From its roots in IP commercialisation, Mercia has broadened its investment footprint to include third-party VCT, managed debt and private equity funds alongside its balance sheet venture capital fund, all with a focus on UK regional investment (outside London).
Exhibit 25: Quoted peer group
Price |
Currency |
Market cap (£m) |
Last NAV reported (£m) |
Net cash/ |
NAV per share (p) |
Price/ |
Date of NAV |
||
IP Group |
69.85 |
GBp |
723 |
1,414 |
192 |
137.0 |
0.51 |
30 Jun |
|
Arix Bioscience |
117.0 |
GBp |
150 |
227 |
131 |
176.0 |
0.66 |
31 Jul |
|
Augmentum Fintech |
110 |
GBp |
195 |
295 |
61 |
155 |
0.71 |
31 Mar |
|
Frontier IP Group |
62.5 |
GBp |
34 |
47 |
6 |
84.7 |
0.74 |
31 Dec |
|
HgCapital Trust |
369 |
GBp |
1,676 |
2,030 |
300 |
443 |
0.83 |
30 Jun |
|
Malin Corporation |
4.71 |
EUR |
160 |
340 |
33 |
7.50 |
0.63 |
11 Mar |
|
Mercia Asset Management |
27.15 |
GBp |
119 |
201 |
61 |
45.60 |
0.60 |
31 Mar |
|
Molten Ventures |
356 |
GBp |
544 |
1,434 |
48 |
937 |
0.38 |
31 Mar |
|
Oakley Capital Investments |
412 |
GBp |
726 |
1,119 |
97 |
630 |
0.65 |
30 Jun |
|
Syncona |
196.0 |
GBp |
1,302 |
1,310 |
485 |
194.4 |
1.01 |
31 Mar |
|
TMT Investments |
4.05 |
USD |
127 |
210 |
13 |
6.68 |
0.61 |
30 Jun |
|
Peer group mean |
0.68 |
||||||||
Peer group median |
0.66 |
||||||||
Source: Company accounts, Refinitiv. Note: Priced at 12 September 2022.
Safety first, pricing in the downside
The peer group is currently trading at an average of 0.69x NAV, but with a wide range, stretching from 0.38–1.01x NAV. The market has been marking down companies with a perceived higher consumer exposure, those with a higher portfolio exposure to quoted equity and those with more limited cash reserves to see them through the downturn.
IP Group has a strong cash position (gross cash of £236m, with an additional £105m of liquidity from the private debt placement) and a ‘deep tech’ portfolio whose valuations should prove resilient to further market weakness. Other than Oxford Nanopore, IP Group’s exposure to quoted equity is limited. With IP Group’s current price of 69.85p versus its H122 NAV/share of 137p, which factors in the majority of recent market downside, IP Group’s shares are currently trading at a c 25% discount to the peer group average.
The 70% discount to carrying value of the portfolio ex-ONT (discussed above) illustrates the degree of downside currently priced into IP Group’s shares. With potential for over 30% annualised returns if management can deliver on its targeted average gross annual returns of 20% to FY26, IP Group looks attractive at current valuations over a medium-term horizon.
Market outlook: Unclear what comes next
IP Group’s peers have been under pressure over the course of 2021, with investors marking down fund manager valuations to record levels of discount, even when NAVs have been struck recently and therefore reflect a relatively current view of valuations. As can be seen in the valuation table (Exhibit 25, peers trade at a wide range of discounts to NAV, with investors allowing for further falls in portfolio valuations, in some cases, of a further 50% (or more) from latest carrying values, even where investment companies are well funded.
In our view, this approach can only be justified where:
■
In a short duration downturn in valuations, the fund manager has been caught short of cash to support its portfolio. This is not the case for IP Group, which remains well-capitalised.
■
Investors expect the downturn in valuations to persist through 2022–23, with even well-capitalised fund managers having to materially reduce commitments and make hard choices as to which portfolio companies to support. This remains a possibility, although share prices have selectively recovered some of their losses over the summer.
■
The business model of major portfolio companies (and therefore also of the fund manager) is fundamentally flawed, with valuations potentially permanently impaired. This is more likely to apply to more speculative, momentum-based B2C models, whereas IP Group invests in science-based (KPI-driven) B2B assets.
In all scenarios, we expect the IPO window to remain closed for much of 2022. This is not an unusual occurrence through the investment cycle and we would note that, historically, only c 20% of IP commercialisation companies have exited by way of an IPO, with the vast majority preferring a trade exit to a strategic buyer.
As such, we believe that the level of negativity implied by current valuations is potentially overdone:
■
As we set out in our sector note Waiting for long-term investors to catch on, the sector enjoys a ‘survivor bias’, with many of the current crop of fund managers having demonstrated proven, battle-hardened models, which have existed in public or private form for at least 10 years. The more speculative models have already disappeared.
■
Following a record FY21, portfolio companies are largely well-funded through 2022 and into 2023 following a wide range of funding rounds. IP Group is also well-funded at the group level, with its gross cash balance (H122: £236m) benefiting from FY21’s record portfolio exits.
■
Particularly among science-based and deep tech portfolios, commercial progress remains strong with B2B business models expected to remain resilient as investments either help to create new markets or disrupt established markets (ie cut costs for established businesses).
■
As the UK and Europe seek to catch up with the more mature private capital ecosystem in the United States, there remain significant levels of capital committed to private companies in the region that may support valuations in the short term.
■
Portfolio companies’ strong underlying growth may well partially or fully offset falls in valuation multiples if rounds are pushed back or delayed, meaning that headline valuations should not fall as hard or fast as the market appears to be pricing in (falls of up to 50%).
■
Given the use of preferred share structures by investors, the common assumption that private company valuations will necessarily fall by the same level as the public markets may not hold true, at least in a relatively short-lived downturn. These instruments mean that investors are often able to protect their position and re-price a prior investment round if that round is followed by a down-round.
Exhibit 26: Financial summary
Year end 31 December |
£m |
FY17 |
FY18 |
FY19 |
FY20 |
FY21 |
|
INCOME STATEMENT |
IFRS |
IFRS |
IFRS |
IFRS |
IFRS |
||
Portfolio returns |
97.4 |
(46.1) |
(44.6) |
228.0 |
495.3 |
||
Fee income |
6.1 |
9.9 |
8.6 |
6.2 |
13.6 |
||
Revenue |
|
|
103.5 |
(36.2) |
(36.0) |
234.2 |
508.9 |
Cost of sales |
- |
- |
- |
- |
- |
||
Gross Profit |
103.5 |
(36.2) |
(36.0) |
234.2 |
508.9 |
||
Carried interest charge |
(1.3) |
1.1 |
1.3 |
(14.3) |
(17.2) |
||
Operating costs |
(37.6) |
(51.7) |
(39.4) |
(29.4) |
(33.1) |
||
Investment and acquisition costs |
(9.1) |
- |
- |
- |
- |
||
Normalised operating profit |
|
|
55.5 |
(86.8) |
(74.1) |
190.5 |
458.6 |
Exceptionals |
- |
(203.2) |
- |
- |
- |
||
Share-based payments |
(2.4) |
(1.9) |
(2.3) |
(2.9) |
(2.6) |
||
Reported operating profit |
53.1 |
(291.9) |
(76.4) |
187.6 |
456.0 |
||
Net Interest |
0.3 |
(1.8) |
(2.4) |
(1.5) |
(1.4) |
||
Profit Before Tax (norm) |
|
|
55.8 |
(88.6) |
(76.5) |
189.0 |
457.2 |
Profit Before Tax (reported) |
|
|
53.4 |
(293.7) |
(78.8) |
186.1 |
454.6 |
Reported tax |
- |
(0.1) |
(0.1) |
(0.7) |
(5.3) |
||
Profit After Tax (norm) |
55.8 |
(88.6) |
(76.6) |
188.3 |
451.9 |
||
Profit After Tax (reported) |
53.4 |
(293.8) |
(78.9) |
185.4 |
449.3 |
||
Minority interests |
(3.7) |
0.1 |
3.4 |
- |
(1.1) |
||
Net income (normalised) |
52.1 |
(88.5) |
(73.2) |
188.3 |
450.8 |
||
Net income (reported) |
49.7 |
(293.7) |
(75.5) |
185.4 |
448.2 |
||
Basic average number of shares outstanding (m) |
704 |
1,059 |
1,059 |
1,062 |
1,060 |
||
EPS - basic normalised (p) |
|
|
7.4 |
(8.4) |
(6.9) |
17.7 |
42.5 |
EPS - diluted normalised (p) |
|
|
7.4 |
(8.4) |
(6.9) |
17.6 |
41.9 |
EPS - basic reported (p) |
|
|
7.1 |
(27.7) |
(7.1) |
17.5 |
42.3 |
Dividend (p) |
- |
- |
- |
- |
1.48 |
||
Revenue growth (%) |
(135.0) |
(0.6) |
(750.6) |
117.3 |
|||
Gross Margin (%) |
100.0 |
100.0 |
100.0 |
100.0 |
100.0 |
||
Normalised Operating Margin (%) |
53.6 |
239.8 |
205.8 |
81.3 |
90.1 |
||
Net overheads (operating costs less fee income)/NAV (%) |
(2.1) |
(3.4) |
(2.7) |
(1.7) |
(1.1) |
||
BALANCE SHEET |
|||||||
Fixed Assets |
|
|
1,325.1 |
1,147.7 |
1,068.5 |
1,186.1 |
1,539.5 |
Intangible Assets |
212.7 |
0.7 |
0.4 |
0.4 |
0.4 |
||
Tangible Assets |
1.6 |
1.5 |
1.1 |
0.8 |
0.3 |
||
Investments |
1,099.8 |
1,128.2 |
1,045.6 |
1,162.7 |
1,445.9 |
||
Investments in Associates |
11.0 |
17.3 |
21.4 |
22.2 |
92.9 |
||
Current Assets |
|
|
334.6 |
225.6 |
227.2 |
289.2 |
339.8 |
Stocks |
8.3 |
6.6 |
32.3 |
18.9 |
17.9 |
||
Cash & equivalents |
231.3 |
129.0 |
121.9 |
127.6 |
105.7 |
||
Deposits |
95.0 |
90.0 |
73.0 |
142.7 |
216.2 |
||
Current Liabilities |
|
|
(26.0) |
(31.9) |
(41.4) |
(26.4) |
(34.1) |
Creditors |
(19.7) |
(16.5) |
(26.0) |
(11.0) |
(18.7) |
||
Lease liabilities |
- |
- |
- |
- |
- |
||
Short term borrowings |
(6.3) |
(15.4) |
(15.4) |
(15.4) |
(15.4) |
||
Long Term Liabilities |
|
|
(125.2) |
(123.2) |
(112.4) |
(117.0) |
(107.1) |
EIB loans |
(97.7) |
(82.4) |
(67.1) |
(51.9) |
(36.4) |
||
Other borrowings |
(13.1) |
(23.0) |
(26.0) |
(32.9) |
(18.7) |
||
Lease liabilities |
- |
- |
- |
- |
- |
||
Other long-term liabilities |
(14.4) |
(17.8) |
(19.3) |
(32.2) |
(52.0) |
||
Net Assets |
|
|
1,508.5 |
1,218.2 |
1,141.9 |
1,331.9 |
1,738.1 |
Minority interests |
4.0 |
3.9 |
0.5 |
0.5 |
(3.1) |
||
Shareholders' equity |
|
|
1,504.5 |
1,214.3 |
1,141.4 |
1,331.4 |
1,735.0 |
Hard NAV per share |
|
|
122.5 |
115.0 |
107.8 |
125.3 |
167.0 |
CASH FLOW |
|||||||
Op Cash Flow before WC and tax |
60.3 |
(75.7) |
(72.6) |
191.9 |
460.2 |
||
Revaluation of investments held at fair value through P&L |
(94.0) |
46.1 |
44.6 |
(228.0) |
(495.4) |
||
Working capital |
10.2 |
7.8 |
14.1 |
(5.9) |
30.0 |
||
Exceptional & other |
1.1 |
(3.1) |
(3.4) |
14.5 |
15.2 |
||
Tax |
- |
- |
- |
- |
- |
||
Net operating cash flow |
|
|
(22.4) |
(24.9) |
(17.3) |
(27.5) |
10.0 |
Capex |
(1.6) |
(0.6) |
(0.7) |
- |
(0.2) |
||
Acquisitions/disposals |
106.4 |
(4.8) |
(9.3) |
(4.5) |
(10.1) |
||
Equity financing |
109.8 |
(100.9) |
(63.0) |
(68.6) |
(131.6) |
||
Dividends |
- |
- |
- |
- |
(15.0) |
||
Other |
9.3 |
29.0 |
83.2 |
106.3 |
124.9 |
||
Net Cash Flow |
201.5 |
(102.2) |
(7.1) |
5.7 |
(22.0) |
||
Opening net debt/(cash) |
|
|
(97.4) |
(222.3) |
(121.2) |
(112.4) |
(203.0) |
FX |
0.2 |
(0.1) |
0.0 |
0.0 |
0.1 |
||
Other non-cash movements |
(76.8) |
1.2 |
(1.7) |
84.9 |
89.0 |
||
Closing net debt/(cash) |
|
|
(222.3) |
(121.2) |
(112.4) |
(203.0) |
(270.1) |
Source: Company accounts, Edison Investment Research
|
|||||||||||||||||||||||||||||||||||||
Appendix
Priority list: With the potential to spawn unicorns
IP Group is increasingly focusing on its top priority companies, with management’s ambition to grow and support another five businesses to values in excess of US$1bn and at least one worth more than US$10bn within the next five years. Management has identified at least five of these opportunities, in addition to the three unicorns already created (Oxford Nanopore, Ceres Power and Hinge Health), three of which are summarised below. Management plans to allocate more resources and capital to these opportunities to accelerate their development over the next few years.
Exhibit 27: Three portfolio companies with unicorn potential
Theme and company |
Milestones achieved |
Value creation milestones |
Featurespace |
■ Completion of US$45m Series C ■ 2020 revenues: £21m ■ Five-year recurring revenue CAGR: 74% ■ 68 customers (Dec 2021) |
■ Customer acquisition and revenue growth ■ Faster growth rate than projected market growth of 30% |
Istesso |
■ Positive Phase 2a data in patients with rheumatoid arthritis ■ Preparations for Phase 2b assessment ongoing |
■ MBS2320 Phase 2b data H1 2024 ■ Second product into clinic ■ MBS2320 Phase 3 trial |
First Light Fusion |
■ Commissioning of hyper-velocity gas gun reactor ■ Validated fusion reaction |
■ Series D fund-raise ■ High-impact scientific publication ■ Specify gain reactor (Machine 4) |
Source: IP Group
■
Istesso (56.4% stake, valued at £96m): IP Group first invested in Modern Biosciences (later renamed Istesso) in 2005. It is now the group’s second most valuable holding after Oxford Nanopore. Istesso is developing new treatments for autoimmune disease by reprogramming the metabolism of immune cells, with the potential to benefit patients with diverse conditions such as rheumatoid arthritis, multiple sclerosis and ulcerative colitis. At the end of August 2022, Istesso announced that it had commenced a phase IIb trial - a randomized, multi-centre, double-blind parallel group, placebo-controlled trial investigating the efficacy and safety of multiple doses of the metabolic reprogramming agent MBS2320. The study is to consist of a twelve-week treatment period and will enrol subjects in multiple countries in Europe and Latin America. Istesso expects results from the study in 2024. A Phase III trial would then start in 2025.
■
First Light Fusion (27.5% stake, valued at £115m) confirmed in April 2022 that it had achieved fusion, independently validated by the UK Atomic Energy Authority. Although there are c 35 competing fusion projects, this is the first time fusion has been achieved using a projectile-based approach, a method that is simpler and more energy efficient, with lower physics risk than competitive approaches. First Light also achieved fusion on less than £45m, with a rate of performance improvement faster than any other fusion scheme. As a next step, the company is advancing plans for a ‘gain’ experiment (more energy out than in), before working towards a pilot plant producing c 150MW of electricity and costing less than US$1bn in the 2030s. First Light is working with UBS to explore strategic options for the next phase of its scientific and commercial development. IP Group management believes this result will at least double the value of the company at the next funding round.
■
Featurespace (19.5% stake, valued at £65m): a multi-award-winning world leader in enterprise financial crime prevention for fraud and anti-money laundering, applying adaptive behavioural profiling to reduce false threat identification by 80%. Featurespace has raised £83m in capital and is in the process of raising a further US$45m Series C funding round to take it to break-even.
|
|
Research: Healthcare
Sequana Medical reported H122 financials with expenditure mildly above our forecasts and confirmed previous guidance for its cash runway to last into Q323, including €10m in potential proceeds from its Kreos loan facility. Most importantly, it maintained guidance for key upcoming catalysts, namely its expectation to report top-line data for its North American POSEIDON study of alfapump in recurrent and refractory ascites (RRA) in Q422 and to submit a US premarket approval (PMA) application in H223, assuming positive data. Sequana also expects to commence enrolment in H123 for the MOJAVE Phase Ib/IIa US trial assessing DSR 2.0 as short-term direct sodium removal (DSR) therapy in chronic heart failure patients with persistent congestion.