Last close As at 05/08/2026
GBP8.17
▲ 7.00 (0.86%)
Market capitalisation
GBP819m
Research: Investment Companies
Finsbury Growth & Income Trust (FGT) aims to generate long-term capital and income growth from a concentrated portfolio of primarily UK equities. Manager Nick Train has recently initiated a position in Manchester United, which is FGT’s first new holding since 2015. He believes that the football club has a very strong and valuable franchise, along with a history of generating positive returns for shareholders. FGT has a long-term track record of outperformance versus its FTSE All-Share index benchmark, with higher returns over the last one, three, five and 10 years. The trust has a progressive dividend policy; the FY17 dividend was 8.4% higher than in FY16, despite a meaningful dividend cut at portfolio company Pearson.
Written by
Finsbury Growth & Income Trust |
Glory, glory, Man United |
Investment trusts |
16 November 2017 |
Share price/discount performance
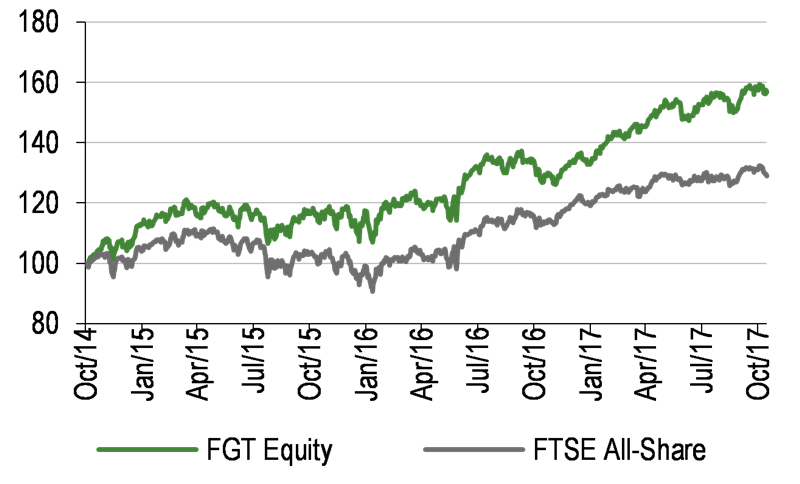
Three-year performance vs index
Gearing
Analysts
|
|||||||||||||||||||||||||||||||||||||||||||||||||||||||||||||||||||||||||||||||||||||||||||||
Finsbury Growth & Income Trust (FGT) aims to generate long-term capital and income growth from a concentrated portfolio of primarily UK equities. Manager Nick Train has recently initiated a position in Manchester United, which is FGT’s first new holding since 2015. He believes that the football club has a very strong and valuable franchise, along with a history of generating positive returns for shareholders. FGT has a long-term track record of outperformance versus its FTSE All-Share index benchmark, with higher returns over the last one, three, five and 10 years. The trust has a progressive dividend policy; the FY17 dividend was 8.4% higher than in FY16, despite a meaningful dividend cut at portfolio company Pearson.
12 months ending |
Share price |
NAV |
FTSE All-Share |
FTSE 350 |
MSCI World |
31/10/13 |
34.4 |
33.5 |
22.8 |
22.4 |
26.8 |
31/10/14 |
5.5 |
7.0 |
1.0 |
1.0 |
9.7 |
31/10/15 |
16.4 |
16.0 |
3.0 |
2.8 |
6.0 |
31/10/16 |
15.2 |
14.4 |
12.2 |
12.3 |
28.8 |
31/10/17 |
18.4 |
18.3 |
13.4 |
13.1 |
13.5 |
Source: Thomson Datastream. Note: All % on a total return basis in GBP.
Investment strategy: High-quality, long-term investing
The manager invests in three broad themes: global consumer brands, owners of media/software intellectual property, and capital market proxies. His unconstrained approach means that he is invested in just four of the 10 sectors of the FTSE All-Share benchmark: consumer goods, financials, consumer services and technology. Train seeks to invest in “great companies and hold them forever”; selecting firms with durable business models, high returns and strong free cash flow. Turnover is low and the majority of holdings have been in the portfolio for more than 10 years. The manager prefers to be fully invested and employs a modest level of gearing: 2.0% at end-September, versus a maximum permitted 25% of net assets.
Market outlook: Improvement in corporate earnings
Share prices, both in the UK and overseas, have been supported by an improvement in corporate earnings. In a low interest rate environment, continued demand for equities has led to a positive revaluation. On a forward P/E basis, UK equities (as well as those in the majority of developed markets) are trading at a c 20% premium to their 10-year average. Given this backdrop, investors may be attracted to a concentrated fund invested in high-quality companies, which has a positive long-term performance track record.
Valuation: Active discount management
FGT aims to ensure that its shares trade close to NAV, and as a result of strong ongoing investor demand, there is regular share issuance. The trust is currently trading broadly in line with its cum-income NAV, which compares to the 0.5% average premiums of the last one, three and five years. FGT’s progressive dividend policy has led to an average 7.7% increase in the annual dividend over the last five years. The current dividend yield is 1.9%.
Exhibit 1: Trust at a glance
Investment objective and fund background |
Recent developments |
||||||||||||||||||||||||||||||||||||||||||||||||||||||||||||||||||||||
FGT’s investment objective is to achieve capital and income growth and provide shareholders with a total return above that of the FTSE All-Share Index. It invests principally in the securities of UK-quoted companies, but up to a maximum of 20% at the time of acquisition can be invested in non-UK-quoted companies. FTSE 100 companies normally represent 50-100% of the portfolio, with at least 70% usually invested in FTSE 350 companies. |
■ 26 October 2017: Appointment of Kate Cornish-Bowden and Lorna Tilbian as independent non-executive directors, with immediate effect. ■ 27 September 2017: Announcement of second interim dividend of 7.4p (+5.7% year-on-year). ■ 9 May 2017: Six-month results to 31 March 2017. NAV TR +6.5% versus benchmark TR +8.1%. Share price TR +6.4%. ■ 14 March 2017: Announcement of first interim dividend of 6.8p (+11.5% year-on-year). |
||||||||||||||||||||||||||||||||||||||||||||||||||||||||||||||||||||||
Forthcoming |
Capital structure |
Fund details |
|||||||||||||||||||||||||||||||||||||||||||||||||||||||||||||||||||||
AGM |
January 2018 |
Ongoing charges |
0.7% |
Group |
Frostrow Capital |
||||||||||||||||||||||||||||||||||||||||||||||||||||||||||||||||||
Final results |
December 2017 |
Gearing |
2.0% |
Manager |
Lindsell Train |
||||||||||||||||||||||||||||||||||||||||||||||||||||||||||||||||||
Year end |
30 September |
Annual mgmt fee |
Tiered (see page 7) |
Address |
25 Southampton Buildings, London, WC2A 1AL |
||||||||||||||||||||||||||||||||||||||||||||||||||||||||||||||||||
Dividend paid |
May, November |
Performance fee |
None |
||||||||||||||||||||||||||||||||||||||||||||||||||||||||||||||||||||
Launch date |
January 1926 |
Trust life |
Indefinite |
Phone |
+44 (0)20 3008 4910 |
||||||||||||||||||||||||||||||||||||||||||||||||||||||||||||||||||
Continuation vote |
None |
Loan facilities |
£75m (see page 7) |
Website |
|||||||||||||||||||||||||||||||||||||||||||||||||||||||||||||||||||
Dividend policy and history (financial years) |
Share buyback policy and history (financial years) |
||||||||||||||||||||||||||||||||||||||||||||||||||||||||||||||||||||||
Two dividends paid annually in May and November. The dividend is expected to rise over the longer term. |
Renewed annually, the trust has the authority to purchase up to 14.99% and allot up to 10% of issued share capital. |
||||||||||||||||||||||||||||||||||||||||||||||||||||||||||||||||||||||
|
|
||||||||||||||||||||||||||||||||||||||||||||||||||||||||||||||||||||||
Shareholder base (as at 31 October 2017) |
Portfolio exposure by geography (as at 30 September 2017) |
||||||||||||||||||||||||||||||||||||||||||||||||||||||||||||||||||||||
|
|
||||||||||||||||||||||||||||||||||||||||||||||||||||||||||||||||||||||
Top 10 holdings (as at 30 September 2017) |
|||||||||||||||||||||||||||||||||||||||||||||||||||||||||||||||||||||||
|
|||||||||||||||||||||||||||||||||||||||||||||||||||||||||||||||||||||||
Source: Finsbury Growth & Income Trust, Edison Investment Research, Bloomberg, Morningstar. Note: *N/A where not in September 2016 top 10. **Formerly Reed Elsevier.
Market outlook: Earnings supporting equity valuations
The performance of both UK and world equities is shown in Exhibit 2 (LHS). Global equities have been buoyant over the last year as investors have focused on an improvement in corporate earnings, as a result of a synchronised upturn in global economic growth, rather than dwelling on ongoing macroeconomic concerns, such as higher interest rates or political uncertainties. On a forward P/E basis, UK equities, along with those of most other developed markets, are trading at a c 20% premium to their 10-year averages. This implies that investors may wish to be more selective when choosing their equity exposure. A fund that invests in high-quality companies, with a long-term approach and has a consistent record of outperformance, may offer appeal.
|
Exhibit 2: Market performance and valuation |
|||||||||||||||||||||||||||||||
Performance of indices (last 10 years – £ adjusted) |
Valuation metrics (Datastream UK index, as at 15 November 2017) |
||||||||||||||||||||||||||||||
|
|
||||||||||||||||||||||||||||||
|
Source: Thomson Datastream, Edison Investment Research |
|||||||||||||||||||||||||||||||
Fund profile: Long-term, high-conviction investment
Incorporated in 1926, FGT is a well-established investment trust, listed on the Main Market of the London Stock Exchange. Since 2000, FGT has been managed by Nick Train, a founder of specialist investment manager Lindsell Train. He aims to generate long-term growth in capital and income from a concentrated portfolio of primarily UK equities, although up to 20%, at the time of purchase, may be invested in overseas-listed companies. Over time, the size of the trust has grown significantly, due to capital appreciation and share issuance to meet ongoing investor demand; assets under management now exceed £1.2bn versus £64m in 2000. FGT is benchmarked against the FTSE All-Share index, with the portfolio generally comprising 25-30 positions of at least 1% unless they are in the process of being built up or sold. Normally, between 50% and 100% of the trust is invested in FTSE 100 companies and comparable companies on overseas stock exchanges, and at least 70% will be invested in FTSE 350 or similarly sized overseas companies. Up to 25% of gross assets may be held in preference shares, bonds and other debt instruments and although the manager prefers to be fully invested, up to 10% of the portfolio may be held in cash. Gearing of up to 25% of net assets is permitted; Train believes that a modest level of gearing should add value over the long term, and at end-September gearing was 2.0%. The manager regularly invests his own money in FGT, helping to ensure all shareholders’ interests are aligned.
The fund manager: Nick Train
The manager’s view: Encouraged by the level of M&A
Train says that the level of global mergers and acquisition (M&A) approaches is running at a 13% higher annualised rate in 2017 versus 2016, which itself was the second largest on record. He says that this year could end up at a similar or higher level than the record volumes in 2015, helped by an increase in the number of transactions in Asia. Train believes that the high level of M&A is very supportive for equity investors.
The manager suggests that when looking at M&A volumes, it is important to consider the deals that have been announced, rather than just completed deals, as it indicates the degree of purchasing interest, even if a deal falls through. A high-profile example of this is the February 2017 bid for Unilever by Kraft Heinz. If the deal had gone through, at c £120bn, it would have been the largest transaction in history. Train says that the valuation Kraft Heinz was prepared to pay for Unilever makes similar companies look undervalued. Other companies with similar emerging market exposure include portfolio holdings Burberry, Diageo and Heineken, as well as the holding that he has been adding most to during 2017, Mondelēz. Train suggests the world’s largest biscuit and chocolate manufacturer has ‘superb’ market positions in China and India, making it an appealing acquisition for a company looking to add exposure to those regions. The manager is grateful that the Unilever bid did not go through, as he would not want to lose direct investment in what he describes as an “exceptional and rare business”. He notes that Unilever has grown its annual dividends for 54 years at a compound rate of c 8% pa, adding that this has created enormous value for shareholders.
Asset allocation
Investment process: Long-term investment in quality brands
Train, like renowned US investor Warren Buffett, seeks to invest in “great companies and hold them forever”, by purchasing companies that are trading below his estimates of their long-term intrinsic values. The manager believes that good businesses are rare and deserving of higher valuations. Train invests on a bottom-up basis, seeking companies in three broad themes: global consumer brands, owners of media/software intellectual property, and capital market proxies. He selects businesses that are sufficiently durable to growth through different business cycles, with a high return on equity, and relatively low capital intensity/high cash flow generation.
FGT’s sector weightings are significantly different to those in the benchmark FTSE All-Share index. The average age of portfolio companies is 147 years, and c 50% of holdings are majority family-owned. Portfolio turnover is low, averaging c 5% pa. The recent purchase of a position in Manchester United was the first new holding since Rémy Cointreau in 2015 and Heineken in 2011. The last two complete sales were Thomson Reuters in 2016 and Marston’s in 2013; the majority of portfolio companies have been held for more than 10 years.
Current portfolio positioning
FGT’s portfolio is concentrated, with the top 10 holdings accounting for 75.8% at end-September 2017, versus 72.4% at end-September 2016. As shown in Exhibit 3, over the last 12 months the trust’s exposure to financials and consumer goods has increased modestly, while exposure to technology and consumer services has declined. The changing index weights are primarily due to the performances of individual stocks, rather than a conscious decision to change the shape of FGT’s portfolio. However, from a strategic perspective, over time, Train would like to increase the content/software exposure in FGT’s portfolio. He believes that companies in these areas have higher potential to deliver positive earnings surprises.
The recent purchase of a position in Manchester United (the first new holding since 2015) adds to the broad area of media/entertainment/information rights. The company has a number of revenue sources derived from the creation of excitement around its matches. It has a strong franchise, with a larger global following than any other football club; the company has done a good job of marketing its brand. Over the last 30 years, the amount that people are willing to pay to watch Manchester United play has consistently risen. Train says that at some point there may be a saturation point for TV sports rights, but he does not envisage it in the foreseeable future.
While there has been investor scepticism surrounding whether football clubs can be good investments, the manager notes that in 1993, Manchester United was valued at £20m, while it is currently listed on the New York Stock Exchange with a market cap of c $3bn. He says that over the last decade, there has been a truly global audience prepared to pay to see Manchester United play, commenting that “stuff that people enjoy is valuable”. Train says that it was a relief to make the investment in Manchester United as it is difficult to find creators/content of that calibre anywhere in the world, especially in the UK. He was able to get a large line of stock directly from part of the Glazer family, who are the controlling shareholders; the purchase was partly funded from a partial sale of Kraft Heinz. The manager acknowledges that Manchester United has not been as successful on the pitch in recent years as it was under manager Alex Ferguson. It needs to compete regularly with its major European rivals; Train suggests that a prolonged period of not being in top-flight European competitions could damage the value of the franchise.
As highlighted in the Manager’s view section, Train has been increasing the position in Mondelēz, a US multinational confectionery, food and beverage company. The stock has behaved poorly in 2017, falling by c 5% in a broader market that has risen by c 15%. The manager notes that branded packaged food companies, especially in the US, have had a tough time due to increased competition. However, Train believes that confectionery has a higher brand value than other food groups. He says there is evidence that consumers are intensely loyal to confectionery brands, and this loyalty transcends generations. As a result, the manager is using Mondelēz’s share price weakness as an opportunity to increase FGT’s position.
Exhibit 3: Portfolio sector exposure vs FTSE All-Share index (% unless stated)
Portfolio end- September 2017 |
Portfolio end- September 2016 |
Change |
Index |
Active weight |
Trust weight/ index weight (x) |
|
Consumer goods |
46.6 |
46.1 |
0.5 |
15.7 |
30.9 |
3.0 |
Financials |
25.4 |
22.2 |
3.2 |
26.4 |
(1.0) |
1.0 |
Consumer services |
20.1 |
21.8 |
(1.7) |
11.0 |
9.1 |
1.8 |
Technology |
7.9 |
9.9 |
(2.0) |
1.1 |
6.8 |
6.9 |
Telecommunications |
0.0 |
0.0 |
0.0 |
3.6 |
(3.6) |
0.0 |
Utilities |
0.0 |
0.0 |
0.0 |
3.0 |
(3.0) |
0.0 |
Basic materials |
0.0 |
0.0 |
0.0 |
7.2 |
(7.2) |
0.0 |
Healthcare |
0.0 |
0.0 |
0.0 |
8.5 |
(8.5) |
0.0 |
Industrials |
0.0 |
0.0 |
0.0 |
11.3 |
(11.3) |
0.0 |
Oil & gas |
0.0 |
0.0 |
0.0 |
12.2 |
(12.2) |
0.0 |
100.0 |
100.0 |
100.0 |
Source: Finsbury Growth & Income Trust, Edison Investment Research
The manager notes that his last three new positions are listed overseas (Manchester United, Rémy Cointreau and Heineken) as there are no comparable listed companies in the UK. This brings FGT’s overseas-listed exposure close to its 20% limit. However, Train does not believe that the current 20% overseas exposure limit is constraining investment performance and there continue to be attractive investment opportunities in the UK.
Performance: Building on long-term, positive record
Following a period of weak relative performance in 2016 as a result of strong share price appreciation in more cyclical parts of the market, which FGT is not exposed to, the manager is once again building on his successful long-term track record. Over the last 12 months, FGT’s NAV and share price total returns of 18.3% and 18.4% respectively, are meaningfully ahead of the benchmark’s 13.4% total return.
|
Exhibit 4: Investment trust performance to 31 October 2017 |
|
Price, NAV and benchmark total return performance, one-year rebased |
Price, NAV and benchmark total return performance (%) |
|
|
|
Source: Thomson Datastream, Edison Investment Research. Note: Three, five and 10-year performance figures annualised. |
|
FGT’s relative returns are shown in Exhibit 5. The trust has outperformed the FTSE All-Share index benchmark over all periods shown in both NAV and share price terms. The trust’s NAV has outperformed by more than 4% over one year and an average of 6.6%, c 7.6% and c 8.1% over the last three, five and 10 years respectively.
|
Exhibit 5: Share price and NAV total return performance, relative to indices (%) |
||||||||
|
One month |
Three months |
Six months |
One year |
Three years |
Five years |
10 years |
|
Price relative to FTSE All-Share |
2.0 |
1.1 |
3.1 |
4.4 |
21.1 |
38.4 |
84.1 |
|
NAV relative to FTSE All-Share |
2.7 |
1.3 |
3.2 |
4.3 |
19.8 |
37.9 |
80.6 |
|
Price relative to FTSE 350 |
2.0 |
1.1 |
3.1 |
4.6 |
21.5 |
39.4 |
84.8 |
|
NAV relative to FTSE 350 |
2.7 |
1.3 |
3.2 |
4.6 |
20.3 |
38.9 |
81.3 |
|
Price relative to MSCI World |
0.9 |
0.2 |
2.1 |
4.3 |
2.4 |
4.3 |
27.2 |
|
NAV relative to MSCI World |
1.6 |
0.5 |
2.1 |
4.2 |
1.4 |
4.0 |
24.8 |
|
|
Source: Thomson Datastream, Edison Investment Research. Note: Data to end-October 2017. Geometric calculation. |
||||||||
|
Exhibit 6: NAV total return performance relative to benchmark over 10 years, rebased to 100 |
||||||||
|
||||||||
|
Source: Thomson Datastream, Edison Investment Research |
||||||||
Capital structure and fees
FGT is a conventional investment trust, with one class of share in issue. There are currently 161.1m ordinary shares outstanding. On 4 October 2016, the board renewed its debt arrangements with Scotiabank for a further three years, increasing the revolving credit facility (RCF) from £50m to £75m at a reduced interest rate (Libor plus 1.05% versus Libor plus 1.30%). FGT also has an additional £25m accordion option. If the £75m RCF was fully drawn down, gearing would be c 6%. Net gearing was 2% at end-September 2017.
In FY17, FGT reduced its fee structure. Effective since 11 October 2016, portfolio manager Lindsell Train is paid an annual management fee of 0.450% of FGT’s market cap up to £1bn, and 0.405% of market cap above £1bn; no performance fee is payable. This compares to a previous flat fee of 0.450% of market cap. Frostrow Capital is the appointed Alternative Investment Fund Manager and provides company management, secretarial, administrative and marketing services. It receives an annual fee of 0.150% of FGT’s market cap up to £1bn, and 0.135% of market cap above £1bn. Historically, Frostrow was paid £70,000 per annum plus 0.150% of FGT’s market cap; the £70,000 fixed fee ceased on 30 September 2017. In FY16, FGT’s ongoing charges were 0.7%, which was a 10bp reduction versus FY15.
Dividend policy and record
FGT pays semi-annual dividends in May and October. The declared FY17 dividend of 14.2p is an 8.4% increase versus the prior financial year, which is higher than the 7.7% compound annual growth over the last five years. The manager is encouraged by the level of FGT’s dividend growth, as the latest increase in the annual dividend took account of the 72% interim dividend cut at Pearson. Befitting a trust with a focus on capital growth as well as income, FGT’s current dividend yield is below its UK Equity Income peer group average (Exhibit 8).
Peer group comparison
The AIC UK Equity Income sector is one of the largest investment trust peer groups, comprising 24 funds that have a variety of mandates. Exhibit 8 shows the largest 12; they all have market caps greater than £300m. With a market cap of £1.2bn, FGT is the third-largest trust in the peer group. Over one year, its NAV total return ranks third out of 24 funds, which is 9.5pp above the whole sector average, despite having no exposure to more cyclical areas of the market, which have performed well, such as industrials and commodities. Over longer periods, FGT’s NAV total return is significantly higher than the whole sector averages, ranking second out of 24 funds over both three and five years (24.4pp and 45.0pp above average respectively) and first out of 22 funds over 10 years (126.4pp above average). FGT’s ongoing charge is lower than average, and no performance fee is payable. The trust has a lower-than-average level of gearing, and in line with its focus on both capital and income growth, its dividend yield is 2.5pp lower than average.
Exhibit 8: Selected peer group as at 15 November 2017
% unless stated |
Market cap £m |
NAV TR |
NAV TR |
NAV TR |
NAV TR |
Discount (ex-par) |
Ongoing charge |
Perf. |
Net gearing |
Dividend yield (%) |
Finsbury Growth & Income |
1,207.0 |
24.9 |
52.4 |
122.9 |
219.9 |
0.8 |
0.7 |
No |
102 |
1.9 |
City of London |
1,454.7 |
15.3 |
26.6 |
71.6 |
99.8 |
1.0 |
0.4 |
No |
106 |
4.1 |
Diverse Income Trust |
385.4 |
16.3 |
43.6 |
117.0 |
|
0.3 |
1.2 |
No |
100 |
3.2 |
Dunedin Income Growth |
383.0 |
14.6 |
20.6 |
54.4 |
63.1 |
(9.2) |
0.7 |
No |
113 |
4.6 |
Edinburgh Investment Trust |
1,351.1 |
10.0 |
27.3 |
84.8 |
110.6 |
(7.0) |
0.6 |
No |
112 |
3.7 |
F&C Capital & Income |
320.3 |
21.5 |
42.2 |
76.6 |
84.5 |
2.8 |
0.7 |
No |
104 |
3.3 |
JPMorgan Claverhouse |
384.6 |
19.6 |
31.7 |
86.9 |
90.5 |
(4.6) |
0.8 |
No |
112 |
3.5 |
Lowland |
408.8 |
18.4 |
35.6 |
92.2 |
123.9 |
(5.0) |
0.6 |
Yes |
110 |
3.5 |
Merchants Trust |
518.6 |
12.9 |
22.5 |
60.8 |
64.2 |
(6.9) |
0.6 |
No |
119 |
5.2 |
Murray Income Trust |
516.7 |
14.6 |
23.3 |
60.3 |
76.0 |
(7.0) |
0.7 |
No |
100 |
4.2 |
Perpetual Income & Growth |
907.6 |
9.8 |
17.7 |
80.4 |
124.3 |
(7.6) |
0.7 |
No |
114 |
3.7 |
Temple Bar |
850.6 |
13.1 |
24.7 |
67.0 |
135.0 |
(4.4) |
0.5 |
No |
95 |
3.3 |
Average (whole sector – 24 funds) |
416.3 |
15.4 |
28.0 |
77.9 |
93.5 |
0.7 |
1.4 |
114 |
4.4 |
|
Rank (whole sector – 24 funds) |
3 |
3 |
2 |
2 |
1 |
6 |
14 |
15 |
24 |
Source: Morningstar, Edison Investment Research. Note: Performance data to 14 November 2017. TR=total return. Net gearing is total assets less cash and equivalents as a percentage of net assets.
The board
Following the appointment of Kate Cornish-Bowden and Lorna Tilbian on 26 October 2017, there are now eight independent, non-executive directors on the board of FGT. Chairman Anthony Townsend was re-appointed in February 2005 and assumed his current role in January 2008. The other five directors and their dates of appointment are: John Allard and Vanessa Renwick (October 2000), David Hunt (July 2006), Neil Collins (January 2008) and Simon Hayes (June 2015). Cornish-Bowden has a background in investment management, including 12 years at Morgan Stanley Investment Management as managing director and head of the Global Core Equity team. Tilbian has a background in investment banking, including as an executive director at Numis. Their appointments are scheduled for shareholder ratification at FGT’s January 2018 AGM.
|
|
Investment Companies
Atossa Genetics reported Phase I data on its topical endoxifen formulation and it is now developing this as a potential treatment for high mammographic breast density (MBD), which is associated with increased breast cancer risk. The firm is also developing oral endoxifen for patients refractory to tamoxifen, and its intraductal microcatheter (IDMC), combined with established cancer drug fulvestrant. After also considering the recent $5.5m equity raise (at $0.44 per share), our rNPV-derived equity valuation is $24.6m (from $9.3m previously), or $0.93 per share.