Last close As at 05/08/2026
ZAR28.10
▲ 0.23 (0.83%)
Market capitalisation
ZAR11,853m
Research: TMT
Altron reported a 105% y-o-y increase in operating profit before capital items in H125, with margin expansion of 5.1pp to 9.8%. The Platforms businesses were particularly strong, with Netstar and FinTech achieving material revenue and profit growth. Altron Digital Business, still in the integration phase, saw some non-recurring costs and the shift of several project starts into H225, but has seen indications that performance should improve in FY26. Management raised its FY26 operating profit target, partly to reflect the inclusion of Altron Document Solutions (ADS) in continuing operations. We have upgraded our forecasts for continuing operations and the group, partly reflecting better performance in the Platforms business and partly factoring in reduced losses from discontinued operations.
Altron |
Further margin expansion in H125 |
H125 results |
Software and comp services |
22 November 2024 |
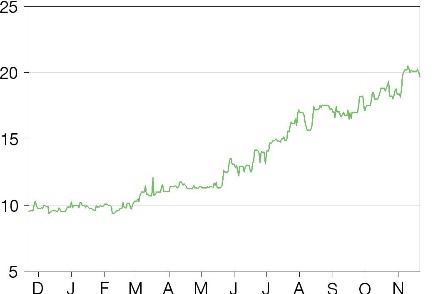
Share price performance
Business description
Next events
Analyst
Altron is a research client of Edison Investment Research Limited |
||||||||||||||||||||||||||||||||||||||||||
Altron reported a 105% y-o-y increase in operating profit before capital items in H125, with margin expansion of 5.1pp to 9.8%. The Platforms businesses were particularly strong, with Netstar and FinTech achieving material revenue and profit growth. Altron Digital Business, still in the integration phase, saw some non-recurring costs and the shift of several project starts into H225, but has seen indications that performance should improve in FY26. Management raised its FY26 operating profit target, partly to reflect the inclusion of Altron Document Solutions (ADS) in continuing operations. We have upgraded our forecasts for continuing operations and the group, partly reflecting better performance in the Platforms business and partly factoring in reduced losses from discontinued operations.
Year end |
Revenue* (ZARm) |
PBT** |
Diluted EPS** |
HEPS*** (ZAR) |
DPS |
P/E |
Yield |
02/23 |
8,445 |
482 |
0.88 |
0.85 |
0.35 |
22.7 |
1.8 |
02/24+ |
9,603 |
570 |
1.04 |
1.03 |
0.58 |
19.3 |
2.9 |
02/25e |
9,770 |
821 |
1.45 |
1.45 |
0.70 |
13.8 |
3.5 |
02/26e |
10,519 |
960 |
1.72 |
1.75 |
0.85 |
11.6 |
4.2 |
Note: *Continuing operations. **PBT and EPS are normalised, excluding amortisation of acquired intangibles and exceptional items, and are for continuing operations. ***Basic continuing headline EPS. +Restated to include ADS.
H125: Strong uplift in operating profit
In H125, reported operating profit from continuing operations grew 153% y-o-y, helped by a very strong performance from Netstar and FinTech in the Platforms division and a large improvement in profitability from the newly included ADS. Group HEPS increased from -ZAR0.65 to ZAR0.74, benefiting from continuing operations improvement and within discontinued operations, a material reduction in losses from Nexus. This supported a 60% uplift in the interim dividend to ZAR0.40.
Outlook: FY26 operating profit target raised
Management raised the FY26 continuing operations operating profit target from ZAR1.1bn to ZAR1.15bn, partly to reflect the inclusion of ADS in continuing operations. Our FY25 forecasts reflect stronger FinTech profitability partially offset by the weakness in Altron Digital Business. FY26 forecasts reflect stronger profitability for FinTech and Netstar, partially offset by a slightly weaker performance in IT Services. We reduce our forecasts for losses in Nexus in both years. Overall, this results in upgrades to continuing basic HEPS of 12.6% in FY25 and 10.5% in FY26 and to group HEPS of 26.8% in FY25 and 8.9% in FY26.
Valuation: Undervalued versus international peers
The stock has gained 80% since the FY24 results in May. We have updated our sum-of-the-parts valuation to reflect our revised forecasts. After a 30% holding company/South Africa discount, we arrive at a valuation of ZAR25/share, 25% above the current share price. In our view, evidence of continued progress towards the FY26 operating profit target, including a recovery in Altron Digital Business margins, and clarity over the Nexus discontinued business should drive share price upside.
Review of H125 results
We summarise Altron’s H125 results in Exhibit 1. Comparatives have been restated to include ADS in continuing operations. Revenue declined 1.7% y-o-y; excluding ATM revenues (the business was sold in H124), revenue increased 5.4% y-o-y. Annuity revenue, which made up 63% of the total, increased 12% y-o-y or 19% excluding ATM. EBITDA before capital items increased 49% y-o-y (or 53% excluding the ATM contribution), helped by strong growth in Netstar and FinTech and a return to profitability for ADS, and the EBITDA margin expanded 6.3pp to 18.6%. Operating profit before capital items increased 105% (116% excluding ATM) and the operating margin increased 5.1pp to 9.8%. This supported a 182% increase in HEPS for continuing operations. The loss from discontinued operations reduced significantly, taking group HEPS from -ZAR0.65 in H124 to ZAR0.74 in H125. Company adjusted net debt reduced 44% to ZAR312m. Adjusted to exclude back-to-back rental finance advances in ADS, Altron had a net cash position of ZAR93m at the end of H125, resulting in net debt/EBITDA of -0.06x. The company announced an interim dividend of ZAR0.4, up 60% y-o-y.
Exhibit 1: H125 results highlights
ZARm |
H124 |
H125 |
y-o-y |
Revenues |
4,951 |
4,868 |
-2% |
EBITDA |
607 |
905 |
49% |
EBITDA margin |
12.3% |
18.6% |
6.3pp |
Normalised operating profit |
244 |
490 |
101% |
Normalised operating margin |
4.9% |
10.1% |
5.1pp |
Operating profit before capital items |
233 |
477 |
105% |
Operating margin |
4.7% |
9.8% |
5.1pp |
Reported operating profit |
181 |
458 |
153% |
Reported operating margin |
3.7% |
9.4% |
5.8pp |
Normalised PBT |
179 |
449 |
151% |
Reported PBT |
116 |
417 |
259% |
Normalised net income - continuing operations |
95 |
309 |
225% |
Reported net income |
(315) |
276 |
-188% |
Normalised basic EPS - continuing operations (ZAR) |
0.25 |
0.81 |
224% |
Normalised diluted EPS - continuing operations (ZAR) |
0.25 |
0.79 |
218% |
Headline basic EPS - continuing operations (ZAR) |
0.28 |
0.79 |
182% |
Headline basic EPS - discontinued operations (ZAR) |
(0.93) |
(0.05) |
-95% |
Headline basic EPS - group (ZAR) |
(0.65) |
0.74 |
-214% |
Headline diluted EPS - continuing operations (ZAR) |
0.28 |
0.77 |
179% |
Headline diluted EPS - discontinued operations (ZAR) |
(0.92) |
(0.05) |
-95% |
Headline diluted EPS - group (ZAR) |
(0.64) |
0.72 |
-212% |
Reported basic EPS (ZAR) |
(0.87) |
0.70 |
-180% |
Reported basic EPS – continuing operations (ZAR) |
0.15 |
0.75 |
401% |
Dividend per share (ZAR) |
0.25 |
0.40 |
60% |
Net debt - as reported |
541 |
200 |
-63% |
Net debt - company adjusted* |
558 |
312 |
-44% |
Source: Altron, Edison Investment Research. Note: *Excludes net cash in discontinued operations and cash held for merchants.
Divisional performance
Exhibits 2 and 3 below show performance by business line in H125. As announced in July, the company has brought ADS back into continuing operations within IT Services; H124 results have been restated accordingly.
Exhibit 2: Revenue by division, H125 – continuing operations
ZARm |
H124 |
H125 |
y-o-y |
IT Services |
|||
Altron Digital Business |
1,879 |
1,619 |
-13.8% |
Altron Security |
281 |
247 |
-12.1% |
Altron Document Solutions |
659 |
731 |
10.9% |
2,819 |
2,597 |
-7.9% |
|
Own Platforms |
|||
Netstar |
1,019 |
1,135 |
11.4% |
FinTech |
552 |
607 |
10.0% |
HealthTech |
190 |
201 |
5.8% |
1,761 |
1,943 |
10.3% |
|
Distribution |
|||
Altron Arrow |
424 |
376 |
-11.3% |
Corporate/consolidation |
(53) |
(48) |
-9.4% |
Total revenue |
4,951 |
4,868 |
-1.7% |
Total adjusted revenue |
4,618 |
4,868 |
5.4% |
Source: Altron. Note: Adjusted revenue excludes ATM revenue of ZAR333m in H124.
Exhibit 3: H125 EBITDA and operating profit - continuing operations
ZARm |
H124 |
H125 |
y-o-y |
H124 |
H125 |
y-o-y |
|
EBITDA before capital items |
EBITDA margin |
||||||
IT Services |
|||||||
Altron Digital Business |
96 |
47 |
-51.0% |
5.1% |
2.9% |
-2.2pp |
|
Altron Security |
80 |
80 |
0.0% |
28.5% |
32.4% |
3.9pp |
|
Altron Document Solutions |
(123) |
30 |
124.4% |
-18.7% |
4.1% |
22.8pp |
|
53 |
157 |
196.2% |
1.9% |
6.0% |
4.2pp |
||
Own Platforms |
|||||||
Netstar |
364 |
489 |
34.3% |
35.7% |
43.1% |
7.3pp |
|
FinTech |
151 |
232 |
53.6% |
27.4% |
38.2% |
10.9pp |
|
HealthTech |
53 |
55 |
3.8% |
27.9% |
27.4% |
-0.5pp |
|
568 |
776 |
36.6% |
32.3% |
39.9% |
7.7pp |
||
Distribution |
|||||||
Altron Arrow |
38 |
35 |
-6.7% |
9.0% |
9.3% |
0.3pp |
|
Corporate/consolidation |
(52) |
(63) |
21.2% |
N/A |
N/A |
||
Total EBITDA |
607 |
905 |
49.1% |
12.3% |
18.6% |
6.3pp |
|
Total adjusted EBITDA |
590 |
905 |
53.4% |
12.8% |
18.6% |
5.8pp |
|
Operating profit before capital items |
Operating margin |
||||||
H124 |
H125 |
y-o-y |
H124 |
H125 |
y-o-y |
||
IT Services |
|||||||
Altron Digital Business |
73 |
34 |
-53.4% |
3.9% |
2.1% |
-1.8pp |
|
Altron Security |
65 |
66 |
1.5% |
23.1% |
26.7% |
3.6pp |
|
Altron Document Solutions |
(135) |
20 |
114.8% |
-20.5% |
2.7% |
23.2pp |
|
3 |
120 |
N/A |
0.1% |
4.6% |
4.5pp |
||
Own Platforms |
|||||||
Netstar |
101 |
146 |
44.6% |
9.9% |
12.9% |
3.0pp |
|
FinTech |
132 |
215 |
62.9% |
23.9% |
35.4% |
11.5pp |
|
HealthTech |
50 |
54 |
8.0% |
26.3% |
26.9% |
0.5pp |
|
283 |
415 |
46.6% |
16.1% |
21.4% |
5.3pp |
||
Distribution |
|||||||
Altron Arrow |
37 |
35 |
-5.4% |
8.7% |
9.2% |
0.4pp |
|
Corporate/consolidation |
(90) |
(93) |
3.3% |
N/A |
N/A |
||
Total operating profit |
233 |
477 |
104.7% |
4.7% |
9.8% |
5.1pp |
|
Total adjusted operating profit |
221 |
477 |
115.8% |
4.8% |
9.8% |
5.0pp |
|
Source: Altron. Note: Adjusted EBITDA and operating profit exclude the contribution from ATM in H124.
IT Services – mixed performance
Altron Digital Business – first time reporting as one entity
Altron Digital Business comprises the three businesses that were previously reported separately – Altron Managed Solutions, Altron Systems Integration and Altron Karabina. Since 1 March, the businesses have been combined to create one entity. As part of this process, the business has developed a unified sales strategy that has better price discipline and has incentives aligned to company objectives. In H125, the division incurred non-recurring costs of ZAR16m relating to low-margin contracts, two customers reduced their spend and three material projects were delayed (ZAR18m impact on EBITDA), although these have since started in H225. Revenue declined 14% y-o-y; once the ATM business is excluded, revenue increased 5% y-o-y, with annuity revenues making up 50% of the total. Excluding ATM, EBITDA declined 42% y-o-y, resulting in a 46% decline in operating profit with an operating margin of 2.1%. Despite the weaker-than-expected performance in H125, management pointed to several leading indicators that bode well for H225 and onwards. Upselling and cross-selling to the existing customer base have improved, there has been a 6% increase in new annuity contracts signed and an 87% increase in the annuity pipeline.
Altron Security – revenue mix masks underlying performance
Revenue declined 12% y-o-y while EBITDA was flat y-o-y. Operating profit grew 1.5% y-o-y and the margin increased 3.6pp to 26.7%. Management noted that one large customer reduced its capex plans. It also sold a higher proportion of net revenue accounted software (deemed sold on an agency rather than principal basis), which has the effect of reducing absolute revenues but increasing profit margins as it is recorded at a gross margin of 100%. At the FY24 results, the company noted that it had taken corrective action to protect gross margin and manage expenses; this also contributed to the margin expansion. Annuity revenues increased to 84% of revenue from 69% a year ago.
ADS – first-time inclusion
Revenue increased 10.9% y-o-y, helped by new customer wins and higher public sector contracting, and EBITDA improved from a loss of ZAR123m in H124 to positive ZAR30m in H125. This resulted in the operating margin increasing from -20.5% to 2.7% over the year. We would expect the decision to bring ADS back into continuing operations to help in the renewals process, giving existing customers comfort that they will continue to work with the same team and that ADS will continue to invest in the business.
Platforms – firing on all cylinders
Netstar – growing market share in consumer and enterprise
The business continued to make good progress in improving operational performance and growing revenue. Revenue was 11% higher year-on-year, helped by 21% growth in subscribers to nearly 1.9 million and 26% growth in connected devices to 2.4m. Churn of 17% was slightly higher than the 16% reported in FY24, but in line with guidance. The retention rate was above 90%, pre-fitment conversion was above 60% and contract fulfilment was above 90% (10 new fitment centre partnerships were signed). The business opened its new global fleet bureau in April which is already tracking more than 30,000 assets and recently launched FleetAI software, a fleet management system for corporate customers. The business recently won a contract with Orica, a provider of mining and infrastructure solutions, to provide a full managed service which includes AI cameras and asset management across Africa and Europe. EBITDA increased 34% y-o-y expanding the margin by 7.3pp to 43.1%. Reflecting the higher level of depreciation due to the growth in subscribers (tracking devices are depreciated over three years), operating profit increased 44.6% y-o-y and the operating margin increased 3.0pp to 12.9%. Annuity revenues increased to 90% from 87% a year ago. The business added new strategic partnerships, including 17 insurers and 16 motor dealers. Netstar estimates that it is gaining market share in South Africa. Future growth is focused on growing the enterprise side of the business, winning more fleet managed services contracts and expanding further outside of South Africa, particularly in Asia-Pacific where it is already active in Malaysia, Thailand and Australia.
Altron FinTech – debit volume growth
Revenue increased 10.0% y-o-y and EBITDA increased 53.6% y-o-y, resulting in margin expansion of 10.9pp to 38.2%. Operating profit increased 62.9% and the operating margin expanded 11.5pp to 35.4% helped by a higher margin annuity mix (82% versus 69% in H124) and a 5% reduction in operating expenses. The main growth driver was a 33% increase in collections and payments revenue, helped by a 17% increase in the customer base and an 18% increase in the value of debit orders processed after a period of focus on SME customers. The business continued to upsell value-added services such as strike date adoption.
Altron HealthTech – increasing focus on corporate customers
Revenue increased 6% y-o-y, EBITDA increased 4% and operating profit 8%. The operating margin increased 0.5pp to 26.9%. The business signed up 504 net new practice management customers, with 1.7 customers added for every customer churned, although revenue from practice management was flat y-o-y. The business added seven new corporate customers, driving corporate revenue up 22% y-o-y. The business expensed ZAR15m of platform investment (vs ZAR5m a year ago). It is focused on building its data business, providing AI-driven data insights and in H125, 18 new practices signed up for HealthTech’s oncology solution. Annuity revenues remained high at 92% of divisional revenue.
Altron Arrow – profitability maintained despite tough market
The joint venture saw a previously flagged revenue decline of 11.3%, reflecting a cyclical downturn in the industry. However, EBITDA was down by only 6.7% and operating profit by 5.4%, resulting in operating margin expansion of 0.4pp to 9.2%.
Discontinued operations – losses reduced significantly
With ADS now back in continuing operations, Altron Nexus is the only business included in discontinued operations. In H125, it generated revenue of ZAR236m (-49% y-o-y), LBITDA of ZAR14m and an operating loss of ZAR14m. In total, discontinued operations contributed a net loss of ZAR22m, greatly reduced from ZAR385m in H124.
Outlook and changes to forecasts
Management has updated its medium-term outlook, partly to reflect the inclusion of ADS in continuing operations (see Exhibit 4), taking its FY26 operating profit target from ZAR1.1bn to ZAR1.15bn. Post the election and creation of the government of national unity, the company has not yet seen a noticeable uptick in customer demand but sees opportunity if the digitisation agenda is followed. Management is focused on controlling what it can and providing continuity for its customers.
|
Exhibit 4: Management guidance |
|
|
Source: Altron |
At a business line level, management aims to maintain Altron HealthTech, Altron FinTech and Altron Security margins at current levels, while targeting Netstar margins of 16%. Within IT Services, the company is targeting operating margins of 6–8% for Altron Digital Business and c 7% for the whole division. As there is a global ongoing correction in demand in Altron Arrow’s market, we are forecasting a revenue decline in FY25 but management is aiming to maintain the operating margin.
We have revised our forecasts to reflect H125 results and to include ADS in continuing operations. For FY25, we have increased our operating profit before capital items forecast by 7.6%, reflecting better profitability from the FinTech business and the inclusion of ADS, partially offset by weaker profitability in Altron Digital Business. For FY26, we have increased our operating profit before capital items forecast by 9.5%, reflecting better profitability from Netstar and FinTech and the inclusion of ADS, partially offset by weaker profitability in Altron Security. We are forecasting operating profit before capital items of ZAR1.06bn in FY26, slightly below management’s target. We have reduced our expectations for losses in Nexus, the remaining business in discontinued operations. This results in HEPS from continuing operations increasing by 12.6% in FY25 and 10.5% in FY26 and group HEPS increasing by 26.8% in FY25 and 8.9% in FY26. With the dividend payout policy set at 50% of HEPS from continuing operations, this also drives up our dividend forecasts.
Exhibit 5: Changes to forecasts
FY25e |
FY26e |
||||||||
ZARbn |
Old |
New |
Change |
y-o-y |
Old |
New |
Change |
y-o-y |
|
Revenues |
8,403.6 |
9,770.5 |
16.3% |
1.7% |
9,075.9 |
10,518.9 |
15.9% |
7.7% |
|
EBITDA |
1,710.6 |
1,782.5 |
4.2% |
24.0% |
1,971.9 |
2,065.9 |
4.8% |
15.9% |
|
EBITDA margin |
20.4% |
18.2% |
-2.1% |
3.3% |
21.7% |
19.6% |
-2.1% |
1.4% |
|
Normalised operating profit |
844.8 |
903.1 |
6.9% |
33.2% |
986.7 |
1,068.0 |
8.2% |
18.3% |
|
Normalised operating margin |
10.1% |
9.2% |
-0.8% |
2.2% |
10.9% |
10.2% |
-0.7% |
0.9% |
|
Reported operating profit |
802.8 |
849.1 |
5.8% |
37.8% |
954.7 |
1,031.0 |
8.0% |
21.4% |
|
Reported operating margin |
9.6% |
8.7% |
-0.9% |
2.3% |
10.5% |
9.8% |
-0.7% |
1.1% |
|
Normalised PBT |
724.8 |
821.1 |
13.3% |
44.1% |
870.7 |
960.0 |
10.3% |
16.9% |
|
Reported PBT |
682.8 |
767.1 |
12.3% |
51.0% |
838.7 |
923.0 |
10.0% |
20.3% |
|
Normalised net income – continuing operations |
508.4 |
568.2 |
11.8% |
41.3% |
611.5 |
673.3 |
10.1% |
18.5% |
|
Reported net income |
336.4 |
423.3 |
25.8% |
-349.0% |
489.5 |
531.0 |
8.5% |
25.4% |
|
Normalised basic EPS – continuing operations (ZAR) |
1.34 |
1.50 |
11.8% |
41.2% |
1.61 |
1.78 |
10.1% |
18.5% |
|
Normalised diluted EPS – continuing operations (ZAR) |
1.31 |
1.45 |
10.9% |
40.2% |
1.57 |
1.72 |
9.3% |
18.5% |
|
Headline basic EPS – continuing operations (ZAR) |
1.29 |
1.45 |
12.6% |
40.4% |
1.59 |
1.75 |
10.5% |
20.9% |
|
Headline basic EPS – discontinued operations (ZAR) |
(0.35) |
(0.26) |
-25.1% |
-80.1% |
(0.24) |
(0.29) |
19.4% |
11.3% |
|
Headline basic EPS – group (ZAR) |
0.94 |
1.19 |
26.8% |
-516.1% |
1.34 |
1.46 |
8.9% |
23.0% |
|
Headline diluted EPS – continuing operations (ZAR) |
1.25 |
1.40 |
11.8% |
39.3% |
1.55 |
1.70 |
9.7% |
20.9% |
|
Headline diluted EPS – discontinued operations (ZAR) |
(0.34) |
(0.25) |
-25.6% |
-80.2% |
(0.24) |
(0.28) |
18.5% |
11.3% |
|
Headline diluted EPS – group (ZAR) |
0.91 |
1.15 |
25.8% |
-513.1% |
1.31 |
1.41 |
8.1% |
23.0% |
|
Reported basic EPS (ZAR) |
0.89 |
1.12 |
25.8% |
-348.9% |
1.29 |
1.40 |
8.5% |
25.4% |
|
Dividend per share (ZAR) |
0.63 |
0.70 |
11.8% |
20.8% |
0.77 |
0.85 |
9.7% |
20.9% |
|
Net debt – group |
552.5 |
488.1 |
-11.6% |
56.0% |
634.1 |
534.5 |
-15.7% |
9.5% |
|
Net debt – company adjusted |
41.5 |
392.1 |
845.3% |
80.7% |
123.1 |
438.5 |
256.2% |
11.8% |
|
Source: Edison Investment Research
Exhibit 6: Financial summary
ZAR m |
2019 |
2020 |
2021 |
2022 |
2023 |
2024 |
2025e |
2026e |
||
28-February |
IFRS |
IFRS |
IFRS |
IFRS |
IFRS |
IFRS |
IFRS |
IFRS |
||
INCOME STATEMENT |
||||||||||
Revenue |
|
|
15,723.0 |
7,383.0 |
7,505.0 |
7,930.0 |
8,445.0 |
9,603.0 |
9,770.5 |
10,518.9 |
Costs |
(14,116.0) |
(6,283.0) |
(6,472.0) |
(6,790.0) |
(7,194.0) |
(8,166.0) |
(7,988.0) |
(8,453.0) |
||
EBITDA |
|
|
1,607.0 |
1,100.0 |
1,033.0 |
1,140.0 |
1,251.0 |
1,437.0 |
1,782.5 |
2,065.9 |
Normalised operating profit |
|
|
1,041.0 |
456.0 |
371.0 |
518.0 |
621.0 |
678.0 |
903.1 |
1,068.0 |
Amortisation of acquired intangibles |
0.0 |
0.0 |
0.0 |
(20.0) |
(22.0) |
(27.0) |
(27.0) |
(17.0) |
||
Exceptionals/capital items |
(26.0) |
1.0 |
(23.0) |
(213.0) |
(59.0) |
(35.0) |
(27.0) |
(20.0) |
||
Reported operating profit |
1,015.0 |
457.0 |
348.0 |
285.0 |
540.0 |
616.0 |
849.1 |
1,031.0 |
||
Net Interest |
(176.0) |
(255.0) |
(179.0) |
(146.0) |
(142.0) |
(110.0) |
(82.0) |
(108.0) |
||
Joint ventures & associates (post tax) |
(1.0) |
(30.0) |
(41.0) |
3.0 |
3.0 |
2.0 |
0.0 |
0.0 |
||
Profit Before Tax (norm) |
|
|
864.0 |
171.0 |
151.0 |
375.0 |
482.0 |
570.0 |
821.1 |
960.0 |
Profit Before Tax (reported) |
|
|
838.0 |
172.0 |
128.0 |
142.0 |
401.0 |
508.0 |
767.1 |
923.0 |
Reported tax |
(158.0) |
(50.0) |
(34.0) |
(63.0) |
(105.0) |
(121.0) |
(213.5) |
(249.2) |
||
Profit After Tax (norm) |
701.1 |
121.3 |
110.9 |
208.6 |
355.8 |
425.2 |
592.5 |
698.1 |
||
Profit After Tax (reported) |
680.0 |
122.0 |
94.0 |
79.0 |
296.0 |
387.0 |
553.6 |
673.8 |
||
Minority interests |
(39.0) |
20.0 |
12.0 |
(9.0) |
(17.0) |
(23.0) |
(24.3) |
(24.8) |
||
Discontinued operations |
70.0 |
506.0 |
12,048.0 |
(174.0) |
(283.0) |
(534.0) |
(106.0) |
(118.0) |
||
Net income (normalised) |
662.1 |
141.3 |
122.9 |
199.6 |
338.8 |
402.2 |
568.2 |
673.3 |
||
Net income (reported) |
711.0 |
648.0 |
12,154.0 |
(104.0) |
(4.0) |
(170.0) |
423.3 |
531.0 |
||
Basic ave. number of shares outstanding (m) |
371.0 |
371.2 |
371.6 |
371.9 |
377.3 |
378.6 |
378.7 |
378.7 |
||
EPS - diluted normalised (ZAR) |
|
|
1.77 |
0.38 |
0.33 |
0.53 |
0.88 |
1.04 |
1.45 |
1.72 |
EPS - basic reported (ZAR) |
|
|
1.92 |
1.75 |
32.70 |
(0.28) |
(0.01) |
(0.45) |
1.12 |
1.40 |
EPS headline basic (ZAR) |
|
|
1.91 |
1.73 |
1.35 |
0.37 |
0.29 |
(0.29) |
1.19 |
1.46 |
Dividend (ZAR) |
0.44 |
0.55 |
1.44 |
0.30 |
0.35 |
0.58 |
0.70 |
0.85 |
||
Revenue growth (%) |
-53.0% |
1.7% |
5.7% |
6.5% |
13.7% |
1.7% |
7.7% |
|||
EBITDA Margin (%) |
10.2% |
14.9% |
13.8% |
14.4% |
14.8% |
15.0% |
18.2% |
19.6% |
||
Normalised Operating Margin |
6.6% |
6.2% |
4.9% |
6.5% |
7.4% |
7.1% |
9.2% |
10.2% |
||
BALANCE SHEET |
||||||||||
Fixed Assets |
|
|
4,171.0 |
4,550.0 |
3,793.0 |
3,965.0 |
4,013.0 |
4,561.0 |
4,807.0 |
5,023.7 |
Intangible Assets |
2,048.0 |
2,159.0 |
1,623.0 |
1,918.0 |
2,105.0 |
2,258.0 |
2,394.9 |
2,516.0 |
||
Tangible Assets |
1,109.0 |
1,655.0 |
1,719.0 |
1,476.0 |
1,346.0 |
1,575.0 |
1,684.1 |
1,779.7 |
||
Investments & other |
1,014.0 |
736.0 |
451.0 |
571.0 |
562.0 |
728.0 |
728.0 |
728.0 |
||
Current Assets |
|
|
7,430.0 |
9,063.0 |
6,592.0 |
5,404.0 |
5,649.0 |
4,802.0 |
4,671.6 |
4,841.7 |
Stocks |
1,017.0 |
1,252.0 |
833.0 |
972.0 |
1,023.0 |
971.0 |
952.2 |
996.4 |
||
Debtors |
4,725.0 |
5,726.0 |
2,497.0 |
1,961.0 |
2,055.0 |
2,185.0 |
2,248.5 |
2,420.8 |
||
Cash & cash equivalents |
1,381.0 |
1,810.0 |
1,454.0 |
757.0 |
740.0 |
1,140.0 |
964.9 |
918.5 |
||
Other (including assets held for sale) |
307.0 |
275.0 |
1,808.0 |
1,714.0 |
1,831.0 |
506.0 |
506.0 |
506.0 |
||
Current Liabilities |
|
|
(6,804.0) |
(7,360.0) |
(3,753.0) |
(2,917.0) |
(3,274.0) |
(3,331.0) |
(3,251.5) |
(3,331.0) |
Creditors |
(5,026.0) |
(5,705.0) |
(2,319.0) |
(1,853.0) |
(1,964.0) |
(2,321.0) |
(2,241.5) |
(2,321.0) |
||
Tax and social security |
(80.0) |
(110.0) |
(28.0) |
(77.0) |
(103.0) |
(127.0) |
(127.0) |
(127.0) |
||
Short term borrowings |
(1,665.0) |
(1,347.0) |
(710.0) |
(244.0) |
(62.0) |
(708.0) |
(708.0) |
(708.0) |
||
Lease liabilities |
0.0 |
(181.0) |
(108.0) |
(117.0) |
(111.0) |
(85.0) |
(85.0) |
(85.0) |
||
Other (including liabilities held for sale) |
(33.0) |
(17.0) |
(588.0) |
(626.0) |
(1,034.0) |
(90.0) |
(90.0) |
(90.0) |
||
Long Term Liabilities |
|
|
(1,424.0) |
(2,502.0) |
(1,766.0) |
(2,098.0) |
(2,088.0) |
(1,955.0) |
(1,955.0) |
(1,955.0) |
Long term borrowings |
(1,262.0) |
(1,707.0) |
(602.0) |
(854.0) |
(851.0) |
(649.0) |
(649.0) |
(649.0) |
||
Lease liabilities |
0.0 |
(391.0) |
(971.0) |
(896.0) |
(788.0) |
(741.0) |
(741.0) |
(741.0) |
||
Other long term liabilities |
(162.0) |
(404.0) |
(193.0) |
(348.0) |
(449.0) |
(565.0) |
(565.0) |
(565.0) |
||
Net Assets |
|
|
3,373.0 |
3,751.0 |
4,866.0 |
4,354.0 |
4,300.0 |
4,077.0 |
4,272.1 |
4,579.3 |
CASH FLOW |
||||||||||
Op Cash Flow before WC and tax |
1,095.0 |
1,084.0 |
968.0 |
440.0 |
346.0 |
188.0 |
787.1 |
951.0 |
||
Working capital |
(406.0) |
(254.0) |
393.0 |
(44.0) |
194.0 |
579.0 |
(124.2) |
(136.9) |
||
Exceptional & other |
656.0 |
865.0 |
859.0 |
672.0 |
755.0 |
845.0 |
578.3 |
669.8 |
||
Tax |
(147.0) |
(169.0) |
(226.0) |
(94.0) |
(50.0) |
(131.0) |
(223.5) |
(259.2) |
||
Net operating cash flow |
|
|
1,198.0 |
1,526.0 |
1,994.0 |
974.0 |
1,245.0 |
1,481.0 |
1,017.7 |
1,224.6 |
Capex |
(283.0) |
(258.0) |
(484.0) |
(396.0) |
(473.0) |
(567.0) |
(603.4) |
(646.4) |
||
Acquisitions/disposals |
81.0 |
184.0 |
309.0 |
(76.0) |
(76.0) |
27.0 |
0.0 |
0.0 |
||
Net interest |
(196.0) |
(231.0) |
(165.0) |
(127.0) |
(127.0) |
(104.0) |
(80.0) |
(106.0) |
||
Equity financing |
0.0 |
0.0 |
0.0 |
0.0 |
0.0 |
0.0 |
0.0 |
0.0 |
||
Dividends |
(111.0) |
(274.0) |
(220.0) |
(442.0) |
(152.0) |
(170.0) |
(276.5) |
(274.6) |
||
Other |
(438.0) |
(648.0) |
(432.0) |
(408.0) |
(361.0) |
(304.0) |
(265.0) |
(265.0) |
||
Net Cash Flow |
251.0 |
299.0 |
1,002.0 |
(475.0) |
56.0 |
363.0 |
(207.1) |
(67.3) |
||
Opening net debt/(cash) |
|
|
2,033.0 |
1,623.0 |
1,336.0 |
453.0 |
811.0 |
563.0 |
312.0 |
487.1 |
FX |
27.0 |
24.0 |
29.0 |
(3.0) |
11.0 |
(6.0) |
32.0 |
21.0 |
||
Other non-cash movements |
132.0 |
(36.0) |
(148.0) |
120.0 |
181.0 |
(106.0) |
0.0 |
0.0 |
||
Closing net debt/(cash) - company adjusted |
|
1,623.0 |
1,336.0 |
453.0 |
811.0 |
563.0 |
312.0 |
487.1 |
533.5 |
|
Closing net debt/(cash) - as reported |
|
1,546.0 |
1,244.0 |
(142.0) |
341.0 |
173.0 |
217.0 |
392.1 |
438.5 |
|
Source: Altron accounts, Edison Investment Research. Note: *Excludes net cash in discontinued operations and cash held for merchants.
|
|
Research: Metals & Mining
Sayona Mining is a lithium producer and explorer with projects in Canada, Western Australia and soon in the US and Ghana. A proposed merger of equals with Piedmont Lithium will create a c A$1bn mid-tier lithium player with streamlined asset ownership and significant growth optionality. Sayona and Piedmont’s Canadian and US projects comprise one of the largest advanced hard rock lithium resources in North America and are strategically positioned to supply the region’s growing lithium demand. Following the proposed equity raises, the company will be well capitalised to execute on its growth plans. As a producer, Sayona should also benefit strongly from inevitable recovery in lithium prices, with additional upside coming from the potential downstream expansion.