Last close As at 05/08/2026
AUD0.04
— 0.00 (−2.33%)
Market capitalisation
AUD160m
Research: Healthcare
Actinogen announced a capital increase of up to A$8.9m on 3 May, consisting of a A$5.0m (gross) placement along with a shareholder rights offering (‘entitlement offer’) designed to raise up to A$3.9m (gross) from existing shareholders. The closing date of the rights offer is 29 May and, given that Actinogen shares are currently trading at c A$0.028, we assume full exercise of the rights offering in Q424 (Q2 CY24). The company expects that the proceeds (assuming full exercise of the rights offering) will extend its operating runway beyond the interim results release of the first 100 patients of the XanaMIA Phase IIb study in cognitive impairment (CI) in patients with mild-to-moderate Alzheimer’s disease (AD), expected in mid-CY25. These results and the results from the XanaCIDD Phase IIa study in patients with CI associated with major depressive disorder (MDD), expected in early Q3 CY24, represent major potential value inflection points, and Actinogen is now funded past these two key catalysts. Our risk-adjusted net present value (rNPV) is A$544m (vs A$528m previously).
Actinogen Medical |
Funding in place through key catalysts |
Financing and clinical update |
Pharma and biotech |
15 May 2024 |
Share price performance
Business description
Next events
Analyst
Actinogen Medical is a research client of Edison Investment Research Limited |
|||||||||||||||||||||||||||||||||||||||||||||||||||||
Actinogen announced a capital increase of up to A$8.9m on 3 May, consisting of a A$5.0m (gross) placement along with a shareholder rights offering (‘entitlement offer’) designed to raise up to A$3.9m (gross) from existing shareholders. The closing date of the rights offer is 29 May and, given that Actinogen shares are currently trading at c A$0.028, we assume full exercise of the rights offering in Q424 (Q2 CY24). The company expects that the proceeds (assuming full exercise of the rights offering) will extend its operating runway beyond the interim results release of the first 100 patients of the XanaMIA Phase IIb study in cognitive impairment (CI) in patients with mild-to-moderate Alzheimer’s disease (AD), expected in mid-CY25. These results and the results from the XanaCIDD Phase IIa study in patients with CI associated with major depressive disorder (MDD), expected in early Q3 CY24, represent major potential value inflection points, and Actinogen is now funded past these two key catalysts. Our risk-adjusted net present value (rNPV) is A$544m (vs A$528m previously).
Year |
Revenue |
PBT* |
EPS* |
DPS |
P/E |
Yield |
06/22 |
3.6 |
(7.9) |
(0.005) |
0.0 |
N/A |
N/A |
06/23 |
4.9 |
(8.9) |
(0.005) |
0.0 |
N/A |
N/A |
06/24e |
7.9 |
(14.0) |
(0.006) |
0.0 |
N/A |
N/A |
06/25e |
7.7 |
(13.7) |
(0.005) |
0.0 |
N/A |
N/A |
Note: *PBT and EPS are normalised, excluding amortisation of acquired intangibles, exceptional items and share-based payments. EPS are fully diluted.
XanaCIDD Phase IIa data expected in early Q3 CY24
The next material milestone will be results (expected in early Q3 CY24) from the Phase IIa XanaCIDD study in patients with CI and MDD. Actinogen reported in April that enrolment had been completed (n=167). Further, a pooled blinded analysis from the first 148 patients showed an improvement in all three computerised tests that comprise the primary (Cogstate Attention composite) endpoint (vs baseline). These indications are supportive of the prospect that there may be a treatment-related effect on these cognitive and depression measures, although we caution that this does not rule out the possibility of improvements also being shown in the placebo arm. We are optimistic about the XanaCIDD outcome, given that the drug has already shown positive cognitive effects in healthy adults in prior CI studies.
XanaMIA Phase IIb study underway
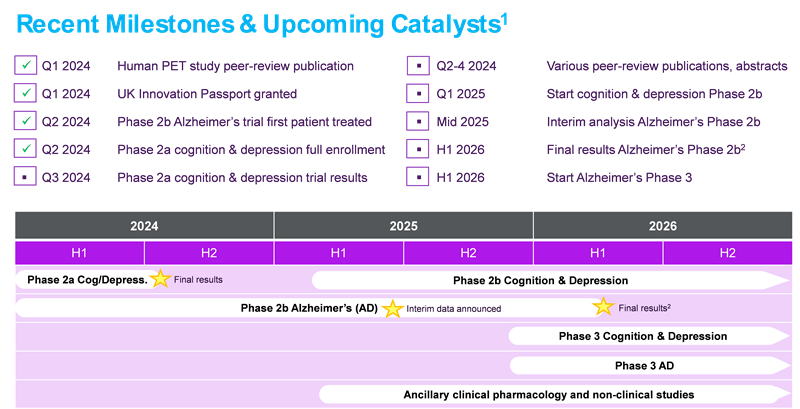
The first randomised patient in the Phase IIb XanaMIA trial of Xanamem in lead indication AD received their first treatment on 12 April. Interim results from the first c 100 patients are expected in mid-CY25, and management expects to report final results (on c 220 patients, including from US trial sites) in H1 CY26.
Valuation: Revision upwards to A$544m
We have rolled forward our estimates and now obtain a total pre-financing equity valuation of A$543.9m (vs A$527.8m previously), or A$0.23 per share (unchanged). However, if we assume the placement is completed and the rights offer is subscribed in full (total A$8.9m), the equity valuation per share would be reduced to A$0.21 given the additional 355.1m shares that would be issued.
Details of financial offering
Actinogen announced a capital increase of up to A$8.9m on 3 May, consisting of binding commitments from sophisticated and institutional investors for a share placement totalling A$5.0m (gross) along with a shareholder rights offering (‘entitlement offer’) designed to raise up to A$3.9m (gross) from existing shareholders. The placement calls for the issuance of 200m new shares at A$0.025/share, reflecting a 21% discount to the 30-day volume-weighted average price (VWAP) prior to the announcement of A$0.032/share. Under the entitlement offer, existing Actinogen shareholders will receive, for every 15 shares held at the record date (10 May), a share purchase right to purchase one new common share at a similar purchase price of A$0.025/share, resulting in the issuance of up to 155.1m new shares (A$3.9m). In total, the combination of the placement and entitlement offer, if fully subscribed, will lead to the issuance of 355.1m new shares, or A$8.9m (before issuance costs), resulting in a 15.3% increase in shares outstanding (to 2.682bn), excluding considerations for the attached 36-month share purchase options to be issued as part of this financing. In effect, for both the placement and the entitlement offer, subscribers will receive one new 36-month share purchase option for every two new shares issued, at an exercise price of A$0.05 per share. Hence, up to a maximum of 177.6m share purchase options will be issued as part of this financing and their exercise in full would generate an additional A$8.9m in gross proceeds for Actinogen.
The closing date of the rights offer is 29 May and the newly issued shares are expected to be tradeable as of 6 June. Given that Actinogen shares are currently trading at c A$0.028/share, we believe it is likely the rights issue will be fully subscribed. Hence, our financial model now includes an assumption for the full exercise of the A$8.9m rights offer in Q424 (Q2 CY24).
Funds raised from the capital increase will be applied to progressing the XanaMIA Phase IIb trial in patients with mild-moderate AD, and for general working capital purposes. Importantly, the company expects that the proceeds (assuming full exercise of the rights offering but not the attached share purchase options) will extend the company’s operating runway beyond the interim results release in the first 100 patients, expected in mid-CY25.
XanaCIDD data readout expected in early Q3 CY24
The next material milestone for Actinogen will be the results, expected in early Q3 CY24, from its Phase IIa XanaCIDD study assessing lead candidate Xanamem in patients with CI and MDD. As a reminder, Xanamem’s intended mechanism of action is to penetrate the brain and then inhibit the enzyme 11β-Hydroxysteroid dehydrogenase type 1 (11β-HSD1). Much scientific literature suggests that excessive cortisol is associated with CI in patients with various chronic conditions, including age-related CI and AD. As the naturally present enzyme 11β-HSD1 normally converts cortisone to cortisol inside cells, Xanamem is designed to reduce excessive cortisol production in the brain.
Actinogen reported in April that enrolment had been completed, with 167 participants recruited (exceeding the initial target of 160) in the double-blinded placebo-controlled study across sites in the UK and Australia.
|
Exhibit 1: XanaCIDD study design |
|
|
Source: Actinogen capital raising presentation, May 2024. Note: *Same attention and working memory tests shown to demonstrate Xanamem effect in the XanaHES and XanaMIA Part A trials. |
In the trial, patients are administered Xanamem at a daily dose of 10mg or a placebo for six weeks in addition to their existing anti-depression treatment. The study assesses cognitive improvement, using the Cogstate Cognitive Test Battery, and evaluates depression changes through the Montgomery-Asberg Depression Rating Scale (MADRS). Results will include measures after six weeks of treatment as well as at a four-week follow-up period after the conclusion of treatment. The primary endpoint is the Cogstate Cognitive Test Battery Attentional composite, which assesses attention and working memory.
Blinded pooled XanaCIDD data trending in the right direction
Actinogen recently reported interim preliminary pooled blinded data from the XanaCIDD study, from the first 148 randomised participants. The data remains pooled and blinded from both the treatment and the placebo arms, so the company and its investigators are not aware of any data or trends attributable to any particular cohort (treatment vs placebo) and also as to whether there is any separation in results between the two arms. Effectively, trial personnel and investigators will only know which patient received treatment vs placebo at the end of the study (after the final study efficacy measures have been recorded). Nonetheless, the pooled data includes interim aggregate measures of the primary endpoint (‘Attention Composite’, which consists of three computerised reaction time tests) and of secondary endpoints, including MADRS, other executive function and memory cognitive composites and responder analyses.
The company reported the pooled blinded analysis showed an improvement in all three computerised tests that comprise the primary (Cogstate Attention composite) endpoint (vs baseline) as well as a 32% change from baseline in the MADRS score (vs baseline). These indications are supportive of the prospect that there may be a treatment-related effect on these cognitive and depression measures, although we caution that there is no assurance that this is necessarily the case, as it remains possible that the placebo arm could be demonstrating improvements in these measures and/or that there may not be a substantial difference between the treatment and placebo arms.
However, supporting the prospect that Xanamem may be providing a treatment-related effect are considerations that the pooled cognitive improvements shown to date (in the primary endpoint) are greater than the company’s assessment of placebo groups in other trials (such as: LaMonica et al 2018 and Lim et al 2013). The differences between the arms will only be revealed in early Q3 CY24 when the company reports the primary results of the study. Actinogen also reported that the preliminary safety profile remains excellent, with no serious adverse events related to treatment, and the preliminary assessment of data quality found no concerning trends by country or trial site.
Altogether, we remain constructive on the XanaCIDD outcome given the reported pooled data thus far and also given that the drug has already shown positive cognitive effects in healthy adults in prior studies (XanaHES, XanaMIA Phase Ib portion).
Positive results from the trial could lead the company to advance Xanamem into a Phase IIb study for patients with CI and/or depression, which it expects to start in H1 CY25, and which could potentially serve as one of the two pivotal studies required for regulatory approval. The company plans to start the subsequent Phase III study (which could be the final study required for approval in CI-MDD) in H1 CY26.
XanaMIA Phase IIb in AD now in progress
The first randomised patient in Actinogen’s Phase IIb XanaMIA trial of Xanamem in lead indication AD received their first treatment on Friday 12 April. This study is designed to enrol c 220 patients with CI associated with biomarker-positive mild-to-moderate AD, as confirmed through an elevated level of phosphorylated Tau-181 (pTau-181) protein in their blood at baseline. Study patients are being randomised to take Xanamem 10mg or placebo once daily for 36 weeks.
The study has commenced at 13 Australian sites and will concentrate on domestic sites for the first c 100 patients, and initial efficacy and safety results will be analysed when these patients reach 24 weeks of treatment. As mentioned above, the company expects to report these results in mid-CY25 and Actinogen expects to expand the trial to US study sites following this interim readout. Actinogen expects to report final results in H1 CY26 (our model continues to assume these results in CY26).
|
Exhibit 2: XanaMIA Phase IIb study design |
|
|
Source: Actinogen capital raising presentation, May 2024. Note: NIA-AA = National Institute on Aging – Alzheimer’s Association. CDR-SB = Clinical Dementia Rating Scale – sum of boxes. |
The design of the XanaMIA Phase IIb study is informed by a subset analysis reported in Q4 CY22 in 34 patients with elevated pTau-181 blood levels from the previous 185-patient XanADu trial in mild AD. This subset of patients (16 on Xanamem 10mg daily, 18 on placebo) with biomarker-positive AD (pTau of at least 6.74pg/mL) showed clinical activity and a relatively large effect size at 12 weeks using the FDA-recognised CDR-SB scale.
If XanaMIA Phase IIb results are positive, the next step would be a Phase III study (which we assume would serve as one of the two registrational trials required for US approval). The company is projecting that it can start a Phase III study in AD in H1 CY26 and we anticipate it would require an additional confirmatory Phase III study prior to receiving marketing approval in AD.
|
Exhibit 3: Upcoming catalysts and timing expectations for Actinogen |
|
|
Source: Actinogen capital raising presentation, May 2024. Note: 1. Indicative clinical programme timelines subject to change. 2. Assumes additional US Sites can be added from 2024. |
For the CI-MDD indication, as stated above, if the XanaCIDD results are positive, the company expects to start a Phase IIb study in H1 CY25, and potentially start the Phase III registrational study in H1 CY26.
We continue to estimate potential Xanamem commercialisation in AD and MDD indications in CY29 and CY28, respectively.
Financials
Actinogen reported in its recent 4C quarterly update (for the three months ending 31 March 2024) a quarterly operating cash burn rate of A$5.41m, driven by R&D spending of A$4.33m, resulting in a period-end gross cash position of A$6.26m (down from A$11.45m at 31 December 2023). R&D spending was largely directed towards the ongoing Xanamem studies (XanaCIDD and XanaMIA Phase IIb) and the Q324 spending rate was comparable to that of H124 (as R&D spending in the first nine months of FY24 was A$12.5m).
As stated above, our financial model now includes an assumption for the full exercise of the A$8.9m rights offer in Q424 (Q2 CY24). With the company now guiding for completion of interim XanaMIA Phase IIb data in mid-CY25 (vs H1 CY25 when we published our prior update note), we have pushed back our timing forecast for the ramping up of costs associated with expanding this study to sites outside of Australia (particularly in the US), to H1 FY26 (H2 CY25), versus H1 CY25 previously. Further, the company has now clarified that its expectation for Xanamem in CI-MDD, assuming positive XanCIDD results, would be to proceed with a Phase IIb trial in CY25 (which we estimate would be c 150–200 patients), rather than a larger Phase III study (which we estimate could comprise up to 400 or more patients). As a result we have also pushed back our near- to medium-term R&D cost expenditures (in FY25 and FY26) for the CI-MDD indication as well, while maintaining our commercial launch timing forecasts for both indications.
We now project FY24 and FY25 R&D expenses A$16.2m and A$15.9m, versus our prior estimates of A$17.7m and A$49.2m. We now anticipate FY25 R&D spending to decline slightly year-on-year given that management expects the XanaCIDD study to conclude in early Q125 (Q3 CY24), and given, as stated above, we expect the XanaMIA Phase IIb study to consist entirely of Australian test sites in FY25, which carries a much lower overhead cost for the company than the global and US sites that will start to be included after the interim readout in mid-CY25 (end-FY25). We expect R&D costs to ramp up significantly (more than double) in FY26 as US sites enrol and as the company may begin Phase III pivotal studies in AD and CI-MDD.
Given the material reduction in anticipated FY25 R&D spending, our R&D tax credit revenue estimate also declines notably for this year, noting that through H128, the only source of revenue we assume for Actinogen will be R&D tax credits and related grants and rebates. For FY24, we have slightly increased our R&D tax credit revenue estimate as we now expect the full 48.5% of FY24 R&D expenses to be eligible for Australian government-related tax rebates.
Exhibit 4: Changes to Actinogen forecasts
All amounts in millions of A$ |
FY24e (prior) |
FY24e (new) |
Difference (%) |
FY25e (prior) |
FY25e (new) |
Difference (%) |
R&D tax credits, grants and related revenue |
7.72 |
7.86 |
1.85 |
20.30 |
7.72 |
(61.98) |
Net R&D expenditures |
17.69 |
16.21 |
(8.36) |
49.23 |
15.91 |
(67.68) |
EBITDA |
(16.54) |
(14.71) |
(11.08) |
(35.22) |
(13.97) |
(60.34) |
Net cash flows from operations |
(19.18) |
(13.32) |
(30.57) |
(50.29) |
(12.40) |
(75.35) |
Free cash flow |
(19.85) |
(13.49) |
(32.04) |
(51.38) |
(13.12) |
(74.47) |
Source: Edison Investment Research
After considering results from the quarterly update, the company’s new guidance (for funds on hand post the A$8.9m financing to maintain operations into H2 CY25) and our material reductions in near-term R&D spending estimates (particularly for FY25), we have lowered our near-term operating cash burn estimates. We now expect FY24 and FY25 operating burn rates of A$13.3m and A$12.4m, versus our projections of A$19.2m and A$50.3m previously.
Assuming completion of the current share placing and rights offering, we expect the company’s cash on hand to fund operations into FY26 (H2 CY25). We continue to project that the company will receive R&D research tax credits (which correspond to up to 48.5% of R&D costs incurred in the prior fiscal year) from the Australian government.
We continue to forecast a potential launch timeline for Xanamem in patients with AD in CY29 and assume commercialisation of the drug for patients with MDD in CY28. Our base-case projection assumes that Actinogen will independently fund all studies needed for regulatory approval in these indications. We also have adjusted our model to reflect the A$0.66/US$ exchange rate (versus A$0.65/US$ previously).
Following anticipated completion of the A$8.9m equity funding and rights offering, we now assume the total projected future funding need to launch Xanamem in these indications and obtain recurring operating profitability will be A$360m, down from A$420m previously. The reduction in our expectations for Xanamem R&D costs to commercialisation in CI-MDD drives the lowering of our future funding need assumptions, given that, as stated above, we now assume that, subsequent to XanaCIDD, a smaller Phase IIb study starting in CY25 will comprise one of the two subsequent studies to support a registration application; in other words, instead of conducting two Phase III trials in CI-MDD, we now expect Actinogen to pursue a Phase IIb (starting in CY25) study and a larger Phase III trial (starting in CY26).
We also highlight the optionality that positive data from XanaCIDD could entail. Positive results could potentially result in a share price re-rating that may facilitate future fund-raising activities. To this end, the timing of the expansion of the XanaMIA Phase IIb study (to sites outside Australia) could potentially occur earlier than the planned interim analysis for XanaMIA Phase IIb (in mid-CY25, as discussed above). Effectively, if positive data from in the XanaCIDD study (by Q3 CY24) results in a share price re-rating that enables Actinogen to raise additional funding, it may be in a position to expand the XanaMIA Phase IIb study to US and global study sites earlier than the company’s current expectation of H2 CY25.
Valuation
Our valuation is based on an rNPV analysis, which includes A$6.26m in net cash at end-March 2024. We apply a discount rate of 12.5% and include Xanamem in the two lead indications. We continue to use a probability of success of 10% for Xanamem to reach the market in the AD indication and 12.5% in the MDD indication. Given that the share placement and rights offering has not yet concluded (and no new shares have been issued), our valuation is based on the existing number of shares outstanding and the March 2024 net cash position. We have rolled forward our estimates and now obtain a total pre-financing equity valuation of A$543.9m (vs A$527.8m previously), or A$0.23 per share (unchanged).
However, if we assume the placement is completed and the rights offer is subscribed in full (total A$8.9m), the equity valuation per share would be reduced to A$0.21 given the additional 355.1m shares that would be issued.
Exhibit 5: Actinogen rNPV valuation
Product |
Market |
Launch |
Sales in 2034 (A$m) |
NPV |
Probability of success |
rNPV |
rNPV/basic share (A$) |
Xanamem in cognitive impairment related to Alzheimer's disease |
US |
CY29 |
3,493 |
3,279.5 |
10.0% |
272.4 |
0.12 |
EU5 & Australia |
CY29 |
1,653 |
1,606.7 |
10.0% |
160.7 |
0.07 |
|
Xanamem in cognitive impairment related to major depressive disorder |
US |
CY28 |
1,138 |
947.4 |
12.5% |
87.0 |
0.04 |
EU5 & Australia |
CY28 |
664 |
584.5 |
12.5% |
73.1 |
0.03 |
|
Corporate costs |
|
|
(55.5) |
100% |
(55.5) |
(0.02) |
|
Net cash at 31 March 2024 |
|
|
6.3 |
6.3 |
0.00 |
||
Total equity value |
6,369.0 |
543.9 |
0.23 |
Source: Edison Investment Research
We believe market participants will be keen to observe whether the Phase IIb XanaMIA portion, which prospectively enrols patients with elevated pTau, will confirm the positive efficacy findings shown in the XanADu subset biomarker analysis from the earlier XanADu study. Given the widespread economic and social costs of AD and the limitations of current approved treatments, we anticipate positive Phase IIb data, even at the interim readout (in mid-CY25), could introduce the possibility of material out-licensing or value realisation opportunities.
As stated earlier, we forecast A$360m in additional financing (after the A$8.9m offering) will be required before FY29 to fund the development of both the CI-MDD and AD programmes, after which, provided it receives regulatory approval, Actinogen should be able to generate sufficient operating revenues to reach recurring profitability. Our model assumes all financing will be raised through illustrative debt, as per usual Edison methodology. If our projected funding need of A$320m is raised through equity issuances at the prevailing market price of c A$0.028, our effective valuation would decrease to A$0.06 per share.
The amount of fund-raising estimated to be necessary for Actinogen to independently bring Xanamem to commercialisation in these indications is larger than the company’s current market capitalisation. However, we note that the funding intervals may be staggered over the next several years, which may alleviate potential challenges associated with raising funds in excess of a company’s market capitalisation. We also believe Actinogen will seek non-dilutive funding arrangements and/or partnership arrangements, which may reduce the overall funding need, but such scenarios are not included in our forecasts. Hence, while our base case modelling scenario assumes internal Xanamem development for the AD and CI-MDD programmes, if the company is successful in securing licensing deal(s) for Xanamem with an established biopharma company (or companies), then our R&D expenditure requirements for Actinogen, and, consequently, our overall funding need projections, would likely be significantly reduced.
Considering that AD pivotal trials are reported to cost more per patient than studies in nearly any other therapeutic area, we believe Actinogen will likely accelerate efforts to attain partnerships or non-dilutive funding strategies if the XanaCIDD data (expected in early Q3 CY24) or interim XanaMIA Phase IIb data (expected in mid-CY25) are supportive.
Exhibit 6: Financial summary
A$’000s |
2020 |
2021 |
2022 |
2023 |
2024e |
2025e |
||
Year end 30 June |
IFRS |
IFRS |
IFRS |
IFRS |
IFRS |
IFRS |
||
PROFIT & LOSS |
||||||||
Revenue |
|
|
3,516 |
1,984 |
3,640 |
4,888 |
7,863 |
7,716 |
Cost of Sales |
0 |
0 |
0 |
0 |
0 |
0 |
||
Gross Profit |
3,516 |
1,984 |
3,640 |
4,888 |
7,863 |
7,716 |
||
Sales, General & Administrative |
(2,962) |
(3,111) |
(4,558) |
(6,568) |
(6,357) |
(5,777) |
||
Net Research & Development |
(5,537) |
(2,406) |
(8,215) |
(8,900) |
(16,212) |
(15,909) |
||
EBITDA |
|
|
(4,983) |
(3,533) |
(9,133) |
(10,580) |
(14,706) |
(13,970) |
Amortisation of intangible assets |
(314) |
(313) |
(313) |
(313) |
(236) |
(236) |
||
Depreciation & other |
(99) |
(74) |
(88) |
(93) |
(100) |
(186) |
||
Normalised Operating Profit (ex. amort, SBC, except.) |
(4,888) |
(3,318) |
(7,933) |
(9,156) |
(14,226) |
(14,156) |
||
Operating profit before exceptionals |
(5,396) |
(3,920) |
(9,533) |
(10,985) |
(15,042) |
(14,392) |
||
Exceptionals including asset impairment |
0 |
0 |
0 |
0 |
0 |
0 |
||
Other |
(194) |
(289) |
(1,288) |
(1,517) |
(580) |
0 |
||
Reported Operating Profit |
(5,590) |
(4,209) |
(10,821) |
(12,502) |
(15,622) |
(14,392) |
||
Net Finance income (costs) |
65 |
5 |
36 |
233 |
268 |
426 |
||
Profit Before Tax (norm) |
|
|
(4,822) |
(3,313) |
(7,897) |
(8,923) |
(13,958) |
(13,729) |
Profit Before Tax (FRS 3) |
|
|
(5,331) |
(3,915) |
(9,497) |
(10,752) |
(14,774) |
(13,965) |
Tax |
0 |
0 |
0 |
0 |
0 |
0 |
||
Profit After Tax and minority interests (norm) |
(4,822) |
(3,313) |
(7,897) |
(8,923) |
(13,958) |
(13,729) |
||
Profit After Tax and minority interests (FRS 3) |
(5,331) |
(3,915) |
(9,497) |
(10,752) |
(14,774) |
(13,965) |
||
Average Basic Number of Shares Outstanding (m) |
1,118.0 |
1,405.2 |
1,717.1 |
1,806.0 |
2,249.2 |
2,682.0 |
||
EPS - normalised (A$) |
|
|
(0.004) |
(0.002) |
(0.005) |
(0.005) |
(0.006) |
(0.005) |
EPS - normalised and fully diluted (A$) |
|
(0.004) |
(0.002) |
(0.005) |
(0.005) |
(0.006) |
(0.005) |
|
EPS - (IFRS) (A$) |
|
|
(0.005) |
(0.003) |
(0.006) |
(0.006) |
(0.007) |
(0.005) |
Dividend per share (A$) |
0.0 |
0.0 |
0.0 |
0.0 |
0.0 |
0.0 |
||
BALANCE SHEET |
||||||||
Fixed Assets |
|
|
3,772 |
3,287 |
2,889 |
2,520 |
2,360 |
2,660 |
Intangible Assets |
3,346 |
3,033 |
2,720 |
2,408 |
2,172 |
2,436 |
||
Tangible Assets |
19 |
17 |
13 |
113 |
188 |
224 |
||
Investments in long-term financial assets |
408 |
237 |
156 |
0 |
0 |
0 |
||
Current Assets |
|
|
8,164 |
15,091 |
20,417 |
12,688 |
17,818 |
3,553 |
Short-term investments |
0 |
0 |
0 |
0 |
0 |
0 |
||
Cash |
5,040 |
13,457 |
16,370 |
8,460 |
13,573 |
455 |
||
Other |
3,123 |
1,634 |
4,047 |
4,228 |
4,245 |
3,098 |
||
Current Liabilities |
|
|
(744) |
(755) |
(1,480) |
(1,802) |
(2,186) |
(2,186) |
Creditors |
(744) |
(755) |
(1,480) |
(1,802) |
(2,186) |
(2,186) |
||
Short term borrowings |
0 |
0 |
0 |
0 |
0 |
0 |
||
Long Term Liabilities |
|
|
(304) |
(165) |
(87) |
0 |
0 |
0 |
Long term borrowings |
0 |
0 |
0 |
0 |
0 |
0 |
||
Other long term liabilities |
(304) |
(165) |
(87) |
0 |
0 |
0 |
||
Net Assets |
|
|
10,889 |
17,458 |
21,740 |
13,407 |
17,992 |
4,027 |
CASH FLOW STATEMENT |
|
|
|
|
|
|
|
|
Operating Income |
(5,590) |
(4,209) |
(10,821) |
(12,502) |
(15,622) |
(14,392) |
||
Movements in working capital |
(3,591) |
(1,513) |
(3,143) |
132 |
540 |
1,147 |
||
Net interest and financing income (expense) |
65 |
5 |
36 |
233 |
268 |
426 |
||
Depreciation & other |
99 |
74 |
88 |
93 |
100 |
186 |
||
Taxes and other adjustments |
6,161 |
3,920 |
4,323 |
3,346 |
1,396 |
236 |
||
Net Cash Flows from Operations |
|
(2,856) |
(1,724) |
(9,517) |
(8,698) |
(13,318) |
(12,396) |
|
Capex |
(23) |
(6) |
(3) |
(37) |
(175) |
(722) |
||
Acquisitions/disposals |
0 |
0 |
0 |
0 |
0 |
0 |
||
Interest received & other investing activities |
0 |
0 |
0 |
(0) |
0 |
0 |
||
Net Cash flows from Investing activities |
|
(23) |
(6) |
(3) |
(37) |
(175) |
(722) |
|
Net proceeds from share issuances |
0 |
10,195 |
12,491 |
903 |
18,668 |
0 |
||
Net movements in long-term debt |
0 |
0 |
0 |
0 |
0 |
0 |
||
Dividends |
0 |
0 |
0 |
0 |
0 |
0 |
||
Other financing activities |
282 |
(84) |
(71) |
(78) |
(42) |
0 |
||
Net Cash flows from financing activities |
282 |
10,111 |
12,420 |
825 |
18,625 |
0 |
||
Effects of FX on Cash & equivalents |
0 |
0 |
49 |
0 |
(19) |
0 |
||
Net Increase (Decrease) in Cash & equivalents |
(2,596) |
8,381 |
2,949 |
(7,910) |
5,113 |
(13,118) |
||
Cash & equivalents at beginning of period |
7,637 |
5,040 |
13,422 |
16,370 |
8,460 |
13,573 |
||
Cash & equivalents at end of period |
5,040 |
13,422 |
16,370 |
8,460 |
13,573 |
455 |
||
Closing net debt/(cash) |
|
|
(5,448) |
(13,694) |
(16,527) |
(8,460) |
(13,573) |
(455) |
Lease debt |
390 |
236 |
165 |
87 |
45 |
45 |
||
Closing net debt/(cash) inclusive of IFRS 16 lease debt |
(5,058) |
(13,458) |
(16,361) |
(8,373) |
(13,529) |
(410) |
||
Free cash flow |
(2,878) |
(1,730) |
(9,520) |
(8,735) |
(13,493) |
(13,118) |
||
Source: Edison Investment Research, company reports
|
|
Research: Investment Companies
With a focus on long-term growth, Henderson Opportunities Trust (HOT) seeks investment opportunities across the breadth of the UK market. This includes a strong bias towards smaller and earlier-stage companies with significant potential to become tomorrow’s leading British businesses. There are tentative signs that the significant three-year underperformance of these smaller companies, and of HOT, may be coming to an end. If so, the trust is well placed to benefit and its differentiated, truly all-market approach is one that many investors would struggle to replicate. Moreover, HOT’s size and permanent capital base means that it can act nimbly in less liquid parts of the market and take a patient approach.