Last close As at 05/08/2026
AUD0.04
— 0.00 (−2.33%)
Market capitalisation
AUD157m
Research: Healthcare
Having shown cognitive activity in prior trials, Actinogen began its XanaMIA Phase IIb study of lead candidate Xanamem in patients with cognitive impairment (CI) associated with mild-to-moderate Alzheimer’s disease (AD). The study will assess c 220 biomarker-positive AD patients, with interim results expected in H1 CY25. Actinogen recently reported results from a human positron emission tomography (PET) imaging study, which affirm the drug’s mechanism of action (MoA) in healthy subjects and patients with AD, by showing that Xanamem exhibited high target enzyme occupancy designed to impede cortisol production, as well as favourable safety and tolerability. Our risk-adjusted net present value (rNPV) remains essentially unchanged at A$528m.
Actinogen Medical |
Pressing forward with Xanamem |
Pipeline update |
Pharma and biotech |
29 February 2024 |
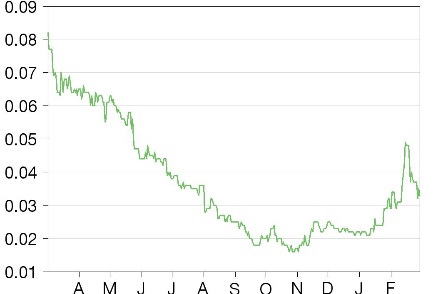
Share price performance
Business description
Next events
Analyst
Actinogen Medical is a research client of Edison Investment Research Limited |
|||||||||||||||||||||||||||||||||||||||||||||||||||||
Having shown cognitive activity in prior trials, Actinogen began its XanaMIA Phase IIb study of lead candidate Xanamem in patients with cognitive impairment (CI) associated with mild-to-moderate Alzheimer’s disease (AD). The study will assess c 220 biomarker-positive AD patients, with interim results expected in H1 CY25. Actinogen recently reported results from a human positron emission tomography (PET) imaging study, which affirm the drug’s mechanism of action (MoA) in healthy subjects and patients with AD, by showing that Xanamem exhibited high target enzyme occupancy designed to impede cortisol production, as well as favourable safety and tolerability. Our risk-adjusted net present value (rNPV) remains essentially unchanged at A$528m.
Year |
Revenue |
PBT* |
EPS* |
DPS |
P/E |
Yield |
06/22 |
3.6 |
(7.9) |
(0.005) |
0.0 |
N/A |
N/A |
06/23 |
4.9 |
(8.9) |
(0.005) |
0.0 |
N/A |
N/A |
06/24e |
7.7 |
(15.8) |
(0.008) |
0.0 |
N/A |
N/A |
06/25e |
20.3 |
(37.9) |
(0.016) |
0.0 |
N/A |
N/A |
Note: *PBT and EPS are normalised, excluding amortisation of acquired intangibles, exceptional items and share-based payments. EPS are fully diluted.
XanaCIDD Phase IIa data expected in Q2 CY24
In our view, the next material milestone for Actinogen will be results (expected in Q2 CY24) from its Phase IIa XanaCIDD study in patients with CI and major depressive disorder (MDD). Enrolment of the study (six weeks of treatment) recently exceeded 75% (of a planned 160 participants) and we are optimistic about the XanaCIDD outcome, given that the drug has already shown positive cognitive effects in healthy adults in prior studies (XanaHES, XanaMIA Phase Ib portion). Positive data could trigger a re-rating and accelerate capital raising opportunities and/or an expansion of the Phase IIb XanaMIA study to global study sites.
UK Innovation Passport provides vote of confidence
In February 2024, the UK Medicines and Healthcare products Regulatory Agency (MHRA) accepted Actinogen’s application for an Innovation Passport as part of the UK’s Innovative Licensing and Access Pathway (ILAP) for Xanamem in the treatment of AD. The ILAP pathway could accelerate the UK regulatory approval process once pivotal trials are completed and allows for expanded UK regulatory and stakeholder input. We believe the ILAP attainment provides external validation of Xanamem’s mechanism of action and the AD data to date.
Valuation: Minor adjustments
We project Actinogen’s cash balance of A$11.5m (Q4 CY23) provides a cash runway into Q424 (Q2 CY24) and assume it will need to raise A$15m in H224 (vs A$20m previously). We believe Actinogen is also seeking non-dilutive funding arrangements, which may reduce its funding needs. We revised our forex assumptions, reduced our near-term R&D expenditure forecasts and raised our R&D tax rebates estimates. Our total rNPV valuation is essentially unchanged at A$528m. The per share valuation is now A$0.23 (vs A$0.24 previously), with the decrease attributable to the increased share count.
Published PET study affirms Xanamem’s mechanism
Xanamem’s intended MoA is to penetrate the brain and then inhibit the enzyme 11β-Hydroxysteroid dehydrogenase type 1 (11β-HSD1). Much scientific literature suggests that excessive cortisol is associated with CI in patients with various chronic conditions, including age-related CI and AD. As the naturally present enzyme 11β-HSD1 normally converts cortisone to cortisol inside cells, Xanamem is designed to reduce excessive cortisol production in the brain. A recently published article in the Journal of Alzheimer’s Disease affirmed Xanamem’s expected MoA in terms of binding and inhibiting the tissue cortisol synthesis enzyme 11β-HSD1, in live human subjects and at doses as low as 5mg daily. The article reported data from a human PET imaging study, which showed that Xanamem exhibited high target site occupancy and biological activity at doses of 5mg through 30mg daily, as well as favourable safety and tolerability.
The study participants included 23 cognitively normal elderly adults and 17 patients with AD. Xanamem doses of 5mg, 10mg, 20mg and 30mg were given daily for seven days to 10 participants at each dose level. Xanamem occupancy at the 11β-HSD1 binding site was measured using the 11C-TARACT tracer and the authors concluded that Xanamem dosing provided high target occupancy of 66–85%, exceeding the 30–60% inhibition required for effectiveness (in terms of sufficient cortisol synthesis suppression) in animal models. The degree of 11β-HSD1 occupancy with Xanamem did not vary significantly between the cognitively normal and AD subjects. The dose-response relationship was reported to be relatively flat above 5 mg and the authors concluded that the 10mg daily dose level resulted in near saturation of the enzyme target, such that higher doses were not believed to be incrementally beneficial.
This conclusion is consistent with the current Xanamem programme, where the 10mg daily dose level is being assessed in the company’s two ongoing clinical trials, the XanaMIA Phase IIb trial assessing patients with CI associated with mild-to-moderate AD, and the XanaCIDD study assessing the drug in patients with MDD and CI, despite standard-of-care anti-depression therapy.
This data complements the well-established, previously reported safety results from prior Xanamem studies comprising over 200 patients, including a multiple-ascending dose (MAD) Phase I study and three subsequent trials, studying the drug’s effects on cognition, including:
■
XanADu, a double-blinded Phase II trial assessing the drug versus placebo in 185 mild AD patients between 2017 and 2019;
■
XanaHES, a single-blinded placebo-controlled Phase I study in healthy elderly volunteers (n=42) that started in early 2019 and was completed in Q419; and
■
the Phase Ib portion of XanaMIA, which started in July 2021, assessing 5mg and 10mg doses of Xanamem, with positive Phase Ib data in healthy volunteers reported in April 2022.
Altogether, we view the PET results as favourable and supportive of the underlying mechanism behind the Xanamem clinical programmes underway.
XanaMIA Phase IIb progressing, data expected in H125
In December 2023, Actinogen opened the first investigational study site for the Phase IIb XanaMIA trial of Xanamem in biomarker-positive patients with CI associated with mild-to-moderate AD. Participant screening has begun and the company expects treatment of the first study participant to start shortly. The study is designed to enrol c 220 patients, who will be randomised to take Xanamem 10mg or a placebo once daily for 36 weeks. The trial will concentrate on Australian test sites for the first 100 enrolled patients to mitigate study costs, and initial efficacy and safety results will be analysed when these patients reach 24 weeks of treatment. The results continue to be expected in H1 CY25 and could serve as a significant catalyst if data are positive.
A key screening criterion for patients recruited and accepted into the trial will be that they must have an elevated level of phosphorylated Tau-181 (pTau-181) protein in their blood at baseline. This requirement leads the study to focus on patients with a positive AD blood biomarker (pTau-181) and was informed by a subset analysis reported in Q4 CY22 in 34 patients with elevated pTau-181 blood levels from the previous 185-patient XanADu trial in mild AD. This subset of patients (16 on Xanamem 10mg daily, 18 on placebo) with biomarker-positive AD (pTau of at least 6.74pg/mL) showed clinical activity and a relatively large effect size at 12 weeks, using the FDA-recognised Clinical Dementia Rating Sum of Boxes (CDR-SB) scale. The 34 patients with pTau levels at or above 6.74pg/ml in the study showed a 0.6 mean difference (effect size) in CDR-SB (representing a 60% relative reduction in disease progression versus placebo) at 12 weeks between the placebo and treatment arms. The primary endpoint of the XanaMIA Phase IIb study will be the change in a cognitive composite of several tests and the CDR-SB functional score will be a secondary endpoint.
UK Innovation Passport provides vote of confidence
Actinogen announced in February 2024 that the UK MHRA accepted the company’s application for an Innovation Passport as part of the UK’s ILAP for Xanamem in the treatment of AD. Xanamem’s acceptance into the ILAP pathway could accelerate the UK regulatory approval process once pivotal trials are completed. It also allows for opportunities for expanded regulatory and stakeholder input (from agencies including the National Institute for Health and Care Excellence, NICE) along the way in advancing a development path for potential Xanamem regulatory approval and reimbursement in the UK.
The ILAP attainment provides external validation to Xanamem’s mechanism of action and the clinical data to date (such as the subset analysis of XanADu described above). While there are differences between the US and UK regulatory systems, the closest US-based equivalents to ILAP, in our view, would be the FDA’s Fast Track, Priority Review and Breakthrough Therapy designations, which similarly can provide access to expanded and more frequent regulatory input, and expedited regulatory review processes. We will monitor whether Xanamem will receive the above FDA designations, which could be a substantial additional catalyst and signal of external validation (noting that the US market opportunity remains much larger than that of the UK). We note that Eli Lilly’s donanemab and Biogen/Eisai’s lecanemab (Leqembi) both received Breakthrough Therapy designations in AD.
XanaCIDD data readout expected in Q224
The next material milestone for Actinogen will be the results, expected in Q2 CY24, from its Phase IIa XanaCIDD study in patients with CI and MDD. Actinogen reported that enrolment recently surpassed 75% (at least 120 out of a planned 160 total participants across sites in the UK and Australia).
In the trial, patients are administered Xanamem at a daily dose of 10mg or a placebo for six weeks in addition to their existing anti-depression treatment. The study assesses cognitive improvement, using the Cogstate Cognitive Test Battery, and evaluates depression changes through the Montgomery-Asberg Depression Rating Scale. Actinogen expects to report study results in Q2 CY24. Results will include measures after six weeks of treatment as well as at a four-week follow-up period after the conclusion of treatment. We remain constructive on the XanaCIDD outcome given that the drug has already shown positive cognitive effects in healthy adults in prior studies (XanaHES, XanaMIA Phase Ib portion).
Positive results from the trial could lead the company to advance Xanamem into pivotal studies for patients with CI and/or depression. Positive data could also lead to a re-rating in the share price and facilitate future fund-raising activities for CI and/or AD programmes. To this end, the timing of the expansion of the XanaMIA Phase IIb study (to sites outside Australia) could potentially occur earlier than the planned interim analysis for XanaMIA phase IIb (in H1 CY25, as discussed above). Effectively, if positive data are received in the XanaCIDD study (by end Q2 CY24), this catalyst could lead to a share re-rating that would enable Actinogen to expeditiously raise the funding needed to expand the XanaMIA Phase IIb study to US and global study sites (given that US site study costs are likely to be significantly higher than those in Australia). Such an outcome would be ahead of the company’s current guidance (which is for such study site expansion to occur at or after the interim Phase IIb XanaMIA data in H1 CY25).
Financials
We have adjusted our model to reflect an A$0.65/US$ exchange rate (vs A$0.63/US$ previously). Actinogen’s H124 financial results (for the six months ending 31 December 2023) showed a net operating cash burn rate of A$6.5m, including receipt of an A$4.8m R&D research tax credit (which reflected a partial reimbursement for R&D activities conducted over FY23 (the fiscal year ending June 2023)). This came in lower than our expectation of A$10.1m, which implies a reduced short-term funding need compared to our prior assumptions and modelling. Excluding the R&D tax credit, the H124 operating cash burn rate would have been A$11.3m. Altogether, gross R&D expenses for the H124 period were A$8.95m (generally in line with our A$8.8m forecast), or up 66% y-o-y.
We believe that R&D costs were largely attributable to the continuation of the XanaCIDD study, as well as preparation for the XanaMIA Phase IIb study. We expect R&D costs in H224 (H1 CY24) to be comparable to H124, as upward cost contributions from increasing enrolment for the XanaMIA Phase IIb study will be offset by the winding down of XanaCIDD. We also note that some one-off expenses occurred in H124 associated with the preparation and temporary opening of XanaCIDD study sites that subsequently did not proceed with enrolment.
Following discussions with management, we now expect the overall operating expenditure rate in H224 (H1 CY24) to decrease slightly compared to H124, and the net result is that we are lowering our H224 and FY24 operating expense assumptions. We now forecast FY24 gross R&D expenses of A$17.7m and an operating cash burn of A$19.2m, versus our prior assumptions of A$22.2m and A$23.7m, respectively.
While we have reduced FY25 expense estimates, we continue to expect costs to rise substantially year-on-year in FY25 as we model US study site expansion for XanaMIA Phase IIb, as well as the initiation of a larger, potentially pivotal, global study for Xanamem in patients with CI associated with MDD. We now project an FY25 net operating cash burn rate of A$50.3m, driven by A$49.2m in R&D expenses, versus our prior FY25 forecasts of A$60.4m and A$55.6m, respectively. We have increased our assumptions for future R&D tax credit rebates (which are included as part of revenue in our financial summary table estimates), as we now assume a maximum potential tax credit rate of 48.5% (vs 43.5% previously) and also assume a higher percentage of the company’s R&D activities will be eligible for the rebate. We have also adjusted the revenue recognition timing of such R&D rebates in our model to match the same fiscal year in which the applicable R&D costs are incurred, although this change does not have an effect on our projected cash flows from such rebates (since the rebate proceeds are still expected to be received in the second half of each calendar year).
Actinogen reported a gross cash position of A$11.5m at 31 December 2023 and we continue to model that the company is funded into Q424 (Q2 CY24). We expect the company to continue to receive R&D research tax credits (which correspond to up to 48.5% of R&D costs incurred in the prior fiscal year, as stated above) from the Australian government and generally the timing for such rebates is in the second half of the calendar year. An option that Actinogen may pursue is to seek a loan or advance credit against its anticipated R&D tax credit (we note that Australian-based Edison client Recce Pharmaceuticals has pursued a similar strategy) and then repay the loan once it receives the applicable rebate. If the company were to obtain such a loan advance in H1 CY24, then we believe the advance payment plus the company’s existing cash on hand would fund its operations well into H2 CY24. This additional runway would allow the company to potentially leverage the results of the XanaCIDD study (if results are favourable) to obtain more attractive terms when seeking its next funding round.
Overall, our base case scenario models that Actinogen will raise an additional A$15m (down vs A$20m previously) before end-FY24 (modelled as illustrative debt), given our expectations of increases in R&D expenses as the Phase IIb portion of the XanaMIA study ramps up. However, in addition to the loan advance possibility described above, the company may also have the option to raise a smaller amount (vs our A$15m projection) before end-FY24 and use such funds to cover its operational needs until it receives the anticipated proceeds from the R&D tax credit in H2 CY24. Our model assumes the company will receive c A$7.7m in R&D tax credit proceeds in H2 CY24.
We expect XanaMIA top-line Phase IIb results in CY26 (with interim results in H1 CY25). We continue to project a potential launch timeline for Xanamem in patients with AD to CY29 and assume commercialisation of the drug for patients with MDD in CY28. Our base-case projection assumes that Actinogen will independently fund all studies needed for regulatory approval in these indications.
We now assume the total projected future funding need to recurring operating profitability will be A$420m, down from A$495m previously. Our increased forecasts for upcoming R&D tax credit rebates are the largest driver for the lowering of our future funding need assumptions.
Valuation
Our valuation is based on an rNPV analysis, which includes A$11.5m in estimated net cash at end-December 2023. We apply a discount rate of 12.5% and include Xanamem in the two lead indications. We use a probability of success of 10% for Xanamem to reach the market in the AD indication and 12.5% in the MDD indication. We have adjusted our model for our revised expenditure forecasts, increases in our tax credit assumptions and our revised forex assumptions. We have also rolled forward our estimates. Our a total rNPV valuation is essentially unchanged at A$528m, as the upward effects from our revised R&D cost and tax credit estimates are offset by the relative appreciation of the Australian dollar versus our prior estimates (A$0.65/US$ vs A$0.63/US$ previously). The minor decrease in the per-share valuation to A$0.23 per share (vs A$0.24 previously) is due to the increased share count.
Exhibit 1: Actinogen rNPV valuation
Product |
Market |
Launch |
Sales (A$m) in 2034 |
NPV (A$m) |
Probability of success |
rNPV (A$m) |
rNPV/basic share (A$) |
Xanamem in CI related to AD |
US |
CY29 |
3,547 |
3,229.4 |
10.0% |
264.8 |
0.11 |
Xanamem in CI related to AD |
EU5 & Australia |
CY29 |
1,679 |
1,584.1 |
10.0% |
158.4 |
0.07 |
Xanamem in CI related to MDD |
US |
CY28 |
1,156 |
927.3 |
12.5% |
79.7 |
0.03 |
Xanamem in CI related to MDD |
EU5 & Australia |
CY28 |
674 |
576.3 |
12.5% |
72.0 |
0.03 |
Corporate costs |
|
|
(58.7) |
100% |
(58.7) |
(0.03) |
|
Estimated net cash at 31 December 2023 |
|
|
11.5 |
11.5 |
0.00 |
||
Total equity value |
6,269.6 |
|
527.8 |
0.23 |
Source: Edison Investment Research
We believe market participants will be keen to observe whether the Phase IIb XanaMIA portion, which prospectively enrols patients with elevated pTau, will confirm the positive efficacy findings shown in the XanADu subset biomarker analysis from the earlier XanADu study. Given the widespread economic and social costs of AD and the limitations of current approved treatments, we believe positive Phase IIb data could introduce the possibility of material out-licensing or value realisation opportunities.
As stated earlier, we forecast A$420m in additional financing will be required before FY29 to fund the development of both the CI-MDD and AD programmes, after which, provided it receives regulatory approval, Actinogen should be able to generate sufficient operating revenues to reach recurring profitability. Our model assumes all financing will be raised through illustrative debt, as per usual Edison methodology. If our projected funding need of A$420m is raised through equity issuances at the prevailing market price of c A$0.035, our effective valuation would decrease to A$0.066 per share.
The amount of fund-raising estimated to be necessary for Actinogen to independently bring Xanamem to commercialisation in these indications is larger than the company’s current market capitalisation. However, we note that the funding intervals may be staggered over the next several years, which may alleviate potential challenges associated with raising funds in excess of a company’s market capitalisation. We also believe Actinogen will seek non-dilutive funding arrangements and/or partnership arrangements (actions towards the latter would likely particularly increase after the XanaMIA Phase IIb portion is completed), which may reduce the overall funding need, but such scenarios are not included in our forecasts. Hence, while our base case modelling scenario assumes internal Xanamem development for the AD and CI-MDD programmes, if the company is successful in securing licensing deal(s) for Xanamem with an established biopharma company(ies), then our R&D expenditure requirements for Actinogen, and, consequently, our overall funding need projections, would likely be significantly reduced.
Considering that AD pivotal trials are reported to cost more per patient than studies in nearly any other therapeutic area, we believe Actinogen will likely explore partnerships or non-dilutive funding strategies if the XanaCIDD data (expected in Q2 CY24) or interim XanaMIA Phase IIb data (expected in H1 CY25) are positive.
Exhibit 2: Financial summary
A$(000) |
2020 |
2021 |
2022 |
2023 |
2024e |
2025e |
||
Year end 30 June |
IFRS |
IFRS |
IFRS |
IFRS |
IFRS |
IFRS |
||
PROFIT & LOSS |
||||||||
Revenue |
|
|
3,516 |
1,984 |
3,640 |
4,888 |
7,723 |
20,295 |
Cost of Sales |
0 |
0 |
0 |
0 |
0 |
0 |
||
Gross Profit |
3,516 |
1,984 |
3,640 |
4,888 |
7,723 |
20,295 |
||
Sales, General & Administrative |
(2,962) |
(3,111) |
(4,558) |
(6,568) |
(6,569) |
(6,288) |
||
Net Research & Development |
(5,537) |
(2,406) |
(8,215) |
(8,900) |
(17,692) |
(49,231) |
||
EBITDA |
|
|
(4,983) |
(3,533) |
(9,133) |
(10,580) |
(16,538) |
(35,223) |
Amortisation of intangible assets |
(314) |
(313) |
(313) |
(313) |
(236) |
(236) |
||
Depreciation & other |
(99) |
(74) |
(88) |
(93) |
(100) |
(226) |
||
Normalised Operating Profit (ex. amort, SBC, except.) |
(4,888) |
(3,318) |
(7,933) |
(9,156) |
(16,058) |
(35,449) |
||
Operating profit before exceptionals |
(5,396) |
(3,920) |
(9,533) |
(10,985) |
(16,874) |
(35,685) |
||
Exceptionals including asset impairment |
0 |
0 |
0 |
0 |
0 |
0 |
||
Other |
(194) |
(289) |
(1,288) |
(1,517) |
(580) |
0 |
||
Reported Operating Profit |
(5,590) |
(4,209) |
(10,821) |
(12,502) |
(17,454) |
(35,685) |
||
Net Finance income (costs) |
65 |
5 |
36 |
233 |
226 |
(2,496) |
||
Profit Before Tax (norm) |
|
|
(4,822) |
(3,313) |
(7,897) |
(8,923) |
(15,832) |
(37,945) |
Profit Before Tax (FRS 3) |
|
|
(5,331) |
(3,915) |
(9,497) |
(10,752) |
(16,648) |
(38,181) |
Tax |
0 |
0 |
0 |
0 |
0 |
0 |
||
Profit After Tax and minority interests (norm) |
(4,822) |
(3,313) |
(7,897) |
(8,923) |
(15,832) |
(37,945) |
||
Profit After Tax and minority interests (FRS 3) |
(5,331) |
(3,915) |
(9,497) |
(10,752) |
(16,648) |
(38,181) |
||
Average Basic Number of Shares Outstanding (m) |
1,118.0 |
1,405.2 |
1,717.1 |
1,806.0 |
2,073.7 |
2,331.2 |
||
EPS - normalised (A$) |
|
|
(0.004) |
(0.002) |
(0.005) |
(0.005) |
(0.008) |
(0.016) |
EPS - normalised and fully diluted (A$) |
|
(0.004) |
(0.002) |
(0.005) |
(0.005) |
(0.008) |
(0.016) |
|
EPS - (IFRS) (A$) |
|
|
(0.005) |
(0.003) |
(0.006) |
(0.006) |
(0.008) |
(0.016) |
Dividend per share (A$) |
0.0 |
0.0 |
0.0 |
0.0 |
0.0 |
0.0 |
||
BALANCE SHEET |
||||||||
Fixed Assets |
|
|
3,772 |
3,287 |
2,889 |
2,520 |
2,857 |
3,479 |
Intangible Assets |
3,346 |
3,033 |
2,720 |
2,408 |
2,672 |
2,936 |
||
Tangible Assets |
19 |
17 |
13 |
113 |
185 |
542 |
||
Investments in long-term financial assets |
408 |
237 |
156 |
0 |
0 |
0 |
||
Current Assets |
|
|
8,164 |
15,091 |
20,417 |
12,688 |
21,216 |
27,413 |
Short-term investments |
0 |
0 |
0 |
0 |
0 |
0 |
||
Cash |
5,040 |
13,457 |
16,370 |
8,460 |
13,111 |
6,736 |
||
Other |
3,123 |
1,634 |
4,047 |
4,228 |
8,105 |
20,677 |
||
Current Liabilities |
|
|
(744) |
(755) |
(1,480) |
(1,802) |
(2,186) |
(2,186) |
Creditors |
(744) |
(755) |
(1,480) |
(1,802) |
(2,186) |
(2,186) |
||
Short term borrowings |
0 |
0 |
0 |
0 |
0 |
0 |
||
Long Term Liabilities |
|
|
(304) |
(165) |
(87) |
0 |
(15,000) |
(60,000) |
Long term borrowings |
0 |
0 |
0 |
0 |
(15,000) |
(60,000) |
||
Other long term liabilities |
(304) |
(165) |
(87) |
0 |
0 |
0 |
||
Net Assets |
|
|
10,889 |
17,458 |
21,740 |
13,407 |
6,887 |
(31,294) |
CASH FLOW STATEMENT |
|
|
|
|
|
|
|
|
Operating Income |
(5,590) |
(4,209) |
(10,821) |
(12,502) |
(17,454) |
(35,685) |
||
Movements in working capital |
(3,591) |
(1,513) |
(3,143) |
132 |
(3,450) |
(12,573) |
||
Net interest and financing income (expense) |
65 |
5 |
36 |
233 |
226 |
(2,496) |
||
Depreciation & other |
99 |
74 |
88 |
93 |
100 |
226 |
||
Taxes and other adjustments |
6,161 |
3,920 |
4,323 |
3,346 |
1,396 |
236 |
||
Net Cash Flows from Operations |
|
|
(2,856) |
(1,724) |
(9,517) |
(8,698) |
(19,182) |
(50,292) |
Capex |
(23) |
(6) |
(3) |
(37) |
(672) |
(1,083) |
||
Acquisitions/disposals |
0 |
0 |
0 |
0 |
0 |
0 |
||
Interest received & other investing activities |
0 |
0 |
0 |
(0) |
0 |
0 |
||
Net Cash flows from Investing activities |
|
(23) |
(6) |
(3) |
(37) |
(672) |
(1,083) |
|
Net proceeds from share issuances |
0 |
10,195 |
12,491 |
903 |
9,548 |
0 |
||
Net movements in long-term debt |
0 |
0 |
0 |
0 |
15,000 |
45,000 |
||
Dividends |
0 |
0 |
0 |
0 |
0 |
0 |
||
Other financing activities |
282 |
(84) |
(71) |
(78) |
(42) |
0 |
||
Net Cash flows from financing activities |
|
282 |
10,111 |
12,420 |
825 |
24,505 |
45,000 |
|
Effects of FX on Cash & equivalents |
0 |
0 |
49 |
0 |
0 |
0 |
||
Net Increase (Decrease) in Cash & equivalents |
(2,596) |
8,381 |
2,949 |
(7,910) |
4,651 |
(6,376) |
||
Cash & equivalents at beginning of period |
7,637 |
5,040 |
13,422 |
16,370 |
8,460 |
13,111 |
||
Cash & equivalents at end of period |
5,040 |
13,422 |
16,370 |
8,460 |
13,111 |
6,736 |
||
Closing net debt/(cash) |
|
|
(5,448) |
(13,694) |
(16,527) |
(8,460) |
1,889 |
53,264 |
Lease debt |
390 |
236 |
165 |
87 |
45 |
45 |
||
Closing net debt/(cash) inclusive of IFRS16 lease debt |
(5,058) |
(13,458) |
(16,361) |
(8,373) |
1,933 |
53,309 |
||
Free cash flow |
(2,878) |
(1,730) |
(9,520) |
(8,735) |
(19,854) |
(51,376) |
||
Source: Edison Investment Research, company reports
|
|
Research: Healthcare
OSE Immunotherapeutics has announced a global licence and collaboration agreement with AbbVie to develop OSE-230, a novel monoclonal antibody, for the treatment of chronic and severe inflammation. The announcement marks a positive milestone and much needed endorsement within a sector hindered by funding challenges. This follows sizable transactions in December 2023 and early 2024, including AbbVie’s foray into CNS (Cerevel for $8.7bn) and entry into immunotherapy (ImmunoGen for $10.1bn), covered in our outlook note. The arrangement provides further external recognition of OSE’s innovative R&D capabilities and early-stage pipeline. Deal terms include an upfront payment of $48m, with OSE eligible to receive up to $665m in additional milestone payments. The market response to the news was highly positive, with OSE’s share price increasing by over 60% on the morning of the announcement.