Excluding Euro 2016 revenues, underlying Q217 daily net gaming revenues (NGR) grew 15%, providing further evidence of GVC’s position as a leading online gaming operator. As showcased during a recent capital markets day, the integration of bwin.party has surpassed management’s initial expectations, with positive KPIs across all divisions. Growth has been achieved through leveraging the powerful proprietary platform and reinvigorating leading brands. Customer migrations should be complete by year end and €125m cost synergies are on track. We have nudged up our 2017 and 2018 forecasts, although we recognise that comparatives into H217 will become tougher. With a robust growth profile, the stock trades towards the top of its peers, at 9.9x EV/EBITDA and 12.5x P/E for 2018e.
Written by
GVC Holdings |
Full steam ahead |
Q2 Trading Update & Capital Markets Day Overview |
Travel & leisure |
6 July 2017 |
Share price performance
Business description
Next events
Analysts
|
||||||||||||||||||||||||||||||||||||||||||||||||||
Excluding Euro 2016 revenues, underlying Q217 daily net gaming revenues (NGR) grew 15%, providing further evidence of GVC’s position as a leading online gaming operator. As showcased during a recent capital markets day, the integration of bwin.party has surpassed management’s initial expectations, with positive KPIs across all divisions. Growth has been achieved through leveraging the powerful proprietary platform and reinvigorating leading brands. Customer migrations should be complete by year end and €125m cost synergies are on track. We have nudged up our 2017 and 2018 forecasts, although we recognise that comparatives into H217 will become tougher. With a robust growth profile, the stock trades towards the top of its peers, at 9.9x EV/EBITDA and 12.5x P/E for 2018e.
Year |
Revenue (€m) |
EBITDA |
PBT* |
EPS* |
DPS |
P/E |
Yield |
12/15 |
247.7 |
54.1 |
50.0 |
76.4 |
56.0 |
11.3 |
6.5 |
12/16p** |
894.6 |
205.7 |
121.2 |
41.5 |
30.0 |
20.9 |
3.5 |
12/17e |
945.3 |
254.1 |
205.1 |
59.2 |
33.0 |
14.6 |
3.8 |
12/18e |
996.4 |
292.6 |
245.6 |
69.1 |
38.0 |
12.5 |
4.4 |
12/19e |
1,044.7 |
306.0 |
259.0 |
71.7 |
40.0 |
12.1 |
4.6 |
Note: *Normalised and diluted (EPS) excluding amortisation of acquired intangibles, exceptional items and share-based payments. **Pro forma results include bwin.party as if it were included from 1 January 2016.
Strong Q2 trading update, harder comps into H2
Notwithstanding the lack of a major football tournament this summer, Q217 group NGR grew 8% to €244.1m, with 7% and 13% growth in daily Sports and Games Brands respectively. Q217 sports margin grew to 10.1% (9.9%). Taking into account a cautious outlook for customer migrations later this year, we have nudged up our 2017 revenue and EBITDA forecasts by c 1%, equating to 5.7% y-o-y NGR growth. We also introduce 2019 forecasts, which continue the trend of 5% NGR growth and a 30.1% EBITDA margin, with the company achieving net cash in FY19.
Capital markets day: Technology, talent, brands
GVC’s capital markets day provided demonstrable evidence of the successful integration of bwin.party. Since February 2016, the company has recruited leading talent and leveraged its technology, to significantly strengthen its core brands. Within Sports Brands, cross-sell and gross win margins have increased and the company has turned around the decline in most of bwin’s Games Brands, with particular success in poker. 95% of revenues are processed through the proprietary platform, with the result that increasing player value and product enhancements have been achieved alongside significant cost optimisation and capex reductions.
Valuation: Quality reflected in 9.9x 2018 EV/EBITDA
GVC has strong organic growth prospects, as well as an excellent track record with integration, which may continue to be augmented by M&A at some stage. In our view, the stock trades appropriately towards the top end of its broader peer group, at 9.9x EV/EBITDA and 12.5x P/E for 2018e. A 7.7% free cash flow yield in 2018 is attractive, enabling potential further special dividends (not included in our forecasts).
Capital markets update
GVC’s capital markets day on 25 May showcased the company’s success in integrating bwin.party within a year of the acquisition, with positive KPIs across all divisions. Throughout the business, GVC provided demonstrable evidence of efficiency gains, increased cross-sell, improved business intelligence and technology enhancements.
As discussed in more detail below, there are three key pillars underpinning the company’s growth strategy:
■
Technology: a unique and powerful platform with substantial upside from further optimisation.
■
Talent: one of the most successful and experienced teams in the industry.
■
Brands: a highly valuable portfolio of global gaming brands being reinvigorated.
Technological leadership
95% of GVC’s revenue is derived and processed through its powerful proprietary platform, providing the company with a high degree of flexibility and control. The fully integrated and hugely scalable technology platform supports future growth with limited incremental costs.
Technology highlights
■
Powerful proprietary technology: With fixed costs, and a hugely scalable technology, the platform is capable of handling billions of transactions per day.
•
A powerful and robust platform, with continuous focus on optimisation and enhancements (9,823 enhancements deployed in FY16).
•
Extensible technology that has the flexibility to integrate and prepare for growth.
•
A safe and secure system, which is resilient and prepared for malicious attacks.
■
Migration: The preparatory work to migrate the Sportingbet and associated brands onto the bwin platform is complete, with six CEE countries now switched over (c 30% of the total).
•
Early KPIs are encouraging, with post migration daily gross gaming revenue (GGR) up 16%, and daily sports wagers up by 44%.
•
Full migration is expected for the end of 2017.
■
Synergies: On track to deliver €125m of synergies.
■
Further upside over the next 12 months. GVC anticipates:
•
a complete technical migration to a single platform,
•
continued offering of best-in-class products,
•
further enhancements, with new betting opportunities and more games, and
•
increased business intelligence capabilities and leveraging data across the business.
Exhibits 1 and 2 below demonstrate the continued growth of the business, despite the numerous cost-savings and efficiencies achieved since the bwin acquisition.
Exhibit 1: bwin integration results within one year
Target |
Results |
Growth |
■ 12%* NGR growth to €894.6m in 2016 ■ 7% increase in daily sports wagers** ■ Party brands first growth in six years |
Efficiency |
■ Clean EBITDA increased by 26% to €205.7m in 2016 ■ €125m annualised synergies on track ■ Capex reduced by c €20-25m pa |
Capabilities |
■ 26% increase in cross-sell at bwin labels ■ 30% improvement in player resource time ■ More than 70% reduction in critical technology issues ■ 650 new games introduced |
Target |
Growth |
Efficiency |
Capabilities |
Results |
|
■ 12%* NGR growth to €894.6m in 2016 ■ 7% increase in daily sports wagers** ■ Party brands first growth in six years |
|
■ Clean EBITDA increased by 26% to €205.7m in 2016 ■ €125m annualised synergies on track ■ Capex reduced by c €20-25m pa |
|
■ 26% increase in cross-sell at bwin labels ■ 30% improvement in player resource time ■ More than 70% reduction in critical technology issues ■ 650 new games introduced |
Source: GVC Holdings. Note *Pro forma FY16 vs FY15. **Constant currency.
|
Exhibit 2: Cost optimisation from technology improvements – 2017 vs 2015 |
|
|
Source: GVC Holdings |
Leading brands with encouraging KPIs
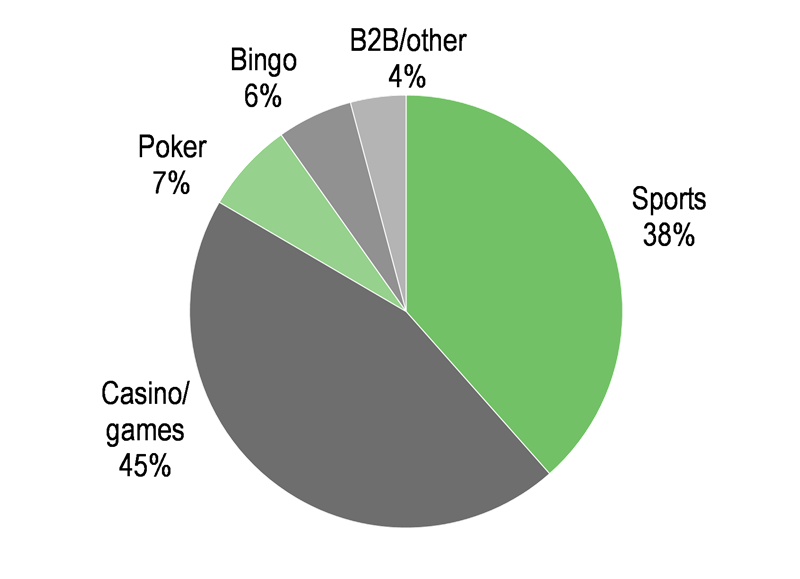
Europe is GVC’s biggest market, contributing almost 75% of NGR. It is well diversified, with 17 countries contributing 2% or more to NGR and scope to expand in a number of core markets. GVC has four business segments with a number of leading brands, of which Sports and Games Brands comprise 96% in total.
|
Exhibit 3: 2016 revenue* by division |
Exhibit 4: 2016 revenue* by product |
|
|
|
Source: Edison Investment Research. Note: *2016 pro forma net gaming revenue (NGR) of €894.6m. |
|
|
Exhibit 3: 2016 revenue* by division |
|
|
|
|
Exhibit 4: 2016 revenue* by product |
|
|
|
|
Source: Edison Investment Research. Note: *2016 pro forma net gaming revenue (NGR) of €894.6m. |
Sports Brands (73% of revenues)
GVC owns a number of sports betting brands including bwin, Sportingbet, Betboo and Gamebookers. Within this division, GVC focuses marketing on sports betting and then cross-sells casino and other games such that NGR within Sports Brands is split roughly 50/50 between sports and games. The substantial sports book is dominated by football and live (in-play).
|
Exhibit 5: Sports Brands 2016 GGR |
Exhibit 6: Sports Brands 2016 GGR by Sport |
|
|
|
Source: GVC Holdings |
|
Exhibit 5: Sports Brands 2016 GGR |
|
|
Source: GVC Holdings |
|
Exhibit 6: Sports Brands 2016 GGR by Sport |
|
|
Source: GVC Holdings |
Improvements since bwin acquisition
Since the bwin acquisition, GVC has been focusing on increasing player value, improving cross-sell (from 89% in 2015 to 96% in 2016), optimising mobile performance and improving trading capabilities. Highlights include:
■
Trading expertise: GVC’s trading expertise has now been fully embedded into the bwin sportsbook, with better risk management, tools and data driving improved margin.
■
Higher volume: An increased number of live events is driving GGR (gross gaming revenue), with 10,000 streamed events in Q117.
■
Marketing: Marketing spend for this division is expected to increase to 23-25%, in preparation for Russia 2018, which is expected to be the biggest gambling event in history.
■
Gross margin: As demonstrated in Exhibit 7, there has been a marked improvement in the bwin sports margin since the acquisition in February 2016. The strong gross margin progression is expected to continue, with improved modelling, real time data and a healthy customer database. Q217 margins of 10.1% are in line with management’s expectations of a long-term sustainable average, but we note that gross win margins fluctuate depending on sporting results. For example, Q117 margins were affected by customer-friendly results at the end of March.
Exhibit 7: GVC sportsbook
Group sportsbook |
2014 |
2015 |
2016 |
2017 (to 21 May) |
Turnover €bn |
4.2 |
4.4 |
4.6 |
1.88 |
GGR €m |
373 |
372 |
437 |
183 |
Gross win margin % |
8.9 |
8.5 |
9.6 |
9.7 |
Bwin gross margin % |
2014 |
2015 |
2016 |
2017 (to 21 May) |
Football |
10.1 |
9.9 |
12.2 |
10.4 |
Tennis |
5.8 |
5.1 |
7.3 |
7.6 |
Basketball |
4.9 |
4.8 |
5.8 |
5.8 |
Other sports |
8.3 |
7.7 |
9.1 |
11.3 |
Total |
8.5 |
8.1 |
10.2 |
9.6 |
Singles |
5.0 |
4.1 |
6.4 |
6.3 |
Source: GVC Holdings
Games Brands (23% of revenues)
The Games Brands are standalone brands that only cross-sell a small (2%) volume of sports and include partycasino, partypoker, Foxy Bingo, Gioco Digitale and CasinoClub.
Prior to the acquisition, bwin’s Games Brands lacked focus, not helped by the structural decline in the poker market and a competitive UK online bingo market. During 2016 GVC put in place a long-term strategic road map for each business, brought in new senior hires and worked on the product and user experience. The decline in Games Brands NGR in FY16 has now been reversed, and Q217 Games Brands daily NGR increased by an impressive 13%.
Casino
The global online casino market is estimated at €10.5bn GGR in 2016 (source: H2 Gambling Capital, March 2017) and, although there is less volatility than the sportsbook, industry churn levels are high and competition is fierce.
GVC has a number of well-established casino brands, which comprised 12% of total NGR in Q117. Since the bwin acquisition, the company has focused on ROI marketing and the decline in the bwin.party casino brands (partycasino and Gioco Digitale) has now been halted.
GVC’s casino brands are:
■
Casino Club: a top three casino brand in Germany, with a loyal customer base of male high rollers over 40 years old. This brand has achieved a high degree of loyalty, with 2016 NGR growth of 15% and 67% of 2016 NGR stemming from customers playing for over five years.
■
partycasino: originally from bwin and now decoupled from partypoker. GVC has been repositioning the brand as destination for young affluent players, launched new games and a VIP team has been hired. Management’s objective is to achieve 10% y-o-y growth and return the brand to market dominance.
■
Gioco Digitale: GVC has repositioned a formerly under-invested bwin brand as an entertaining soft gaming brand, with a focus on casino and cross-sell from bingo. The integration of third-party slots has commenced.
Poker: Reinvigorated and a return to growth
Given the structural challenges in the poker market, the global online poker market has declined by 1% CAGR since 2006 and is now estimated be worth €2.4bn (source: H2GC). Bwin’s partypoker franchise had commensurately suffered from long-term decline and a lack of investment.
Since the acquisition, a new management team has reinvigorated and repositioned the brand, with targeted investment in key markets (eg Canada and the UK). Success is evident from the 16% growth in H216 vs the prior year, as well as an acceleration of daily NGR into H117.
Bingo: A challenged business
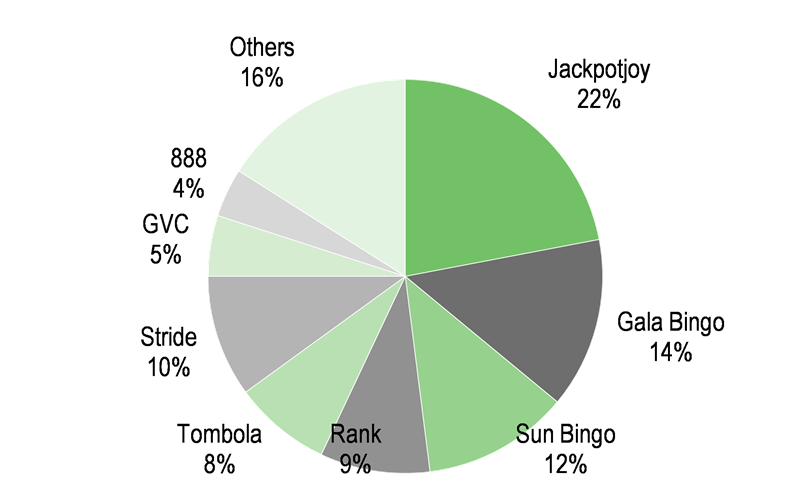
The UK is the world’s largest online real-money bingo market segment with approximately €600m in 2016 and we estimate that GVC’s Cashcade brands have c 5% market share.
Bingo is the only part of the group that is not run on the proprietary platform and, despite having one of the best-known bingo brands in the UK, Foxy Bingo has suffered a challenging few years.
Recent initiatives include a high-profile Foxy rebrand (with Heather Graham), terminating the bingo affiliate programme and launching a new casino programme. The current focus is on profitability rather than revenues, with a 15% decline in Q117 NGR vs the prior year. The majority of marketing spend will occur from September onwards, with the aim of returning the business to top line growth in 2018.
Instrumental in the process has been the recruitment of Adele Lawton as head of bingo (with 20 years’ marketing experience, mainly in bingo, with brands including Gala, Skybet and Gamesys).
|
Exhibit 8: Cashcade brands, % of 2016 NGR |
Exhibit 9: UK online bingo-led market share 2016 |
|
|
|
Source: GVC Holdings |
Source: Edison Investment Research, company reports |
|
Exhibit 8: Cashcade brands, % of 2016 NGR |
|
|
Source: GVC Holdings |
|
Exhibit 9: UK online bingo-led market share 2016 |
|
|
Source: Edison Investment Research, company reports |
Other: B2B/non core (4% of revenues)
Bwin brought in a small B2B business whose clients include Borgata in the US and Danske Spil in Denmark. Bwin also brought in some non-core businesses including InterTrade (financial markets trading) and Kalixa (payment processing, sold for €29m in December 2016, with completion on 31 May 2017). During H117, Kalixa contributed revenues of €6.1m against €7.6m in the prior year.
Recruiting top talent
GVC’s board and executive team has a considerable depth of experience in online gaming. Kenneth (Kenny) Alexander has been CEO since March 2007 and was previously MD of Sportingbet’s European operations.
Immediately after the bwin acquisition, Kenny began to restructure the management team to take the best talent from both bwin and GVC, with a management structure that emphasises clear reporting lines and management accountability. Shay Segev was brought in as group COO, having previously been COO of leading gaming software provider Playtech and Nick Batram joined from Peel Hunt as head of investor relations and corporate strategy. Paul Miles joined as CFO in 2017, from Wonga plc. A number of new management positions have also been created, including chief product officer and VP business operations, as Kenny has put in place an organisation that can handle material group expansion. Exhibit 10 illustrates the calibre of new management who have joined GVC over the past year; many others have also joined from leading operators in key markets.
GVC has always believed in management and employee incentivisation. Post the bwin acquisition a new option plan (LTIP) was put in place, with currently c 15m options held. Employee bonuses are linked to revenue outperformance.
Exhibit 10: Recent new executive management hires
Position |
Joined |
Former roles |
Responsibility |
|
Paul Miles |
CFO |
Feb-17 |
Wonga CFO; Capquest CFO, RSA financial controller |
Finance and strategy |
Shay Segev |
COO |
Mar-16 |
Gala Coral chief strategy officer, Playtech COO |
Chief operating officer |
Nick Batram |
IR/corporate strategy |
Apr-16 |
Peel Hunt head of leisure and gaming |
IR and corporate strategy |
Liron Snir |
Chief product officer |
Mar-16 |
Playtech, VP of product and strategy |
Product management |
Roni Maman |
VP business ops |
Mar-17 |
888 Holdings, senior VP of operations |
Customer service |
Adele Lawton |
Head of bingo |
Aug-16 |
Betable ops director Europe, Bet365, Gala, Skybet. |
Cashcade bingo brands |
Source: GVC, Edison Investment Research
Financials
Q217 trading update
GVC reported a robust Q217 trading update on 6 July, with group NGR growth of 8% vs the prior year. Excluding Euro 2016 revenues, underlying daily group wagers and group NGR grew 10% and 15% respectively.
Within Sports Brands, Sports daily NGR declined by 1%, but with an increase in cross-sell into Gaming, total daily Sports Brands NGR increased 7%. The gross win sports margin was 10.1% vs 9.9% in the prior year. As noted above, this is in line with management’s expectations of the long-term sustainable average.
Games Brands daily NGR increased by 13% in Q217, assisted by an impressive turnaround in partypoker performance and an improving performance from the group’s standalone casino brands.
Changes to forecasts
We have nudged up our 2017 revenue and EBITDA forecasts by approximately 1%, to reflect the positive trading update. This represents NGR growth of 5.7% y-o-y, and takes into account the lack of major football tournaments this summer, as well as a cautious outlook for customer migrations later this year. We summarise the divisional revenue breakdown in Exhibit 12.We also introduce 2019 forecasts, which continue the trend of c 5% NGR growth, success in cross-sell and a robust sports margin. Fixed costs and operational leverage are expected to offset steadily increasing gaming taxes and we forecast EBITDA margins rising to 30.1% by 2018.
Our balance sheet and cash flow forecasts remain largely unchanged, with underlying operating cash flow of over 90% enabling a progressive dividend policy, as well as the potential for future special dividends (not in our forecasts). We forecast net debt of €122m in 2017, falling to €17m in 2018 and a net cash position of €82m in 2019.
Exhibit 11: Estimate changes
Year end December |
NGR revenue (€m) |
EBITDA (€m) |
EPS (c) |
||||||
Old |
New |
% chg. |
Old |
New |
% chg. |
Old |
New |
% chg. |
|
2017e |
936.9 |
945.3 |
0.9 |
251.6 |
254.1 |
1.0 |
58.5 |
59.2 |
1.4 |
2018e |
992.4 |
996.4 |
0.4 |
287.9 |
292.6 |
1.7 |
68.8 |
69.1 |
0.4 |
Source: Edison Investment Research.
Exhibit 12: Summary financials
Year end December (€m) |
2015** |
2016 |
2017e |
2018e |
2019e |
Sports wagers |
4312.6 |
4488.3 |
4654.4 |
4887.1 |
5058.1 |
Sports margin |
9.1% |
9.6% |
9.8% |
9.9% |
10.0% |
Sports GGR |
391.2 |
430.9 |
454.3 |
483.8 |
505.8 |
Sports bonuses |
(86.6) |
(97.7) |
(99.9) |
(106.4) |
(108.7) |
Sports NGR |
304.5 |
333.2 |
354.3 |
377.4 |
397.1 |
Sports games cross-sell |
271.1 |
320.8 |
347.2 |
373.6 |
393.1 |
Cross-sell % sports NGR |
89.0% |
96.3% |
98.0% |
99.0% |
99.0% |
Sports Brands |
575.7 |
654.0 |
701.6 |
751.0 |
790.2 |
Games Brands |
211.7 |
203.5 |
217.7 |
226.5 |
235.5 |
B2B |
14.2 |
14.2 |
14.0 |
15.0 |
15.0 |
Total core |
801.6 |
871.7 |
933.3 |
992.4 |
1040.7 |
Non-core |
20.5 |
22.9 |
12.0 |
4.0 |
4.0 |
Net gaming revenue (NGR) |
822.1 |
894.6 |
945.3 |
996.4 |
1044.7 |
VAT |
(14.2) |
(21.4) |
(23.0) |
(25.0) |
(27.0) |
Revenue |
807.9 |
873.2 |
922.3 |
971.4 |
1017.7 |
Contribution |
425.7 |
464.0 |
455.1 |
477.2 |
492.2 |
Contribution margin % NGR |
51.8% |
51.9% |
48.1% |
47.9% |
47.1% |
Other operating costs |
(262.2) |
(258.3) |
(201.0) |
(184.6) |
(186.2) |
Other op costs ratio |
32% |
30% |
22% |
19% |
18% |
Normalised EBITDA |
163.5 |
205.7 |
254.1 |
292.6 |
306.0 |
Clean EBITDA margin* |
20.2% |
23.6% |
27.5% |
30.1% |
30.1% |
Source: Edison Investment Research. Note: *Clean EBITDA margin based on reported revenues (not NGR). **2015 and 2016 are pro forma as if bwin were included.
Valuation: Peer group multiples
GVC has strong organic growth prospects, as well as an excellent track record with integration, which may continue to be augmented by M&A at some stage. In our view, the stock trades appropriately towards the top end of its broader peer group, at 9.9x EV/EBITDA and 12.5x P/E for 2018e. A 7.7% free cash flow yield in 2018 is attractive, enabling the potential for further special dividends (not included in our forecasts).
Exhibit 13: Peer group multiples
Price |
Currency |
Mkt cap (m) |
EV/EBITDA (x) |
P/E (x) |
|||
2017e |
2018e |
2017e |
2018e |
||||
GVC HOLDINGS PLC |
756 |
GBp |
2,273 |
11.2 |
9.8 |
14.6 |
12.5 |
888 Holdings |
254 |
GBP |
912 |
10.5 |
9.5 |
18.2 |
16.3 |
BETSSON AB |
72 |
SEK |
10,331 |
9.5 |
9.0 |
11.8 |
10.9 |
KINDRED GROUP PLC |
91 |
SEK |
20,941 |
12.4 |
10.7 |
17.8 |
15.2 |
LADBROKES CORAL GROUP PLC |
115 |
GBp |
2,192 |
7.2 |
6.3 |
10.5 |
8.3 |
PADDY POWER BETFAIR PLC |
8060 |
GBp |
6,799 |
14.5 |
12.8 |
19.9 |
17.7 |
PLAYTECH PLC |
946 |
GBp |
3,004 |
8.6 |
7.8 |
12.8 |
11.5 |
WILLIAM HILL PLC |
254 |
GBp |
2,178 |
7.5 |
7.1 |
10.7 |
10.0 |
Average |
10.2 |
9.1 |
14.5 |
12.8 |
|||
Average Ex PPB |
9.6 |
8.6 |
13.8 |
12.1 |
|||
Source: Bloomberg, Edison Investment Research. Note: Share prices at 4 July 2017.
Exhibit 14: Financial summary
€m |
2014 |
2015 |
2016* |
2017e |
2018e |
2019e |
||
Year end 31 December |
(IFRS) |
(IFRS) |
(IFRS) |
(IFRS) |
(IFRS) |
(IFRS) |
||
PROFIT & LOSS |
||||||||
Revenue (NGR) |
|
|
224.8 |
247.7 |
894.6 |
945.3 |
996.4 |
1,044.7 |
Cost of Sales |
(101.5) |
(112.4) |
(430.6) |
(490.2) |
(519.2) |
(552.5) |
||
Gross Profit (contribution) |
123.3 |
135.4 |
464.0 |
455.1 |
477.2 |
492.2 |
||
EBITDA |
|
|
49.2 |
54.1 |
205.7 |
254.1 |
292.6 |
306.0 |
Depreciation and amortisation |
|
|
(5.5) |
(1.4) |
(27.0) |
(34.0) |
(37.0) |
(37.0) |
Operating Profit (norm) |
|
|
43.7 |
52.7 |
178.7 |
220.1 |
255.6 |
269.0 |
Amortisation of acquired intangibles |
0.0 |
0.0 |
(109.5) |
(120.0) |
(120.0) |
(120.0) |
||
Exceptional/ one-off items |
0.0 |
(24.5) |
(104.4) |
(30.0) |
0.0 |
0.0 |
||
Share based payments |
(0.7) |
(0.4) |
(31.1) |
(15.0) |
(10.0) |
(10.0) |
||
Operating Profit |
42.9 |
27.7 |
(66.3) |
55.1 |
125.6 |
139.0 |
||
Net finance charges (interest plus fees) |
(0.1) |
(2.2) |
(60.8) |
(15.0) |
(10.0) |
(10.0) |
||
Other financial expense/ associates |
(1.6) |
0.0 |
3.3 |
0.0 |
0.0 |
0.0 |
||
Profit Before Tax (norm) |
|
|
41.3 |
50.0 |
121.2 |
205.1 |
245.6 |
259.0 |
Profit Before Tax (FRS 3) |
|
|
41.3 |
25.5 |
(123.8) |
40.1 |
115.6 |
129.0 |
Tax |
(0.7) |
(0.8) |
0.0 |
(18.5) |
(24.6) |
(25.9) |
||
Profit After Tax (norm) |
40.6 |
49.2 |
116.0 |
186.6 |
221.1 |
233.1 |
||
Profit After Tax (FRS 3) |
40.6 |
24.7 |
(123.8) |
21.6 |
91.1 |
103.1 |
||
Average Number of Shares Outstanding (m)** |
61.1 |
61.3 |
271.8 |
300.0 |
310.0 |
315.0 |
||
EPS - normalised fully diluted (c) |
|
|
61.4 |
76.4 |
41.5 |
59.2 |
69.1 |
71.7 |
EPS - (IFRS) (c) |
|
|
66.4 |
40.2 |
(45.5) |
7.2 |
29.4 |
32.7 |
Dividend per share declared (c) |
55.5 |
56.0 |
30.0 |
33.0 |
38.0 |
40.0 |
||
Dividend per share paid (c) |
|
|
55.0 |
56.0 |
0.0 |
43.2 |
35.0 |
38.8 |
Gross Margin (%) |
54.8 |
54.6 |
51.9 |
48.1 |
47.9 |
47.1 |
||
EBITDA Margin (%)*** |
21.9 |
21.8 |
23.0 |
26.9 |
29.4 |
29.3 |
||
Operating Margin (before GW and except.) (%) |
19.4 |
21.3 |
20.0 |
23.3 |
25.7 |
25.7 |
||
BALANCE SHEET |
||||||||
Fixed Assets |
|
|
159.2 |
159.2 |
1,637.7 |
1,524.0 |
1,397.0 |
1,270.0 |
Intangible Assets |
154.3 |
155.2 |
1,609.4 |
1,485.4 |
1,358.4 |
1,231.4 |
||
Tangible Assets |
1.1 |
1.4 |
19.7 |
30.0 |
30.0 |
30.0 |
||
Deferred tax asset |
3.8 |
2.6 |
8.6 |
8.6 |
8.6 |
8.6 |
||
Current Assets |
|
|
49.5 |
72.6 |
478.0 |
373.2 |
502.9 |
617.1 |
Stocks |
0.0 |
3.8 |
0.0 |
0.0 |
0.0 |
0.0 |
||
Debtors |
31.7 |
40.6 |
123.2 |
125.0 |
140.0 |
145.0 |
||
Cash |
4.8 |
13.4 |
242.8 |
128.2 |
232.9 |
332.1 |
||
Customer balances |
13.0 |
14.8 |
112.0 |
120.0 |
130.0 |
140.0 |
||
Current Liabilities |
|
|
(50.4) |
(81.0) |
(641.5) |
(240.0) |
(260.0) |
(270.0) |
Creditors |
(46.4) |
(77.3) |
(238.0) |
(240.0) |
(260.0) |
(270.0) |
||
Short term borrowings |
(4.1) |
(3.7) |
(403.5) |
0.0 |
0.0 |
0.0 |
||
Long Term Liabilities |
|
|
(8.8) |
(22.6) |
(76.9) |
(320.0) |
(320.0) |
(320.0) |
Long term borrowings |
(3.1) |
(19.8) |
0.0 |
(250.0) |
(250.0) |
(250.0) |
||
Other long term liabilities |
(5.7) |
(2.8) |
(76.9) |
(70.0) |
(70.0) |
(70.0) |
||
Net Assets |
|
|
149.5 |
128.1 |
1,397.3 |
1,337.2 |
1,319.9 |
1,297.1 |
CASH FLOW |
||||||||
Operating Cash Flow |
|
|
48.5 |
62.5 |
34.0 |
199.1 |
271.6 |
286.0 |
Tax |
(0.5) |
(0.7) |
(7.9) |
(15.0) |
(18.5) |
(24.6) |
||
Net Interest |
(0.1) |
0.0 |
(47.7) |
(15.0) |
(10.0) |
(10.0) |
||
Capex |
(5.3) |
(6.2) |
(34.8) |
(30.0) |
(30.0) |
(30.0) |
||
Acquisitions/disposals |
(8.0) |
(2.4) |
(1,491.5) |
5.0 |
0.0 |
0.0 |
||
Financing |
0.9 |
(24.5) |
1,426.6 |
(3.5) |
0.0 |
0.0 |
||
Dividends |
(33.6) |
(34.3) |
0.0 |
(130.9) |
(108.5) |
(122.2) |
||
Net Cash Flow |
1.9 |
(5.6) |
(121.3) |
9.7 |
104.7 |
99.2 |
||
Opening net debt/(cash) |
|
|
4.3 |
2.4 |
10.2 |
131.5 |
121.8 |
17.1 |
HP finance leases initiated |
(0.6) |
(1.5) |
0.0 |
0.0 |
0.0 |
0.0 |
||
FX/ Other |
0.7 |
(0.7) |
0.0 |
0.0 |
0.0 |
0.0 |
||
Closing net debt/(cash) |
|
|
2.4 |
10.2 |
131.5 |
121.8 |
17.1 |
(82.1) |
Source: GVC Holdings accounts, Edison Investment Research. Note. *2016 are pro forma as if bwin were included from 1 January 2016. **Share count affected by ongoing option programme. ***EBITDA margin on NGR.
|
|
Research: Healthcare
Yesterday Onxeo announced its first preclinical proof-of-concept data with AsiDNA demonstrating the potential to be administrated intravenously. AsiDNA, a first-in-class DNA repair inhibitor, has already been tested in a Phase I trial with melanoma patients and showed promising results in terms of safety and initial signs of efficacy administered via local injection. After Onxeo acquired the drug in February 2016, the company repositioned the development and now seeking to establish a pre-clinical dossier to start human trials with intravenous injection, which would vastly increase the addressable indications. Yesterday’s announcement was the first substantial step in this direction, as Onxeo showed that AsiDNA was effective alone or in combination with carboplatin in murine models of triple negative breast cancer (TNBC).