Last close As at 18/08/2026
—
— 0.00 (0.00%)
Market capitalisation
—
Research: Metals & Mining
Alphamin announced record quarterly tin production of 4,917t (+22.1% quarter-on-quarter) in Q324 and EBITDA of US$91.6m (+68.8%) after the Mpama South mine completed its first full quarter of production at (or near) steady state. Alphamin’s consolidated annual financial statements and accompanying management discussion and analysis (MD&A) for FY24 will probably be released in early March. In the meantime, we are forecasting that EPS will continue to advance into FY25 and beyond under the influence of continued strength in the tin price and increasing efficiencies as both Mpama North and Mpama South develop (in particular) along strike.
Alphamin Resources |
From alpha to omega |
Q324 results and site visit |
Metals and mining |
15 November 2024 |
Share price performance
Business description
Next events
Analyst
Alphamin Resources is a research client of Edison Investment Research Limited |
|||||||||||||||||||||||||||||||||||||||||||||||||
Alphamin announced record quarterly tin production of 4,917t (+22.1% quarter-on-quarter) in Q324 and EBITDA of US$91.6m (+68.8%) after the Mpama South mine completed its first full quarter of production at (or near) steady state. Alphamin’s consolidated annual financial statements and accompanying management discussion and analysis (MD&A) for FY24 will probably be released in early March. In the meantime, we are forecasting that EPS will continue to advance into FY25 and beyond under the influence of continued strength in the tin price and increasing efficiencies as both Mpama North and Mpama South develop (in particular) along strike.
Year |
Revenue (US$m) |
PBT* |
EPS* |
DPS |
P/E |
Yield |
12/22 |
391 |
185 |
0.08 |
0.06 |
11.0 |
4.9 |
12/23 |
289 |
95 |
0.04 |
0.06 |
23.7 |
4.9 |
12/24e |
541 |
213 |
0.08 |
0.09 |
10.6 |
7.4 |
12/25e |
585 |
236 |
0.10 |
0.15 |
8.9 |
12.2 |
Note: *PBT and EPS are as reported.
FY24 interim dividend doubled to C$0.06/share
At the same time as announcing its operational results on 3 October, Alphamin also declared a doubling of its interim dividend to C$0.06/share. This is a significant expression of confidence in both the ramp-up of the Mpama South mine and conditions in the tin market generally.
Recent site visit highlighted strategy and tactics
A recent site visit to the mine revealed a lean and well-run operation protected from regional events by its remoteness and obscurity in an environment of thick rainforest. The company’s immediate focus is on brownfields exploration to extend the lives of both Mpama North (currently estimated by Edison to be 12 years) and Mpama South (14 years). Exploration at Mpama North – where the grade in individual stopes can reach as high as 15% – is focused on exploration along strike, where successful extensions will lead to the lowest-cost production opportunities, accessible for only incremental lateral development costs and zero vertical development costs. Once the current programme of drilling from surface at Mpama South at depth below the bottom end of the current resource boundary has been completed, Alphamin will update its reserves and resources and its mine plans (likely in FY26).
Valuation: Peers imply C$2.62
We are forecasting earnings to almost treble in FY25 relative to FY23. At the same time, Alphamin is priced at multiples that are cheaper than the averages of its peers in 75% of (ie 9 out of 12) valuation measures. On a discrete basis, it is cheaper than its peers in 19 out of 33 (or 57%) of valuation measures. Reverse engineered, we calculate that the average Alphamin share price implied by the average multiples of its peers is C$2.62 – not least on account of its high relative dividend yield deriving from its imminent effective net debt-free status, its increased cash generation (with Mpama South) and its intention to retain only US$25–40m on its balance sheet in the absence of any new, major development projects.
Q324 results
Alphamin announced record quarterly tin production of 4,917t (+22.1% quarter-on-quarter) in Q324, EBITDA of US$91.6m (+68.8%) and a doubled C$0.06 interim FY24 dividend. A summary of its operating results in the quarter relative to the prior seven quarters – plus our forecasts for Q4 and FY24 – is provided in the table below:
Exhibit 1: Alphamin operating results, Q422–Q424e
Q422 |
FY22 |
Q123 |
Q223 |
Q323 |
Q423 |
FY23 |
Q124 |
Q224 |
Q324 |
Q424e |
FY24e |
|
Tonnes processed |
106,087 |
436,400 |
95,751 |
99,035 |
100,395 |
105,510 |
400,691 |
109,424 |
166,676 |
229,107 |
225,000 |
730,207 |
Tin grade (%) |
4.0 |
3.82 |
4.4 |
4.2 |
4.1 |
4.0 |
4.15 |
3.83 |
3.2 |
2.9 |
3.0 |
3.14 |
Contained tin (t) |
4,243 |
16,652 |
4,194 |
4,169 |
4,096 |
4,199 |
16,659 |
4,191 |
5,334 |
6,644 |
6,750 |
22,919 |
Overall plant recovery (%) |
73.0 |
75.0 |
76.0 |
76.0 |
76.0 |
75.0 |
75.4 |
75.0 |
75.0 |
73.5 |
74.1 |
74.6 |
Actual payable tin produced (t) |
3,113 |
12,493 |
3,187 |
3,151 |
3,104 |
3,126 |
12,568 |
3,142 |
4,028 |
4,917 |
5,000 |
17,087 |
Payable tin sold (t) |
3,119 |
12,764 |
3,161 |
3,068 |
3,110 |
2,046 |
11,385 |
4,126 |
3,245 |
5,552 |
5,000 |
17,923 |
Tin price achieved (US$/t) |
21,436 |
30,636 |
26,432 |
25,587 |
26,557 |
25,157 |
26,009 |
26,863 |
32,314 |
31,757 |
30,595 |
30,407 |
AISC* (US$/t Sn sold) |
13,439 |
14,237 |
13,915 |
13,987 |
14,625 |
14,638 |
14,205 |
14,858 |
15,556 |
15,728 |
15,700 |
15,489 |
Source: Alphamin Resources, Edison Investment Research. Note: As reported (100% basis). *All-in sustaining costs.
The increase in tin production was largely the result of the Mpama South expansion contributing for a full quarter compared to only half the quarter in Q224, which resulted in a 37.5% increase in ore processed to 229.1kt (cf a pro-rata target rate of 225kt per quarter). The tin grade of the ore feed was similarly in line with expectations, at 2.9%, to produce metal at a rate of c 20,000t per annum at steady state. Both processing facilities were reported to have performed well during the quarter and achieved an overall plant recovery of 73.4%, in line with expectations. Tin sales increased by 71.1% to 5,552t, which exceeded production by 635t and, to all intents and purposes, cleared the sales backlog experienced in Q2.
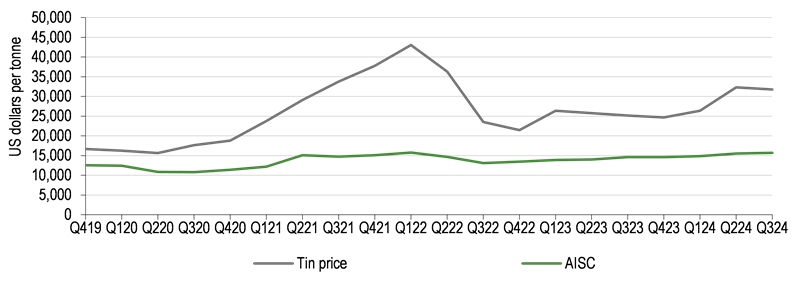
The all-in sustaining cost (AISC) per tonne of tin sold was US$15,728 and was in line with both expectations and the prior quarter’s number of US$15,556/t. As such, in the 19 quarters since Q419 (NB Alphamin declared commercial production in Q319), Alphamin’s AISC have risen by only 25.2% – a rate equivalent to a compound annual average growth rate of just 4.8% per annum – at a time when US dollar costs would have been expected to rise, on average, by 22.7% (or an average of 4.4% per annum) as a result of inflation alone. This increase is despite a 77.9% increase in the price of tin over the same time period, which directly affects costs in the form of royalties, marketing fees and export duties, etc. Alphamin’s AISC of US$15,728/t in Q324 implies a cash margin of 47.0% relative to a tin price at the time of writing of US$29,663/t.
|
Exhibit 2: Alphamin’s all-in sustaining costs compared to the tin price, Q419–Q324 (US$/t) |
|
|
Source: Alphamin Resources, Edison Investment Research |
With the exception of a period of volatility in the first two full quarters after commercial production was declared, this near 50% gross margin is in line with the average gross margin calculated for the period Q319–Q424e:
|
Exhibit 3: Alphamin gross margin, Q319–Q424e (%) |
|
|
Source: Edison Investment Research, Alphamin Resources |
Off-mine costs are expected to reduce from early Q424 owing to a c 60% reduction in marketing fees as a condition of the previously announced extension of the tin concentrate off-take agreement with Gerald Metals.
Site visit
Alphamin hosted a visit for analysts and interested parties to both Mpama North and Mpama South between 9 and 11 October. The site visit was attended by Edison and a summary of the author’s principal observations and conclusions regarding the operation is as follows:
■
Entry into the Democratic Republic of the Congo was via Goma (population circa two million) on the northern shore of Lake Kivu in the North Kivu province. Contrary to the image often portrayed in mainstream media, Goma gave the impression of being a vibrant and busy city and not at all a war-torn ruin on the frontline of a civil war at the mercy of various foreign-backed rebel militias. While there was a noticeable army and UN presence near the airport, there was no visible tension. Street markets appeared busy and there was little or no sense of any disruption to civil society.
■
The journey out to the mine was undertaken by a c 45-minute flight by light aircraft and the major impression was the unbroken canopy of rainforest and of the remoteness of the mine site relative to any population centres. The aircraft landed at Alphamin’s own purpose-built airstrip at Bisie a short (c 25 minute) drive to the mine. Security on the drive was provided, although there was little explicit evidence that it was necessary. With the exception of a handful of local pedestrians, no other users of either the airstrip or the road to the mine were observed.
■
The mine was located on the side of the Bisie ridge with the processing plant at its foot. The footprint of the entire operation was small – approximately 1.8 x 1.0 kilometres. Ingress to the mine was achieved via adits, with the main vertical artery being a spiral decline. While developed separately, the two mines are now connected via two drives from 8 and 9 Levels, which provides flexibility to the overall mining operation.
■
Grades in individual stopes can be as high as 15% tin (which would probably be extracted at c 13% Sn). In general, grades are higher in northern sections of Mpama North and also at depth (albeit at a reduced strike length, but nevertheless containing more tin on balance). Reserves at the current fully developed echelon are sufficient to support mining for another 2.0–2.5 years, after which operations drop to the next level. Within this context, Alphamin is conducting ongoing grade control drilling at a rate of c 1,000m per month. It has also re-commenced exploration drilling, with one drill rig underground at Mpama North and another drilling from surface at Mpama South (to target extensions at depth below the resource). Activity at Mpama North, in particular, is focused on exploration along strike, where the orebody appears to thin, but where successful strike extensions will lead to the lowest-cost production opportunities, accessible for only incremental lateral development costs and zero vertical development costs.
■
Once the current programme of underground, brownfields exploration has been completed, Alphamin will update its reserves and resources (likely in FY26) and its mine plans. Simultaneously, as soon as an external review of its exploration and drilling data has been completed with recommendations for priority areas for exploration, we expect it to conduct regional exploration along the Bisie Ridge, up to 3km to the north of Mpama North and up to 10km to the south of Mpama South.
|
Exhibit 4: Underground drilling at Mpama North |
Exhibit 5: Photograph of Mpama South plant shaking tables showing pink cassiterite concentrate bands |
|
|
|
Source: Edison Investment Research |
|
Exhibit 4: Underground drilling at Mpama North |
|
|
Source: Edison Investment Research |
|
Exhibit 5: Photograph of Mpama South plant shaking tables showing pink cassiterite concentrate bands |
|
|
Source: Edison Investment Research |
■
In addition to visiting the mine, we were also given the opportunity to visit the new Mpama South plant and (old) No. 1 and (new) No. 2 tailings dams. Overall, the plant presented itself as a neat, highly engineered, modern and logical tin concentration pathway, comprising a number of gravimetric processes by which to recover cassiterite, including an initial jig (by far the most important component, recovering c 40% of the crushed ore, but c 92% of the contained tin), followed (inter alia) by shaking tables, spirals and a centrifugal fine tin recovery circuit.
|
Exhibit 6: From Alpha – Mpama North mine (also showing a section of the plant) |
Exhibit 7: To Omega – the No. 2 Tailings dam ready for deposition |
|
|
|
Source: Edison Investment Research |
|
Exhibit 6: From Alpha – Mpama North mine (also showing a section of the plant) |
|
|
Source: Edison Investment Research |
|
Exhibit 7: To Omega – the No. 2 Tailings dam ready for deposition |
|
|
Source: Edison Investment Research |
■
All of Alphamin’s tailings storage facilities (TSFs) are downstream of the plant and are of the ‘valley-fill’ type of design. As the No. 1 tailings dam nears capacity, with only approximately six months of deposition available to it, Alphamin has constructed its No. 2 dam, which should now last the best part of 10 years. Beyond that, the operation is permitted for a number of other, similar TSFs of a similar design. Given the absence of either harsh chemicals in the plant (which runs almost exclusively on water) or acid drainage, the TSFs are unlined.
In conclusion, should any readers have the opportunity to attend a similar site visit in the future, we would recommend that they accept the invitation.
FY24 forecasts
With the caveat that the quarterly results of mining companies can demonstrate material volatility relative to both historical results and analysts’ forecasts, our quarterly estimates for Alphamin for FY24 are provided in the table below. At the time of writing, the three-month price of tin is US$29,663/t and, for the purposes of forecasting, we have assumed this price prevails for the remainder of the year.
Exhibit 8: Edison forecast of Alphamin income statement, FY24e, by quarter (US$ unless otherwise indicated)
Q124 |
Q224 |
Q324e |
Q424e |
FY24e |
FY24e |
|
Tons processed (t) |
109,424 |
166,676 |
229,107 |
225,000 |
730,207 |
799,715 |
Tin grade (%) |
3.83 |
3.2 |
2.9 |
3.0 |
3.14 |
3.09 |
Contained tin (t) |
4,191 |
5,334 |
6,644 |
6,750 |
22,919 |
24,751 |
Overall plant recovery (%) |
75.0 |
75.0 |
73.5 |
74.1 |
74.6 |
75.9 |
Actual payable tin produced (t) |
3,142 |
4,028 |
4,917 |
5,000 |
17,087 |
18,782 |
Payable tin sold (t) |
4,126 |
3,245 |
5,552 |
5,000 |
17,923 |
18,782 |
Tin price achieved (US$/t) |
26,863 |
32,314 |
31,757 |
30,595 |
30,407 |
30,891 |
Revenue |
109,310,086 |
103,860,882 |
174,545,424 |
152,972,602 |
540,688,994 |
580,209,818 |
Cost of goods sold |
(53,482,478) |
(41,980,750) |
(76,287,026) |
(64,945,690) |
(236,695,944) |
(239,035,357) |
Depreciation |
8,409,107 |
10,993,696 |
13,997,510 |
14,485,877 |
47,886,190 |
43,252,730 |
Gross profit |
47,418,501 |
50,886,436 |
84,260,888 |
73,541,036 |
256,106,861 |
297,921,731 |
General and administrative |
(5,644,404) |
(7,069,192) |
(8,554,310) |
(8,554,310) |
(29,822,216) |
(23,362,329) |
Operating profit/(loss) |
41,774,097 |
43,817,244 |
75,706,578 |
64,986,726 |
226,284,645 |
274,559,402 |
Other |
||||||
Warrants |
0 |
0 |
0 |
0 |
0 |
|
Profit on foreign exchange |
(336,214) |
(139,245) |
(226,367) |
(701,826) |
||
Loss on write-off of assets |
0 |
0 |
||||
Interest expense |
(3,493,836) |
(3,655,921) |
(3,980,940) |
|||
Interest income |
5,645 |
4,488 |
169,357 |
|||
Net interest |
(3,488,191) |
(3,651,433) |
(3,811,583) |
(1,400,000) |
(12,351,207) |
(217,408) |
Profit before taxes |
37,949,692 |
40,026,566 |
71,668,628 |
63,586,726 |
213,231,612 |
274,341,993 |
Current income tax expense |
(9,695,498) |
(19,913,278) |
(29,803,626) |
(23,209,155) |
(82,621,557) |
(82,302,598) |
Deferred tax movement |
(3,349,157) |
2,395,022 |
(1,057,274) |
(2,011,409) |
||
Total tax |
(13,044,655) |
(17,518,256) |
(30,860,900) |
(23,209,155) |
(84,632,966) |
(82,302,598) |
Effective tax rate (%) |
34.4 |
43.8 |
43.1 |
36.5 |
39.7 |
30.0 |
Net profit/(loss) |
24,905,037 |
22,508,310 |
40,807,728 |
40,377,571 |
128,598,646 |
192,039,395 |
Attributable to: |
||||||
Shareholders |
20,706,866 |
18,082,637 |
32,941,038 |
33,973,688 |
105,704,229 |
161,581,947 |
Non-controlling interests |
4,198,171 |
4,425,673 |
7,866,690 |
6,403,883 |
22,894,417 |
30,457,448 |
Minority (%) |
16.9 |
19.7 |
19.3 |
15.86 |
17.80 |
15.86 |
Total |
24,905,037 |
22,508,310 |
40,807,728 |
40,377,571 |
128,598,646 |
192,039,395 |
Weighted average number of shares in period |
1,275,429,527 |
1,275,632,105 |
1,275,787,191 |
1,276,210,479 |
1,275,764,826 |
1,275,343,813 |
Derivatives |
10,002,198 |
13,264,088 |
10,729,444 |
12,800,000 |
11,698,933 |
11,646,582 |
Fully diluted weighted average number of shares in issue |
1,285,431,725 |
1,288,896,193 |
1,286,516,635 |
1,289,010,479 |
1,287,463,758 |
1,286,990,395 |
Headline earnings |
20,706,866 |
18,082,637 |
32,941,038 |
33,973,688 |
105,704,229 |
161,581,947 |
Headline earnings (excluding warrant charge) |
20,706,866 |
18,082,637 |
32,941,038 |
33,973,688 |
105,704,229 |
161,581,947 |
EPS (US$/share) |
0.0162 |
0.0142 |
0.0258 |
0.0266 |
0.0829 |
0.1267 |
Diluted EPS (US$/share) |
0.0161 |
0.0140 |
0.0256 |
0.0264 |
0.0821 |
0.1256 |
HEPS* (US$/share) |
0.0162 |
0.0142 |
0.0258 |
0.0266 |
0.0829 |
0.1267 |
Diluted HEPS (US$/share) |
0.0161 |
0.0140 |
0.0256 |
0.0264 |
0.0821 |
0.1256 |
Headline EPS excluding warrant charge (US$/share) |
0.0162 |
0.0142 |
0.0258 |
0.0266 |
0.0829 |
0.1267 |
Source: Alphamin, Edison Investment Research. Note: Company presented basis. *HEPS, headline earnings per share: a South African reporting requirement based entirely on operational, trading and capital investment activities and excluding profits or losses from the sale or termination of discontinued operations, fixed assets or related businesses or from any permanent devaluation or write-off of their values.
Although, on the face of it, our earnings forecasts have declined since the time of our last note, this reflects little more than production at Mpama South ramping up from May instead of January and a three-month delay in the tin price meeting our forecast long-term price of US$31,651/t. Otherwise, Alphamin’s forecast effective tax rate of 39.7% for FY24 is in line with both the historical norm and the corporate income tax rate for mining companies in the Democratic Republic of the Congo of 30% (plus dividend withholding taxes). At the same time, its percentage minority interest of 17.80% is close to the level expected given Alphamin’s 84.14% ownership of the Bisie mining complex.
Beyond FY24
Beyond FY24, we expect Alphamin’s EPS profile to continue to grow as:
■
Mpama South achieves a full year of production, and
■
costs (which we expect to remain at FY24’s level in FY25) begin to abate as operating efficiencies are achieved.
As a result, we forecast earnings to nearly treble from FY23 to FY25 and Alphamin’s maximum potential dividend to increase to in excess of 15 US cents per share (in excess of 20 Canadian cents per share). At Alphamin’s current share price, this suggests a current year P/E ratio falling from 17.9x in FY23 to 10.6x currently and 6.2x in FY28.
|
Exhibit 9: Alphamin estimated future EPS, (maximum potential*) DPS and valuation, LOM |
|
|
Source: Edison Investment Research. Note: *From FY27. |
Consistent with its near 50% gross margin, each 10% change in the tin price from current levels results in a c 20% change in our EPS forecasts.
Dividends
In addition to its operational results, on 3 October, Alphamin announced that the board has declared an interim FY24 cash dividend of C$0.06/share (c US$57m in aggregate), which is double the interim dividend in FY23 and implies a full year payout of C$0.12/share. The dividend was paid on 4 November to shareholders of record as of the close of business on 25 October.
In future, dividends will be assessed every six months with respect to profitability, cash flow and investment commitments. Subject to these considerations however, a payout ratio of approximately 50% of EBITDA is anticipated, all other things being equal. Note however that, for the purposes of our dividend forecasts, we have assumed that Alphamin will wish to retain US$40m in cash on its balance sheet in both FY25 and FY26.
Relative valuation
Profitable, listed tin producers are relatively rare, even globally, and producers of tin concentrate even rarer. Below is a table of companies that Edison believes reasonably represent Alphamin’s closest peers, together with a series of commonly used prospective valuation multiples (where available).
Exhibit 10: Alphamin valuation relative to four tin peers
Company |
Comment |
Mkt cap |
P/E ratio (x) |
EV/EBITDA (x) |
Yield (%) |
P/CF (x) |
|||||||||
Yr 1 |
Yr 2 |
Yr 3 |
Yr 1 |
Yr 2 |
Yr 3 |
Yr 1 |
Yr 2 |
Yr 3 |
Yr 1 |
Yr 2 |
Yr 3 |
||||
Alphamin |
1,117.7 |
10.6 |
8.9 |
7.9 |
4.3 |
3.9 |
3.5 |
7.4 |
12.2 |
14.3 |
5.4 |
6.0 |
5.0 |
||
Metals X |
Australia’s largest tin* producer |
252.5 |
2.7 |
2.5 |
0.0 |
0.0 |
|||||||||
Yunnan Tin |
Chinese refined tin producer |
3,422.8 |
13.6 |
10.6 |
9.9 |
7.3 |
6.1 |
6.3 |
2.2 |
2.8 |
3.1 |
4.8 |
5.1 |
5.6 |
|
PT Timah |
Indonesian refined producer plus logistics |
627.9 |
9.9 |
7.1 |
7.0 |
4.0 |
3.0 |
3.4 |
0.0 |
0.0 |
5.5 |
||||
Malaysia Smelting |
Malaysian refined tin producer |
210.0 |
10.5 |
8.7 |
7.3 |
6.8 |
5.7 |
4.7 |
3.4 |
3.7 |
4.6 |
||||
Average |
11.3 |
8.8 |
8.1 |
5.2 |
4.3 |
4.8 |
1.4 |
1.6 |
4.4 |
4.8 |
5.1 |
5.6 |
|||
Implied AFM share price (C$) |
1.31 |
1.21 |
1.25 |
1.53 |
1.40 |
1.74 |
6.42 |
9.06 |
3.99 |
1.10 |
1.03 |
1.37 |
|||
Source: Edison Investment Research, LSEG Data & Analytics. Note: *Concentrate. Peers priced at 15 November 2024.
Of note is the fact that Alphamin is priced at multiples that are cheaper than the averages of its peers in 75% of (ie 9 out of 12) valuation measures. On a discrete basis, it is cheaper than its peers in 19 out of 33 (or 57%) of valuation measures. Alternatively, we calculate that the average Alphamin share price implied by the average multiples of its peers is C$2.62. Part of the reason for this is our assumption of a sharply increased dividend in FY25 and into the future, reflecting Alphamin’s near net debt-free status, its increased cash generation (with Mpama South) and its intention to retain only US$25–40m in cash on its balance sheet in the absence of any new, major development projects.
Financials
In the first nine months of FY24, Alphamin generated US$163.3m in operational cash flow, before investing US$46.4m in capex to result in a net cash inflow before financing items of US$116.9m and net debt (excluding leases) reducing from US$65.3m at end-FY23 to US$1.1m at end-Q324. Hereafter, however, we expect Alphamin to be strongly cash generative, as during the period Q419–Q222 at Mpama North, but with the added benefit of meaningful, low-cost production from Mpama South as well. At the same time, we anticipate that capex will return to near sustaining levels only.
Exhibit 11: Financial summary
Accounts: IFRS, Yr end: December, $000s |
|
|
2019 |
2020 |
2021 |
2022 |
2023 |
2024E |
2025E |
2026E |
INCOME STATEMENT |
|
|
|
|
|
|
|
|
|
|
Total revenues |
|
|
27,221 |
187,445 |
352,883 |
391,052 |
288,505 |
540,689 |
585,198 |
612,034 |
Cost of sales |
|
|
(7,915) |
(119,554) |
(138,217) |
(146,983) |
(130,257) |
(236,696) |
(249,062) |
(243,890) |
Gross profit |
|
|
19,306 |
67,892 |
214,666 |
244,069 |
158,248 |
303,993 |
336,136 |
368,145 |
SG&A (expenses) |
|
|
(14,526) |
(17,238) |
(19,754) |
(24,797) |
(21,952) |
(29,822) |
(34,217) |
(34,217) |
R&D costs |
|
|
0 |
0 |
0 |
0 |
0 |
0 |
0 |
0 |
Other income/(expense) |
|
|
0 |
0 |
0 |
0 |
0 |
0 |
0 |
0 |
Exceptionals and adjustments |
|
(3,673) |
(7,649) |
(3,680) |
(2,885) |
763 |
0 |
0 |
0 |
|
Depreciation and amortisation |
|
|
(7,927) |
(25,471) |
(26,632) |
(28,806) |
(31,289) |
(47,886) |
(59,985) |
(63,189) |
Reported EBIT |
|
|
(3,147) |
25,182 |
168,279 |
190,467 |
105,007 |
226,285 |
241,934 |
270,738 |
Finance income/(expense) |
|
|
(6,330) |
(15,614) |
(8,358) |
(4,820) |
(7,207) |
(12,351) |
(6,327) |
(5,600) |
Other income/(expense) |
|
|
(4) |
(1,518) |
(874) |
(499) |
(2,334) |
(702) |
0 |
0 |
Exceptionals and adjustments |
|
6,850 |
(8,776) |
(26,922) |
(484) |
0 |
0 |
0 |
0 |
|
Reported PBT |
|
|
(2,632) |
(725) |
132,126 |
184,664 |
95,466 |
213,232 |
235,607 |
265,138 |
Income tax expense (includes exceptionals) |
|
|
7,755 |
(7,141) |
(68,558) |
(62,933) |
(37,502) |
(84,633) |
(85,997) |
(96,775) |
Reported net income |
|
|
5,123 |
(7,866) |
63,568 |
121,731 |
57,964 |
128,599 |
149,610 |
168,363 |
Basic average number of shares, m |
|
|
845 |
1,066 |
1,195 |
1,272 |
1,275 |
1,276 |
1,276 |
1,276 |
Basic EPS (US$/share) |
|
|
0.01 |
(0.01) |
0.04 |
0.08 |
0.04 |
0.08 |
0.10 |
0.11 |
DPS (C$/share) |
|
|
0.00 |
0.00 |
0.03 |
0.06 |
0.06 |
0.09 |
0.15 |
0.17 |
Adjusted EBITDA |
|
|
8,453 |
58,302 |
198,592 |
222,157 |
135,537 |
274,171 |
301,919 |
333,928 |
Adjusted EBIT |
|
|
526 |
32,831 |
171,959 |
193,352 |
104,248 |
226,285 |
241,934 |
270,738 |
Adjusted PBT |
|
|
(5,809) |
15,699 |
162,728 |
188,032 |
94,707 |
213,232 |
235,607 |
265,138 |
Adjusted EPS (C$/share) |
|
|
0.01 |
(0.01) |
0.05 |
0.10 |
0.05 |
0.11 |
0.14 |
0.15 |
Adjusted diluted EPS (US$/share) |
|
|
0.00 |
(0.01) |
0.04 |
0.08 |
0.04 |
0.08 |
0.10 |
0.11 |
BALANCE SHEET |
|
|
|
|
|
|
|
|
|
|
Property, plant and equipment |
|
|
255,125 |
239,103 |
227,720 |
263,041 |
349,518 |
350,469 |
310,901 |
268,232 |
Goodwill |
|
|
0 |
0 |
0 |
0 |
0 |
0 |
0 |
0 |
Intangible assets |
|
|
0 |
0 |
0 |
0 |
0 |
0 |
0 |
0 |
Other non-current assets |
|
|
10,632 |
15,882 |
27,088 |
27,548 |
37,733 |
44,864 |
59,864 |
74,864 |
Total non-current assets |
|
|
265,757 |
254,985 |
254,808 |
290,589 |
387,251 |
395,333 |
370,765 |
343,097 |
Cash and equivalents |
|
|
5,941 |
6,559 |
90,640 |
119,389 |
7,159 |
53,459 |
40,000 |
40,000 |
Inventories |
|
|
27,755 |
21,866 |
20,674 |
24,814 |
41,809 |
62,216 |
62,066 |
64,912 |
Trade and other receivables |
|
|
1,486 |
7,601 |
47,626 |
27,819 |
42,933 |
38,515 |
41,685 |
43,597 |
Other current assets |
|
|
17,633 |
6,710 |
7,402 |
27,491 |
37,609 |
28,359 |
28,359 |
28,359 |
Total current assets |
|
|
52,815 |
42,736 |
166,342 |
199,513 |
129,509 |
182,548 |
172,109 |
176,867 |
Non-current loans and borrowings |
|
|
78,229 |
34,821 |
0 |
0 |
6,575 |
6,575 |
6,575 |
6,575 |
Other non-current liabilities |
|
|
9,641 |
8,872 |
31,258 |
32,394 |
35,189 |
78,667 |
53,038 |
52,392 |
Total non-current liabilities |
|
|
87,870 |
43,693 |
31,258 |
32,394 |
41,764 |
85,241 |
59,613 |
58,967 |
Trade and other payables |
|
|
22,544 |
16,034 |
10,582 |
21,284 |
38,431 |
30,721 |
34,118 |
33,410 |
Current loans and borrowings |
|
|
16,339 |
25,810 |
17,035 |
4,422 |
65,894 |
65,894 |
65,894 |
65,894 |
Other current liabilities |
|
|
17,233 |
14,253 |
51,541 |
64,597 |
5,159 |
1,895 |
981 |
981 |
Total current liabilities |
|
|
56,116 |
56,098 |
79,158 |
90,303 |
109,484 |
98,510 |
100,993 |
100,285 |
Equity attributable to company |
|
|
145,215 |
171,735 |
274,727 |
320,425 |
312,786 |
336,368 |
326,388 |
308,251 |
Non-controlling interest |
|
|
29,371 |
26,196 |
36,007 |
46,980 |
52,726 |
57,761 |
55,880 |
52,462 |
CASH FLOW |
|
|
|
|
|
|
|
|
|
|
Profit for the year |
|
|
0 |
0 |
0 |
0 |
0 |
0 |
0 |
0 |
Taxation expenses |
|
|
0 |
0 |
0 |
0 |
0 |
0 |
0 |
0 |
Profit before tax |
|
|
(2,632) |
(725) |
132,126 |
184,664 |
95,466 |
213,232 |
235,607 |
265,138 |
Net finance expenses |
|
|
5,456 |
15,616 |
8,359 |
4,912 |
7,568 |
0 |
0 |
0 |
EBIT |
|
|
0 |
0 |
0 |
0 |
0 |
0 |
0 |
0 |
Depreciation and amortisation |
|
|
7,927 |
26,504 |
26,634 |
28,806 |
31,289 |
47,886 |
59,985 |
62,459 |
Share based payments |
|
|
403 |
471 |
681 |
265 |
33 |
0 |
0 |
0 |
Other adjustments |
|
|
(6,851) |
8,842 |
26,985 |
711 |
0 |
0 |
0 |
0 |
Movements in working capital |
|
|
(6,710) |
(20,281) |
(43,636) |
18,833 |
(21,824) |
(14,449) |
377 |
(5,466) |
Interest paid / received |
|
|
(3,092) |
(11,378) |
(6,758) |
(3,597) |
(5,187) |
0 |
0 |
0 |
Income taxes paid |
|
|
0 |
(843) |
(2,196) |
(47,966) |
(105,360) |
(37,891) |
(110,711) |
(97,421) |
Cash from operations (CFO) |
|
|
(5,498) |
18,205 |
142,194 |
186,627 |
1,986 |
208,778 |
185,258 |
224,710 |
Capex |
|
|
(22,720) |
(7,448) |
(22,516) |
(53,447) |
(117,223) |
(49,968) |
(35,418) |
(34,790) |
Acquisitions & disposals net |
|
|
0 |
0 |
0 |
0 |
0 |
0 |
0 |
0 |
Other investing activities |
|
|
(46) |
(96) |
(3,014) |
(19,312) |
0 |
(6,000) |
0 |
0 |
Cash used in investing activities (CFIA) |
|
|
(22,766) |
(7,544) |
(25,531) |
(72,759) |
(117,223) |
(55,968) |
(35,418) |
(34,790) |
Net proceeds from issue of shares |
|
|
11,936 |
10,010 |
19,852 |
2,513 |
343 |
332 |
0 |
0 |
Movements in debt |
|
|
0 |
(18,735) |
(45,198) |
(13,552) |
66,752 |
0 |
0 |
0 |
Dividends paid |
|
|
0 |
0 |
(5,552) |
(71,517) |
(61,027) |
(100,313) |
(161,471) |
(189,919) |
Other financing activities |
|
|
5,165 |
(1,319) |
(1,685) |
(2,563) |
(3,061) |
(6,528) |
(1,828) |
0 |
Cash from financing activities (CFF) |
|
|
17,100 |
(10,044) |
(32,582) |
(85,119) |
3,007 |
(106,510) |
(163,299) |
(189,919) |
Currency translation differences and other |
|
|
0 |
0 |
0 |
0 |
0 |
0 |
0 |
0 |
Increase/(decrease) in cash and equivalents |
|
|
(11,164) |
617 |
84,081 |
28,749 |
(112,230) |
46,300 |
(13,459) |
0 |
Currency translation differences and other |
|
|
0 |
0 |
0 |
0 |
0 |
0 |
0 |
0 |
Cash and equivalents at end of period |
|
|
5,941 |
6,559 |
90,640 |
119,389 |
7,159 |
53,459 |
40,000 |
40,000 |
Net (debt) cash |
|
|
(88,627) |
(54,073) |
73,605 |
114,966 |
(65,310) |
(19,011) |
(32,469) |
(32,469) |
Movement in net (debt) cash over period |
|
|
(24,836) |
34,554 |
127,678 |
41,361 |
(180,277) |
46,300 |
(13,459) |
0 |
Source: Alphamin accounts, Edison Investment Research
|
|
Research: Investment Companies
Apax Global Alpha (AGA) reported a Q324 NAV total return (TR) of 1.7% in euro terms on a constant currency basis (-0.2% including fx changes), with a 3.2pp positive contribution from earnings momentum across its private equity (PE) investments. The company experienced a pick-up in new investments, and also saw some positive trends on the realisation front. Following recent exits and accounting for the take-private transaction of Thoughtworks, AGA’s pro-forma exposure to listed holdings has been reduced to 4%, limiting the impact on AGA’s returns. While these investments have already yielded a realised return of 3x investment cost, their de-rating post IPO has been one of the contributors to AGA’s weaker performance lately. Within its recently updated capital allocation framework, AGA now offers a stable dividend of 11p per share (which implies an attractive 7.5% dividend yield) as well as buybacks funded with excess cash flow from realisations.