Last close As at 05/08/2026
GBP8.17
▲ 7.00 (0.86%)
Market capitalisation
GBP819m
Research: Investment Companies
Finsbury Growth & Income Trust
Finsbury Growth & Income Trust |
Outperformance from a concentrated portfolio |
Investment trusts |
29 March 2016 |
Share price/discount performance
Three-year cumulative perf. graph
Gearing
Analysts
|
|||||||||||||||||||||||||||||||||||||||||||||||||||||||||||||||||||||||||||||||||||||
Finsbury Growth & Income Trust (FGT) is a concentrated portfolio of 25-30 stocks chosen for their quality and potential for long-term growth in total return. Turnover is very low; the last complete disposal was in 2013 and the purchase of Remy Cointreau in 2015 was the first new position in the portfolio for more than four years. Performance has been very strong; FGT has outperformed the peer-group average over one, three, five and 10 years. Although not targeting a high income, FGT has a progressive dividend policy and the 2015 dividend was increased by 7.1%.
12 months ending |
FGT share price |
FGT NAV (%) |
FTSE All-Share |
FTSE 350 |
MSCI World |
29/02/12 |
11.0 |
10.0 |
1.5 |
1.6 |
0.7 |
28/02/13 |
32.4 |
33.5 |
14.1 |
13.8 |
17.2 |
28/02/14 |
20.3 |
20.1 |
13.3 |
13.0 |
10.8 |
28/02/15 |
14.9 |
15.0 |
5.6 |
5.7 |
17.6 |
29/02/16 |
2.1 |
2.1 |
(7.3) |
(7.5) |
(0.7) |
Source: Thomson Datastream. Note: Total return basis.
Investment strategy: Concentration in four sectors
Manager Nick Train is well known for his long-term investment approach aiming to “buy great companies and hold them forever”. He seeks well-established companies with strong franchises, purchased at attractive valuations. The majority of positions are large cap and listed in the UK, but up to 20% of the NAV may be in companies listed overseas (currently 18.8%). The portfolio is concentrated with 25-30 names in just four sectors: consumer goods; consumer services; financials; and technology. More than two-thirds of the trust is invested in the consumer sectors. Gearing is modest and used for individual investment purposes rather than a means to take a view on the market.
Market outlook: UK relatively well positioned
Despite volatile stock markets in 2015, the FTSE All-Share Index ended the year with a positive total return, albeit modest. The volatility has continued into 2016 and there has been marked sector rotation. However, growth forecasts for the UK as measured by the IMF have been maintained versus forecast reductions for several other regions. Household disposable income is higher year-on-year and the weak oil price should bode well for continued growth in discretionary spending.
Valuation: Regularly trading at a premium
Demand for FGT remains robust; the shares are currently trading very close to cum-income net asset value. This compares to a range of a 1.2% discount to a 1.6% premium over the last 12 months. The average over the last one, three and five years is a premium of 0.5%. New shares are issued if there are unfulfilled buy orders in the market; during 2015, 23m shares were issued raising £134m. FGT has a progressive dividend policy and a current yield of 2.0%.
Exhibit 1: Trust at a glance
Investment objective and fund background |
Recent developments |
||||||||||||||||||||||||||||||||||||||||||||||||||||||||||||||||||||||
FGT’s investment objective is to achieve capital and income growth and provide shareholders with a total return above that of the FTSE All-Share Index. It invests principally in the securities of UK-quoted companies, but up to a maximum of 20% at the time of acquisition can be invested in non-UK-quoted companies. FTSE 100 companies normally represent 50-100% of the portfolio, with at least 70% usually invested in FTSE 350 companies. |
■ 10 March 2016: Announcement of 6.1p first interim dividend for FY16. ■ 6 January 2016: Block listing interim review for 3 July 2015 to 5 January 2016; 10.35m unallotted shares. ■ 10 December 2015: Annual results published for the year ended 30 September. NAV TR +12.0% versus -2.3% for FTSE All-Share. ■ 3 December 2015: Block listing application for 10m new shares, to be issued according to market demand. |
||||||||||||||||||||||||||||||||||||||||||||||||||||||||||||||||||||||
Forthcoming |
Capital structure |
Fund details |
|||||||||||||||||||||||||||||||||||||||||||||||||||||||||||||||||||||
AGM |
February 2017 |
Ongoing charges |
0.8% |
Group |
Frostrow Capital |
||||||||||||||||||||||||||||||||||||||||||||||||||||||||||||||||||
Interim results |
May 2016 |
Net gearing |
4.0% |
Managers |
Lindsell Train |
||||||||||||||||||||||||||||||||||||||||||||||||||||||||||||||||||
Year end |
30 September |
Annual mgmt fee |
£70k +0.6% market cap |
Address |
25 Southampton Buildings, |
||||||||||||||||||||||||||||||||||||||||||||||||||||||||||||||||||
Dividend paid |
May, October |
Performance fee |
None |
||||||||||||||||||||||||||||||||||||||||||||||||||||||||||||||||||||
Launch date |
January 1926 |
Trust life |
Indefinite |
Phone |
+44 (0)20 3008 4910 |
||||||||||||||||||||||||||||||||||||||||||||||||||||||||||||||||||
Continuation vote |
None |
Loan facilities |
£50m revolving |
Website |
|||||||||||||||||||||||||||||||||||||||||||||||||||||||||||||||||||
Dividend policy and history |
Share buyback policy and history |
||||||||||||||||||||||||||||||||||||||||||||||||||||||||||||||||||||||
Two dividends annually, paid in May and October. The dividend is expected to rise over the longer term. |
Renewed annually, the trust has authority to purchase up to 14.99% and allot up to 10% of issued share capital. |
||||||||||||||||||||||||||||||||||||||||||||||||||||||||||||||||||||||
|
|
||||||||||||||||||||||||||||||||||||||||||||||||||||||||||||||||||||||
Shareholder base (as at 29 February 2016) |
Distribution of portfolio (as at 29 February 2016) |
||||||||||||||||||||||||||||||||||||||||||||||||||||||||||||||||||||||
|
|
||||||||||||||||||||||||||||||||||||||||||||||||||||||||||||||||||||||
Top 10 holdings (as 29 February 2016) |
|||||||||||||||||||||||||||||||||||||||||||||||||||||||||||||||||||||||
|
|||||||||||||||||||||||||||||||||||||||||||||||||||||||||||||||||||||||
Source: Finsbury Growth & Income Trust, Edison Investment Research, Morningstar, Thomson. Note: *N/A where not in February 2015 top 10. **Formerly Reed Elsevier.
Market outlook: UK a relative bright spot?
2015 was a volatile period in the stock markets; the FTSE All-Share Index ended the year with a total return of +1.27%. 2016 has started in a similar vein; the first two months of the year had a total return of -2.26%. As shown in Exhibit 2 (left hand side) there has been significant rotation in the market with defensives outperforming cyclical stocks for most of 2015, before undergoing a sharp correction in 2016 that has started to reverse again. Investor concerns have included slowing global growth, weak commodity prices and the upcoming Brexit referendum. However, in its latest World Economic Outlook, the IMF held its projections for UK GDP growth at 2.2% for both 2016 and 2017, while reducing forecasts for world output. As shown in the right-hand chart below, although UK household disposable income growth is moderating, it is still at a relatively high level and inflation remains low. This bodes well for continued growth in consumer discretionary spending.
|
Exhibit 2: FTSE Defensive vs FTSE Cyclical indices and UK household income vs inflation |
|
FTSE Defensive vs FTSE Cyclical TR since end-February 2015 |
UK household disposable income and CPI inflation, % change year-on-year |
|
|
|
Source: Bloomberg, Asda income tracker, Office for National Statistics, Edison Investment Research |
|
Fund profile: Very long-term focus
Finsbury Growth & Income Trust (FGT) was launched in 1926. Since December 2000, it has been managed by Nick Train, a founding partner of Lindsell Train Investment Management. The name of the trust was changed from Finsbury Growth Trust in 2004 to reflect the focus on total return; the fund sits in the AIC UK Equity Income sector. The portfolio is concentrated, holding around 30 high-quality, mainly UK companies with strong brands and/or market positions for the very long term; as a result turnover is low. Due to strong investor demand and capital appreciation, the size of the trust has grown significantly in recent years.
Up to 20% of the portfolio at the time of investment may be in overseas-listed companies. Typically position sizes are more than 1% unless a holding is being built or disposed of. Normally at least 70% of the portfolio is held in large capitalisation stocks (in the FTSE 350 Index or comparable-sized companies on overseas exchanges). Up to 25% of gross assets may be held in preference shares, bonds and other debt instruments and a maximum of 10% may be held in cash.
The fund manager: Nick Train
The manager’s view: M&A highlights value in equities
According to Bloomberg, in 2015 there were $5.7tn of merger or takeover deals announced globally, surpassing the record $4.9tn in 2007. Manager Nick Train comments that it is no accident that we are in the midst of the largest M&A boom in history. Consolidation is occurring as a result of low nominal growth rates outside of some technology businesses; M&A is seen as an attractive opportunity to generate synergies and reduce costs. Current technologies are helping to achieve productivity gains that were unavailable 10 years ago. 3G Capital, the Brazilian private equity business behind mergers including Kraft/Heinz and AB InBev/SABMiller has very publically adopted zero-based budgeting, which is significantly increasing short-term profitability. In doing so, it has thrown down the gauntlet to other market participants.
The manager believes that the uptick in M&A is encouraging as it promises improvements in productivity over time and indicates that companies still see good value in the stock markets. He sees it as reassuring given the prevalent volatility and investor pessimism. However, companies without long-term time horizons are selling out too cheaply. The manager cites the takeout price for Cadbury by Kraft, which he considered too low. As a result a lot of additional value has accrued to Kraft and Mondelez shareholders rather than to Cadbury’s (Kraft split itself into two companies – domestic operations as Kraft and international as Mondelez). FGT has taken a larger position in Mondelez after the Kraft/Heinz merger.
Lower commodity prices are expected to be positive for margins at several of the positions held within the portfolio. Although companies have not yet acknowledged the benefits, Unilever recently announced results and its profitability was viewed favourably by shareholders; the share price is now near an all-time high.
Asset allocation
Investment process: Far sighted investment horizon
FGT comprises a selection of companies selected on a bottom-up basis without regard to the weightings of FTSE All-Share benchmark. The portfolio is concentrated, with around 30 companies that are seen as being high quality with strong brands and/or market positions. Quality characteristics are defined as follows:
■
durability – companies that will prosper through business cycles over the long term;
■
high returns on equity – companies that can grow earnings year-on-year, rather than those with rapid short-term growth but uncertain long-term prospects; and
■
low capital intensity/high free cash flow generation – companies that can grow earnings without heavy investment.
Stocks are purchased when they are priced below the manager’s estimate of their intrinsic value and are held for the long term, regardless of short-term periods of volatility. The manager seeks to “buy great companies and hold them forever”. Stocks are generally sold when they no longer have quality characteristics or when the manager feels the price has moved materially above the intrinsic value. Holdings might be trimmed when share price appreciation leads to an overly large position size within the portfolio. The last complete sale of a position was in Marston in 2013; it was sold on valuation grounds. An illustration of the very low portfolio turnover is that when Remy Cointreau was purchased in 2015, it was the first new holding in more than four years. Average annual portfolio turnover is 5.1%. Three-quarters of names in the portfolio have been in place for more than 10 years.
Current portfolio positioning
FGT remains a very concentrated trust; at 29 February 2016 it held 27 positions. There are 24 mainstream equities plus very small positions in the Lindsell Train Investment Trust, the unlisted Frostrow Capital (FGT’s alternative investment fund manager) and Celtic 6% preference shares. The top 10 holdings accounted for 68.1% of the fund, up from 65.6% at the end of February 2015. Non-UK exposure is 18.8%, which is close to the 20% permitted level.
The manager favours companies that are well-established or family owned. 82% of the portfolio is invested in companies that are more than 100 years old and half of the mainstream equity companies are family or staff owned. Recent additions to positions have been to underperforming names, such as Burberry and Hargreaves Lansdown following short-term underperformance, and large holdings within the portfolio. The relatively new position in Remy Cointreau has also been increased; it is currently a 2.2% position.
Pearson is an example of a company that the manager has been prepared to invest in for its long-term potential, despite periods of disappointing share price performance. The shares have appreciated this year on the announcement of a major rationalisation of costs, which if successful will lead to significant earnings uplift in 2017/18. The shift to a more digital offering within the area of education is viewed as inevitable. Pearson is the largest educational company in the world with £4.5bn of revenues and already has a high percentage of digital and service revenues. A new chairman and finance director are in place and although there are cyclical pressures in the business, FGT’s manager is focused on the secular multi-decade shift to digital.
We met the manager on the day that London Stock Exchange announced an agreed merger with Deutsche Boerse. He believes that the combined company will be very powerful, highly profitable with strong market shares. The initial thought was that the position is likely to be retained post the merger and the manager has been adding to the position in recent weeks.
Exhibit 3: Sector allocations as at 29 February 2016 (%)
Portfolio end-February 2016 |
Portfolio end-February 2015 |
Change |
Index weight |
Active weight vs index |
|
Consumer goods |
44.9 |
40.8 |
4.1 |
17.5 |
27.4 |
Consumer services |
23.5 |
27.0 |
-3.5 |
13.1 |
10.4 |
Technology |
10.1 |
9.7 |
0.4 |
1.5 |
8.6 |
Financials |
21.5 |
22.5 |
-1.0 |
24.2 |
-2.7 |
Utilities |
0.0 |
0.0 |
0.0 |
3.9 |
-3.9 |
Basic materials |
0.0 |
0.0 |
0.0 |
4.7 |
-4.7 |
Telecommunications |
0.0 |
0.0 |
0.0 |
5.5 |
-5.5 |
Healthcare |
0.0 |
0.0 |
0.0 |
8.6 |
-8.6 |
Industrials |
0.0 |
0.0 |
0.0 |
10.4 |
-10.4 |
Oil & gas |
0.0 |
0.0 |
0.0 |
10.5 |
-10.5 |
100.0 |
100.0 |
100.0 |
Source: Finsbury Growth & Income Trust, Edison Investment Research. Note: Ranked by active weight.
As shown in Exhibit 3, industries where the manager believes that often there are great companies in which to invest are as follows: consumer goods – beverages, food producers and personal care; consumer services – leisure and media; technology – software; and financials – retail banks and speciality finance. Investments have been in just these four sectors for many years. The manager comments that it is difficult to find companies within the UK that fit his investment criteria. The last two new names added to the portfolio have been European; Remy Cointreau is French and Heineken is Dutch. Lindsell Train is investing time to research companies that are not already owned, including some in industries not currently invested in.
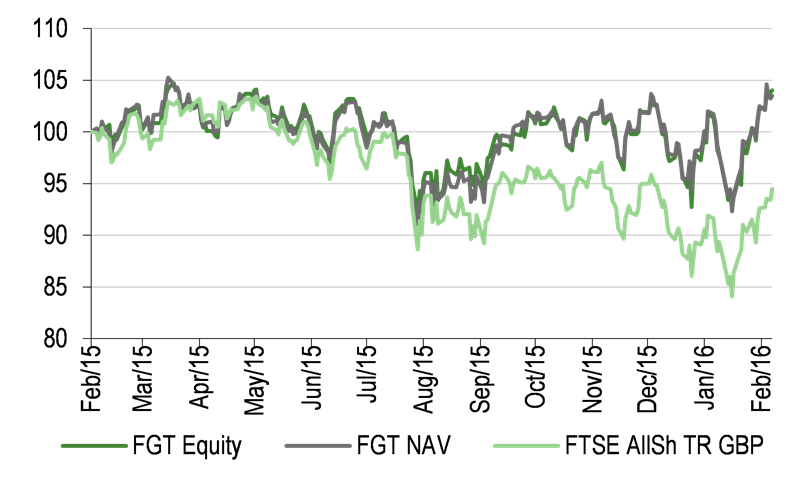
Performance: Long-term outperformance
FGT has a long history of positive performance, both on an absolute and a relative basis. As shown in Exhibit 5, it has outperformed its benchmark FTSE All-Share Index by a significant amount over one, three, five and 10 years. It has also outperformed in most of the shorter time periods. Although not widely used, the FTSE 350 Index is a measure of performance of large and mid-cap UK listed companies. FGT has shown similarly impressive performance over the long term against this benchmark. It has also outperformed the MSCI World Index over the long term, but to a lesser extent. Looking at the 10-year relative return in Exhibit 6, there have been periods of relative underperformance, but these have tended to be brief, especially in recent years.
During 2015, the largest contributors to NAV improvement were Hargreaves Lansdown +14.9p, Sage Group +9.6p and Heineken +9.5p, while the largest detractors were Pearson -11.0p and Burberry -8.6p.
|
Exhibit 4: Investment trust performance to 29 February 2016 |
||||||||
Price, NAV and benchmark total return performance, one-year rebased |
Price, NAV and benchmark total return performance (%)* |
|||||||
|
|
|||||||
|
Source: Thomson Datastream, Edison Investment Research. Note: *Three, five and 10-year performance figures annualised. |
||||||||
|
Exhibit 5: Share price and NAV total return performance relative to benchmarks (%) to 29 February 2016 |
||||||||
|
One month |
Three months |
Six months |
One year |
Three years |
Five years |
10 years |
|
Price relative to FTSE All-Share |
(0.4) |
3.9 |
7.6 |
10.2 |
27.4 |
61.6 |
69.7 |
|
NAV relative to FTSE All-Share |
(0.7) |
4.1 |
8.9 |
10.2 |
27.3 |
61.3 |
70.4 |
|
Price relative to FTSE 350 Index |
(0.4) |
3.9 |
7.5 |
10.4 |
27.8 |
62.4 |
69.4 |
|
NAV relative to FTSE 350 Index |
(0.7) |
4.1 |
8.8 |
10.5 |
27.7 |
62.1 |
70.1 |
|
Price relative to MSCI World Index |
(0.7) |
1.1 |
1.4 |
2.9 |
9.1 |
35.9 |
41.5 |
|
NAV relative to MSCI World Index |
(1.0) |
1.2 |
2.5 |
2.9 |
9.1 |
35.6 |
42.1 |
|
|
Source: Thomson Datastream, Edison Investment Research. Note: Data to end-February 2016. Geometric calculation. |
||||||||
|
Exhibit 6: FGT NAV total return vs FTSE All-Share total return, over 10 years, rebased to 100 |
||||||||
|
||||||||
|
Source: Thomson Datastream, Edison Investment Research |
||||||||
Discount: Narrow range despite market volatility
In the three-year period shown below, the share price premium/discount to cum income NAV has been in a narrow range. Over the last 12 months the range has been a 1.6% premium to a 1.2% discount; this compares to the average premium over one, three and five years of 0.5%. Despite stock market volatility in recent months, demand for the shares has remained robust. Renewed annually, the trust has authority to purchase up to 14.99% and allot up to 10% of issued share capital. Further authority can be sought if the 10% level is exceeded (which has occurred in recent years). The latest block listing for 10m shares was announced on 3 December 2015.
|
Exhibit 7: Share price discount/premium to cum-income NAV over three years (%) |
|
|
Source: Thomson Datastream, Edison Investment Research. Note: Negative values indicate a discount, positive values a premium. Debt at fair value. |
Capital structure and fees
FGT is a conventional investment trust with one class of share. As at 24 March 2016, there were 129.5m shares outstanding. A discount control policy is in place whereby shares are repurchased when the discount exceeds 5% and issued if there are unfulfilled buy orders in the market. As shown on page 2, proceeds from allotments have increased steadily over the last five years and year-to-date 2.7m shares were issued raising £15.2m. FGT has a revolving credit facility of £50m with Scotiabank Europe; as at 30 September 2015 a total of £29m was drawn down, which equated to net gearing of 3%. Gearing of up to 25% of net assets is permitted; however, the manager typically maintains it around 5% (4% at 29 February 2016).
Portfolio manager Lindsell Train receives an annual management fee of 0.45% of FGT’s market capitalisation, calculated monthly and payable in arrears. The alternative investment manager (AIFM) under the AIFM Directive is Frostrow Capital; it receives a fixed fee of £70,000 per annum plus 0.15% of the FGT’s market capitalisation also calculated and paid monthly. Ongoing charges of 0.8% in FY15 were in line with the prior year.
Dividend policy and record
FGT pays dividends twice a year in May and October. It has a progressive policy and has raised annual dividends in each of the last five years. The 12.1p dividend paid in 2015 was a 7.1% increase on the prior year; it was fully covered by income. Over the last five years compound annual growth in dividends has been 6.6%. Based on the current share price, FGT has a yield of 2.0%. This is the lowest in the AIC UK Equity Income sector, but is a reflection of a focus on dividend growth rather than a high starting yield.
Portfolio companies have seen their rates of dividend growth slow moderately over the last 12 months; however, the manager still views the average annual growth of 8% as attractive.
Peer group comparison
The AIC’s UK Equity Income sector contains 23 funds. Exhibit 8 shows the largest trusts with market caps c £300m and above. FGT’s NAV total return has significantly outperformed the peer group weighted average over one, three, five and 10 years; over 10 years it ranks first out of 22 funds. Its risk-adjusted returns as measured by the Sharpe ratio are above the average over both one and three years. FGT’s ongoing charge is modestly above the group average but there is no performance fee; gearing is lower. It has the lowest dividend yield in the sector; however this is a result of its total return rather than income-specific mandate.
Exhibit 8: Selected peer group as at 24 March 2016
% unless stated |
Market cap £m |
NAV TR 1 Year |
NAV TR 3 Year |
NAV TR 5 Year |
NAV TR 10 Year |
Sharpe 1y (NAV) |
Sharpe 3y (NAV) |
Discount (ex-par) |
Ongoing charge |
Perf. fee |
Net gearing |
Dividend yield (%) |
Finsbury Growth & Income |
766.8 |
2.2 |
41.1 |
107.0 |
174.7 |
(0.5) |
0.8 |
(0.3) |
0.8 |
No |
104.0 |
2.0 |
City of London |
1,176.9 |
(3.8) |
23.9 |
59.0 |
92.5 |
(0.8) |
0.4 |
(1.7) |
0.4 |
No |
111.0 |
4.2 |
Diverse Income Trust |
349.9 |
11.3 |
59.4 |
0.0 |
1.5 |
2.2 |
1.3 |
No |
100.0 |
2.9 |
||
Dunedin Income Growth |
322.0 |
(11.9) |
5.4 |
29.2 |
46.6 |
(1.2) |
(0.0) |
(9.8) |
0.6 |
No |
118.0 |
5.3 |
Edinburgh Investment |
1,284.6 |
2.0 |
43.2 |
90.8 |
117.2 |
(0.5) |
0.8 |
(4.1) |
0.6 |
No |
113.0 |
3.7 |
JPMorgan Claverhouse |
299.3 |
(6.5) |
21.5 |
39.4 |
65.3 |
(0.9) |
0.3 |
(9.4) |
0.7 |
Yes |
116.0 |
3.9 |
Lowland |
342.6 |
(8.2) |
17.6 |
65.3 |
101.3 |
(1.1) |
0.2 |
(2.1) |
0.6 |
Yes |
117.0 |
3.2 |
Merchants Trust |
434.9 |
(10.4) |
10.9 |
34.7 |
48.1 |
(1.0) |
0.1 |
(9.3) |
0.6 |
No |
123.0 |
6.0 |
Murray Income Trust |
433.7 |
(8.4) |
10.2 |
34.7 |
56.4 |
(1.0) |
0.1 |
(7.6) |
0.7 |
No |
108.0 |
5.0 |
Perpetual Income & Growth |
893.2 |
(1.7) |
39.2 |
86.1 |
135.3 |
(0.8) |
0.7 |
(4.4) |
0.7 |
Yes |
116.0 |
3.9 |
Temple Bar |
664.7 |
(7.7) |
13.4 |
46.7 |
102.1 |
(1.1) |
0.2 |
(9.6) |
0.5 |
No |
104.0 |
4.7 |
Weighted average (23 funds) |
(2.7) |
28.7 |
62.9 |
94.9 |
(0.7) |
0.5 |
(4.4) |
0.7 |
111.5 |
4.0 |
||
Rank (out of 23 funds) |
4 |
4 |
4 |
2 |
1 |
4 |
4 |
7 |
12 |
17 |
23 |
Source: Morningstar, Edison Investment Research. Note: TR = total return. Performance data to end-February 2016. Sharpe ratio is a measure of risk-adjusted return. The ratios shown are calculated by Morningstar for the past 12- and 36-month periods by dividing a fund’s annualised excess returns over the risk-free rate by its annualised standard deviation. Net gearing is total assets less cash and equivalents as a percentage of net assets.
The board
FGT has six directors; all are non-executive and independent of the manager. Anthony Townsend rejoined the board in 2005; he was appointed chairman in 2008 and is also chairman of the management engagement committee. David Hunt is the senior independent director; he was appointed in 2006 and is chairman of the audit committee. John Allard and Vanessa Renwick both joined the board in 2000. Neil Collins was appointed in 2008. The newest board member is Simon Hayes who was appointed in 2015.
|
Investment Companies