Ellomay Capital
Written by
Ellomay Capital |
Generating capital to allocate |
Initiation of coverage |
Utilities |
28 September 2016 |
Share price performance
Business description
Next events
Analysts
|
|||||||||||||||||||||||||||||||||||||||||||||||
Ellomay Capital invests in international power generation assets on the basis of value and cash yield. Its asset mix comprises solar plants in Italy and Spain as well as an investment in an Israeli gas-fired power plant. The company enjoys a high level of cash generation (FY16e FCF yield 8.4%), which management allocates between debt repayment, shareholder returns and investment in new projects. Our fair value per share is $11.50.
Year |
Revenue ($m) |
PBT* |
EPS* |
DPS |
P/E |
Yield |
12/14 |
15.78 |
2.46 |
0.21 |
0.00 |
42.9 |
N/A |
12/15 |
13.82 |
1.86 |
0.35 |
0.00 |
25.7 |
N/A |
12/16e |
14.19 |
3.29 |
0.23 |
0.23 |
39.2 |
2.6 |
12/17e |
14.32 |
4.72 |
0.32 |
0.23 |
28.2 |
2.6 |
Note: *PBT and EPS are normalised, excluding amortisation of acquired intangibles, exceptional items and share-based payments.
Generating assets, with high earnings visibility
Ellomay owns 30.5MWp of solar photovoltaic (PV) assets in Italy and Spain and a 9.4% equity stake in Dorad, an 850MW Israeli gas-fired power plant. Its international portfolio of generation assets offers investors exposure to a strong range of technologies and end markets. A key plank of the story is the strong recurring cash flow provided by high-visibility regulated earnings on its solar activities.
Future value decided by capital allocation
Surplus cash produced by Ellomay’s operating assets is either used to pay down debt, for shareholder returns or for new power investments. Management has extensive experience in energy and finance. Capital discipline is the key long-term driver of value for Ellomay shareholders, and management has shown itself to be highly accomplished at acquiring assets at attractive prices and delivering strong cash yields.
Power investments depend on availability and price
Management has strict investing criteria when assessing new opportunities. When it sees value, such as that witnessed in the Italian and Spanish solar PV markets between FY12 and FY14, it acquires in scale: over $50m in FY12-14. However, in recent years as asset prices have recovered, it has instead allocated capital to shareholder returns: $2.4m dividend and $3m buyback. Currently, Ellomay is planning the development of a pumped storage project at Manara Cliff.
Valuation: Sum-of-the-parts of $11.50
Given the differing markets in which Ellomay operates, we value its solar activities and its stake in Dorad separately in arriving at our fair value of $11.50/share (NIS43/share). We use a sum-of-the-parts comprising discounted cash flow (DCF), EV/EBITDA and EV/KWp in arriving at our fair value. We also compare Ellomay to its closest listed peers on several key valuation measures.
Investment summary
Company description: International power generation
Ellomay Capital is an international power and infrastructure investor with a dual listing on the Tel Aviv and New York stock exchanges. It owns 22.6MWp of photovoltaic (PV) solar generating capacity in Italy (in Puglia, Marche and Veneto) and 7.9MWp of solar PV assets in Spain. It has exposure to conventional thermal generation in the form of a 9.4% stake holding in Dorad Energy, an 850MW gas-fired power plant in Israel, which began operating in 2014. As an investor in power generation, Ellomay continually assesses potential investment opportunities such as Manara Cliff, a 340MW pumped-storage project in Israel that has just received a conditional licence.
Financials: Strong cash, balance sheet capacity, expansion planned
We forecast Ellomay will generate in excess of $6m (FY16e) in free cash flow (operating free cash flow less capex), which equates to a 8.4% yield. With a low level of indebtedness, at 21% net debt to EV, Ellomay has a strong financial platform from which to make growth investments in the coming years. Crucially, 84% of Ellomay’s revenues come in the form of regulated earnings from its Spanish and Italian solar assets, which qualify for subsidies. Ellomay’s strategy is to use the cash flow from these businesses, in tandem with its conservative balance sheet, to finance expansionary generation projects.
Valuation: Sum-of-the-parts
We use a sum-of-the-parts model for Ellomay comprised of different DCF models, EV/EBITDA multiples and per KWp multiples for the solar business and a DCF for the Dorad investment in arriving at our fair value (FV) of $11.50 per share (NIS43/share). We do not include value from new projects.
Sensitivities
Ellomay is subject to several risks beyond its control and some further stock-specific factors investors should be aware of:
■
Regulatory risk: Ellomay has already been subject to regulatory interference with permanent subsidy reductions imposed on its Spanish and Italian solar assets in 2013 and 2014. In Italy, the reductions lowered the subsidy by 8.0%. Dorad also experienced a 6.8% tariff reduction in 2015.
■
Currency risk: Ellomay earns the bulk of its revenues in euros, reports in US dollars and issues debt in Israeli shekels. Therefore the company is subject to short-term, currency-related fluctuations in earnings. Ellomay does use hedging instruments to mitigate currency risk. Technical factors: Given its low free float of 31% (the equivalent to $30m) and low daily traded volume, many investors are precluded from holding the stock.
■
Execution risk: Especially in the case of greenfield investments such as Manara Cliff, investors should be aware that there is potential for projects delays and cost overruns in common with all power generation projects. In the case of larger projects, these could have a meaningful impact on Ellomay’s valuation.
Company description: In the power business
Ellomay made its first acquisition in the Italian solar PV market in 2010 and subsequently expanded its solar operations by acquiring assets in Spain from 2012. It purchased an equity stake in Dorad, a gas-fired power plant in Israel in 2010, which started yielding cash flow in FY14. Over the course of this period, Ellomay has shown itself to be an astute purchaser of power generating assets across geographies, with a keen entrepreneurial sense of making value-enhancing investments.
The bedrock of the business is the $14.5m (FY17e) revenue generated from Ellomay’s 12 solar PV assets in Italy and four solar PV assets in Spain (see Exhibit 9). Despite suffering reductions in power price subsidies in both countries in FY13 and FY14, these operations remain profitable for Ellomay, require minimal maintenance and are therefore a cash cow for Ellomay. The company has licences for its plants in Italy until 2031 and in Spain until 2040-41 although it is likely solar energy will be at least as important a contributor to low carbon generation in both countries thereafter.
|
Exhibit 1: Ellomay adjusted EBITDA composition (less bargain purchase, other income and associates) |
|
|
Source: Ellomay Capital accounts, Edison Investment Research estimates |
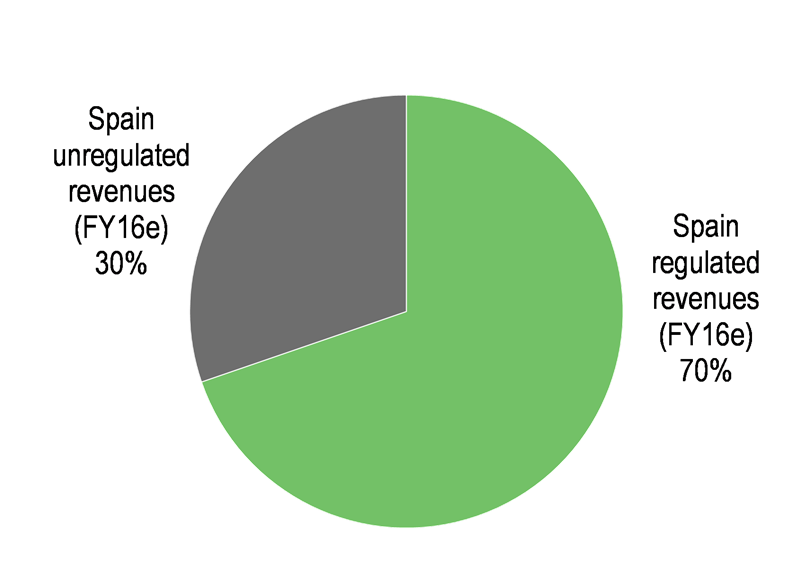
86% of Ellomay’s revenues in Italy and 77% of its revenues in Spain are regulated. In each country, the company has minimal exposure to spot prices. Our assumption is that solar subsidies in Italy and Spain remain constant. This means that, if we assume increases in operating costs in line with inflation, EBITDA from these operations will slightly decline.
|
Exhibit 2: Italian solar revenue split |
Exhibit 3: Spanish solar revenue split |
|
|
|
Source: Edison Investment Research estimates |
|
Exhibit 2: Italian solar revenue split |
|
|
Source: Edison Investment Research estimates |
|
Exhibit 3: Spanish solar revenue split |
|
|
Source: Edison Investment Research estimates |
The FY15 $2.45m contribution from the Dorad investment (accounted for as an associate) equates to 25% of group EBITDA. The 850MW combined cycle gas turbine (CCGT) is located in Ashkelon, became operational in FY14 and made a full contribution in FY15. The plant is licensed until 2034 and, as one of only a handful of power plants in Israel (producing between 6% and 8% of Israel’s power), is a strategic asset for the economy; it was declared a strategic infrastructure project by the government. Ellomay has a 9.4% equity stake in the plant. It sells power (based on regulated tariffs and regulated fuel costs) to a range of private and public sector clients.
Regulations: Steady subsidised cash flows (with some risk)
Italy and Spain – Solar PV
Various renewable subsidies have been in place across Europe for several years. Across the EU, the target for electricity generated from renewable sources has long been 20% by 2020 and more recently the 2030 target was set at 27%. National governments put in place various schemes to meet their renewables targets usually involving subsidies or other incentives to encourage investment. Each country is free to skew investment to technologies that suit their natural environment – solar power in the case of Italy and Spain or wind power in the case of the UK.
Energy regulators have to balance the requirement to meet their national CO2 targets with the political imperative of keeping energy cheap. With subsidised power prices often multiples of market prices, these two goals were always likely to be difficult. The fiscal squeeze associated with the eurozone crisis brought matters to a head and both the Italian and Spanish authorities announced reductions in the subsidies available for solar generators in 2013 and 2014. While Ellomay’s operations remain comfortably profitable, this episode highlights how political interference can alter the economics of renewable generation. While we assume subsidies remain flat in the coming years, we highlight further reductions as a potential risk.
This risk should be acknowledged by investors given the large percentage of regulated revenues Ellomay receives in Italy and Spain. While each country has contrasting subsidy mechanics (for instance Spain has a mixture of subsidy per installed unit of capacity and unit KWh produced, while Italy subsidises only power sold to the grid), there is one obvious commonality: namely that regulated feed-in-tariffs (FiTs) outweigh Ellomay’s revenues from the spot market several times over (see Exhibit 4).
|
Exhibit 4: Ellomay solar per KWh revenue split |
|
|
Source: Ellomay, Edison Investment Research estimates |
Israel
Israel’s power market is regulated by the Israeli Public Utilities Authority. The regulator imposed a 6.8% reduction in electricity tariff across the Israeli power market in September 2015. Although complex, the tariff regime in theory is a reflection of the fuel cost environment in Israel so tariff decreases do not necessarily eat into profitability. We therefore forecast a steady increase in the income from Dorad over our forecast horizon.
Operations
Italy and Spain
Italy accounts for the lion’s share of capacity, output and revenues
Ellomay’s Italian operations account for approximately 71% of Ellomay’s solar PV output and 77% of our forecast FY16e revenue for Ellomay’s solar units. The average achieved selling price in Italy, at €0.337/KWh, is substantially higher than the equivalent figure in Spain (€0.226/KWh).
|
Exhibit 5: Ellomay solar PV power output by geography |
Exhibit 6: Ellomay solar PV revenues by geography |
|
|
|
Source: Ellomay Capital, Edison Investment Research estimates |
|
Exhibit 5: Ellomay solar PV power output by geography |
|
|
Source: Ellomay Capital, Edison Investment Research estimates |
|
Exhibit 6: Ellomay solar PV revenues by geography |
|
|
Source: Ellomay Capital, Edison Investment Research estimates |
Ellomay acquired the majority of its Italian and Spanish solar PV assets often when the plant’s operators were either insolvent or loss-making, thus offering Ellomay the opportunity to purchase discounted assets. By bringing operations onto a larger-scale platform, Ellomay has been able to reduce costs at the plant level and improve profitability.
Exhibit 7: Ellomay acquisition history
Year |
Asset (s) |
Country |
Total consideration |
Capacity (KWp) |
Per KWp multiple |
Notes |
||
2014 |
Murcia |
Spain |
€9.8m |
5,614 |
€1,745 |
Three plants bought out of insolvency |
||
$13.3m |
$2,369 |
|||||||
2013 |
Veneto |
Italy |
€23.4m |
11,823 |
€1,979 |
Two plants bought out of insolvency |
||
$30.7m |
$2,597 |
|||||||
2012 |
Rinconada II |
Spain |
€5.8m |
2,275 |
€2,533 |
|||
$7.3m |
$3,208 |
FY12 net loss of $2.27m |
||||||
Source: Ellomay Capital, Edison Investment Research estimates
As illustrated in Exhibit 8, Ellomay’s revenues tripled in the space of four years as it acquired its solar and gas interests. However, revenues decreased in FY15 as solar subsidies were reduced and also due to currency effects. We do not include inorganic cash flows so our capacity and revenue estimates stay broadly flat in the coming years.
|
Exhibit 8: Ellomay solar PV installed capacity (MWp) and revenue ($m) evolution |
|
|
Source: Ellomay Capital, Edison Investment Research estimates |
Ellomay’s most important single plants by revenue are Pedale (13% of FY16e revenues), Soleco (16% of FY16e revenues) and Tecnoenergy (16% of FY16e revenues) in Italy, while Rodriguez II (8% of FY16e revenues) and Rinconada II (7% of FY16e revenues) are the most important single unit In Spain. So while the largest single risk to the business is regarding subsidy levels at government level, investors should also be aware that power output is concentrated and therefore subject to asset-specific risk.
Exhibit 9: Ellomay solar PV plant-by-plant
Plant |
Location |
Capacity |
Output |
FY16e revenues ($000) |
Italian operations |
||||
Troia 8 |
Puglia |
996 |
1,446 |
606 |
Troia 9 |
Puglia |
996 |
1,483 |
622 |
Del Bianco |
Marche |
734 |
956 |
405 |
Giaché |
Marche |
730 |
966 |
409 |
Costantini |
Marche |
734 |
1,015 |
430 |
Massaccesi |
Marche |
750 |
934 |
396 |
Galatina |
Puglia |
994 |
1,387 |
581 |
Pedale |
Puglia |
2,993 |
5,311 |
1,902 |
Acquafresca |
Puglia |
948 |
1,313 |
473 |
D'Angella |
Puglia |
931 |
1,316 |
474 |
Soleco |
Veneto |
5,924 |
7,797 |
2,361 |
Tecnoenergy |
Veneto |
5,900 |
7,664 |
2,321 |
Italy total |
22,628 |
31,588 |
10,980 |
|
Spanish operations |
||||
Rinconada II |
2,275 |
3,355 |
915 |
|
Rodriguez I |
1,675 |
2,837 |
674 |
|
Rodriguez II |
2,691 |
4,513 |
1,114 |
|
Fuente Librilla |
1,248 |
2,032 |
545 |
|
Spain total |
7,889 |
12,737 |
3,247 |
|
Solar PV total |
30,517 |
44,325 |
14,227 |
|
Source: Ellomay Capital, Edison Investment Research estimates
Israel: Dorad investment – low visibility into an important national asset
As an associate, and despite reporting in detail, there is minimal operating data for Dorad at plant level and specific details on cash paid to Ellomay are elusive. Given that it is a modern plant and an important contributor to the Israeli generation mix, we believe the plant will continue to make an economic return.
In FY15, its first full year of production, Dorad produced an operating profit of NIS356.8m and net income of NIS102,8m ($91.9m and $26.5m, respectively). The 9.4% equity stake proportionally consolidated by Ellomay contributed $2.45m to group FY15 results. Dorad’s balance sheet shows an equity to EV of 15.4% at FY15.
Management and ownership
Two shareholders, Shlomo Nehama and the Kanir Partnership, between them own 69% of Ellomay. Shlomo Nehama is chairman of Ellomay and the Kanir Partnership is managed by Mr Ran Fridrich, Ellomay CEO and director, and Mr Hemi Raphael, a director of Ellomay.
Several senior Ellomay executives benefit from experience in banking and asset management. The 2015 annual report states that Ellomay only directly employed 10 employees. All but one of these individuals were based in Israel. The nature of the directors’ experience plus the fact that all employees are in management, administration and finance shows that Ellomay is an investment firm first and foremost and an asset operator second.
The fact that the chairman, chief executive and another director, Hemi Raphael, between them beneficially own a significant percentage of Ellomay gives us confidence shareholder value will continue to be the key driver behind capital allocation, although this must be tempered by the fact that equity holders outside this group are minority holders and therefore have minimal influence in group strategy and major financing decisions.
|
Exhibit 10: Ellomay ownership structure |
|
|
Source: Ellomay Capital, Bloomberg data. Note: Kanir Partnership includes holding from Ran Fridrich (CEO). |
Ellomay’s management team is comprised of several individuals with experience in financial services, law and the corporate world. The most common background for Ellomay executives is investment and financial services. Far more than specialist operators of generation assets, Ellomay’s leadership has more experience in evaluating new opportunities.
■
Shlomo Nehama, chairman of the board: As chairman of Bank Hapoalim, a leading Israeli bank, between 1998 and 2007, Mr Nehama oversaw the expansion of the bank into new markets around the world while growing the bank’s balance sheet by over 50% and growing its returns. A graduate of Technion Institute of Technology in Haifa, Mr Nehama has also received an honorary doctorate for his contribution to the Israeli economy.
■
Ran Fridrich, director and CEO: Mr Fridrich has deep expertise in financial and corporate roles as well as a track record as an entrepreneur. He co-founded the Oristan Group in 2004, manages the Crystal Funds program of CDO equity funds and has launched an investment advisory business. In the corporate world, Mr Fridrich has been general manager of two packaging companies. He is a graduate of the Senior Executive Program at Tel Aviv University.
■
Hemi Raphael, director: Initially a lawyer with Goldberg Raphael & Co, Mr Raphael later moved into real estate and finance. He is Ellomay’s representative on the board of Dorad and has sat on the board of Cargal, a packaging enterprise. Mr Raphael has an LLB from the School of Law at the Hebrew University of Jerusalem and is a member of the Israeli and California Bar Associations.
■
Kalia Weintraub, chief financial officer: Ms Weintraub joined Ellomay in 2007 as corporate controller, and is responsible for all treasury and finance functions at the group. Before this Ms Weintraub worked in in the high-tech practice of Israeli accounting firm Kost Forer Gabbay and Kasierer. She trained at Brightman Almagor Zohar, having earnt a BA in economics and accounting and an MBA from Tel Aviv University. She is a licensed Certified Public Accountant (CPA) in Israel.
■
Ori Rosenzweig, chief investments officer: Mr Rosenzweig joined Ellomay in 2014. Previously he was head of cash management at Bank Leumi Le-Israel B.M. and had roles at AFI Investments and GSE Financial Consulting. He has an MBA from Tel Aviv University and a BA in business and international relations from the Hebrew University.
Strategy: Power investing
Ellomay continually assesses power investments in which to invest. Up to now, its track record has been successful in producing strong cash yields to reinvest and distribute to shareholders. Beneath we outline a couple of potential investments Ellomay has discussed. For now, there is not enough information to accurately model and value these potential investments and we would not include the additional value at this stage anyway. We are confident that as the investments gain certainty, Ellomay will communicate more detailed financial projections to the market.
Manara Cliff: Pumped storage
Ellomay has a 75% interest in the Manara project – the other 25% being owned by Sheva Miskarot – a planned pumped storage hydroelectric generation project in Israel. The company estimates that the 340MW project would take 72 months to construct. Recently, the project was re-awarded a conditional licence, which increases the likelihood of the project winning planning approval.
The Netherlands: Waste-to-energy
On 9 August, Ellomay announced it had entered into an agreement with Ludan Energy in connection with waste-to-energy (WTE) projects in the Netherlands. Ludan (parent company: the Ludan Group, an engineer and project manager listed on the Tel Aviv Stock Exchange: LUDN IT) has been involved with 14 WTE projects in Spain and according to the agreement with Ellomay both companies will co-invest in future WTE plants in the Netherlands provided they are awarded a Sustainable Energy Production Incentive from the Dutch government. Ellomay will take a 51% stake in each project. The expected overall cost of the projects is €200m.
Financials: Profitable, but must invest for growth
In the absence of regulatory interference, Ellomay’s solar PV revenues are the main driver behind the group’s high level of recurring cash flow. We forecast an EBITDA margin of 54.7% for FY16, although we note that group EBITDA will be broadly flat across our forecast horizon due to the lack of subsidised revenue indexation. The decline in profitability in solar given rising costs, solar panel degradation and fixed revenues from incentives means Ellomay will have to rely on increasing profitability at Dorad to drive EBITDA growth.
Given its high profitability and cash conversion and low level of indebtedness, there is no immediate pressure on Ellomay to grow EBITDA, but it is reliant on new projects it is assessing, such as Manara Cliff or Dutch WTE investments, to deliver the next wave of growth. Exhibit 11 contains our headline earnings, cash flow and debt forecasts for Ellomay.
Exhibit 11: Ellomay headline financial forecasts
2015 |
2016e |
2017e |
2018e |
2019e |
2020e |
Commentary |
||||||
Underlying EBITDA ($000 |
7,218 |
7,754 |
8,393 |
8,245 |
8,093 |
7,938 |
Rises initially as Manara costs are capitalised but declines thereafter as costs increase. |
|||||
Underlying EPS ($) |
0.35 |
0.22 |
0.32 |
0.38 |
0.42 |
0.47 |
Improves due to falling depreciation as capex and therefore assets decline, also interest charge drops with net debt. |
|||||
Capex ($000) |
0 |
(250) |
(250) |
(250) |
(250) |
(250) |
Management guides to a very low level of maintenance capex on existing assets. No new investments assumed. |
|||||
Net debt/(cash) ($000s) |
33,636 |
31,454 |
27,203 |
21,885 |
16,334 |
10,428 |
High cash flow assumptions and minimal capex spend; we forecast a sharp decline in net debt. |
|||||
Source: Ellomay Capital, Edison Investment Research
Earnings: Profitable but stagnant EBITDA, earnings attractive
Our forecast underlying FY17e EBITDA for Ellomay is $8.4m. As we do not explicitly forecast expansionary capex, the bulk of cash generated flows through to the balance sheet. Ellomay’s cost base is almost entirely head office costs – administration, finance, general management – with additional expenses for new projects. We forecast these will grow by low single-digit percentage points each year.
Cash flow: A mixture of yield and growth
Ellomay currently is a cash flow yield story, with high growth potential through the combination of an under-geared balance sheet and a management track record of investing at the right point in the cycle. Our cash flow forecasts only take into consideration existing activities and we acknowledge that future cash flow may be different to our forecasts as Ellomay finds the right investment opportunities.
Based on our forecasts Ellomay will produce enough cash flow to pay down gross debt by $25m by 2020, while still growing its cash position by $10m over the same period. This is a function of the $35m of operating cash generated (FY16-20) by Ellomay according to our estimates, which include cash generated by Dorad.
Ellomay announced it first dividend payment of $0.225/share in March FY16, implying a total payout of $2.4m. This followed on from the May FY15 announcement of a $3m share buyback programme. Despite the fact that Ellomay is still an early-stage enterprise with several growth projects to consider, we believe the dividend policy is sensible given the company is sitting on nearly $20m of cash and $6.5m of marketable securities, plus it will be a year or two before its next significant capital investment. The 2.6% yield offered by Ellomay is attractive in a market context, especially within the small- and mid-cap space.
Balance sheet: Low debt to EV, higher debt to EBITDA
At 25% net debt/EV, Ellomay is well positioned to take on further investment obligations in the coming years. The fact that it is distributing earnings and sitting on nearly $20m in cash shows the balance sheet has capacity to underwrite new projects. Net debt to reported EBITDA looks safe. Over the last three years, the range has been 1.5-3.5x, which is conservative for a business that derives the bulk of its revenues from regulated activities. However, we should highlight that when we strip out exceptionals and earnings from associates to be conservative, the numbers look a little more stretched, at 3.5-4.7x EBITDA also over the last three years. This is towards the top end of the range, even for regulated businesses, and could restrict Ellomay’s ability to invest in assets not producing immediate cash flow.
|
Exhibit 12: Ellomay liquidity requirements at FY15 |
|
|
Source: Ellomay, Edison Investment Research estimates |
In FY14, Ellomay issued two debentures of NIS120m ($34.4m) and NIS80.3m ($23.3m) to fund expansion. The Series A debentures are traded on the Tel Aviv Stock Exchange (TASE) and, on 1 February 2016 Standard and Poor’s Maalot confirmed the ilA- rating (the equivalent to B+ on S&P’s international ratings) on the instruments. The debentures carry a fixed interest rate of 4.6%, with the majority of the principal falling due after three years. Covenants on the debentures state that net financial debt to equity shall not exceed 65% and equity to balance sheet shall not decrease below 20%. The debentures are non-convertible and place restrictions on shareholder distributions.
Valuation
Our fair value for Ellomay is $11.50 per share (NIS43). We divide the business into two parts – Solar Operations and the Dorad Investment – which we value separately. We value the solar assets through a blend of EV/EBITDA multiple, DCF and a dollar per KW of installed capacity multiple. The average of each of these produces an EV of $93.0m. We value Dorad by DCF, which produces an EV of $63.3m for Ellomay’s 9.35% equity stake in the plant. After taking net debt into account, our valuation implies a fair value per share of $11.50.
Exhibit 13: Ellomay sum-of-the-parts valuation
Segment |
|
EV ($000s) |
Solar Operations |
Blended: 10x FY17e EBITDA, DCF (WACC 4.7%), $3,500/KWh installed capacity |
93,034 |
Dorad Investment |
DCF (WACC 7.6%, terminal growth 1%) |
63,264 |
Group enterprise value |
|
156,298 |
Less: FY15 net debt |
|
33,636 |
Less: pensions and other |
|
0 |
SOP valuation |
|
122,662 |
Current number of shares (m) |
|
10.7 |
Current price ($/share) |
|
9.25 |
Fair value per share ($/share) |
|
11.45 |
Upside/(downside) to FV (%) |
|
23.8% |
Dividend yield (%) |
|
2.4% |
Total return (%) |
|
26.2% |
Source: Edison Investment Research estimates
Peer comparison: Regulated assets trading at a premium
Regulated assets across the world trade at a premium. Dependable cash flows in comparatively stable political environments, coupled with the general downwards trajectory in the typical cost of capital used to value these cash flows make these stocks attractive.
Ellomay’s closest peers in the table beneath are Solarparken and Etrion, both European-listed solar owners and operators. At first glance, Ellomay seems to be trading at a premium to both names. However, the multiples in Exhibit 14 are calculated based on headline EBITDA and valuation. For Ellomay, one should subtract the Dorad investment from the EV and strip out the associates from the headline EBITDA. Based on our calculations (subtracting Dorad at our FV of $63m and stripping out FY17e associates of $2.85m), Ellomay’s adjusted one-year forward EV/EBITDA is 8.1x, at a discount to its closest peers. The average forward EBITDA multiple across Ellomay’s closest listed European regulated and renewable peers is 9.5x, comparable to the 10x forward EV/EBITDA multiple we use for Ellomay’s solar business in our sum-of-the-parts valuation.
Exhibit 14: Ellomay peer comparison
Share price |
Market cap |
Current EV/ |
Next EV/ |
FCF yield |
Dividend yield |
||
7C Solarparken AG |
€2.4 |
103 |
10.3 |
9.4 |
14.42 |
1.64 |
|
Etrion Corp |
SEK2.3 |
772 |
15.2 |
11.5 |
-10.44 |
0.00 |
|
EDP Renovaveis SA |
€7.1 |
6,228 |
8.2 |
7.6 |
-5.79 |
0.76 |
|
National Grid PLC |
1080.5p |
40,678 |
11.3 |
11.1 |
3.75 |
4.11 |
|
Terna Rete Elettrica Nazionale SpA |
€4.6 |
9,190 |
11.8 |
11.2 |
-6.44 |
4.59 |
|
Snam SpA |
€4.9 |
17,223 |
11.7 |
11.4 |
7.71 |
5.08 |
|
Enel SpA |
€4.0 |
40,240 |
5.5 |
5.4 |
7.03 |
4.55 |
|
Iberdrola SA |
€6.0 |
38,071 |
8.5 |
8.3 |
2.97 |
4.93 |
|
Average |
10.3 |
9.5 |
1.65 |
3.21 |
|||
Ellomay Capital |
US$9.09 |
98 |
12.8 |
11.7 |
8.40 |
2.50 |
|
Source: Edison Investment Research, Bloomberg. Note: Prices as at 27 September 2016.
Sensitivities
The most important risk to Ellomay’s earnings, based on its current operating assets, is a potential reduction in the subsidies received by its solar PV assets in Italy and Spain. Given that the overwhelming amount of revenue in this business comes from Italy, it is to this government that Ellomay’s earnings are most linked. Exhibit 15 shows that a 10% decrease in Italian subsidies would reduce Ellomay’s FY17 EBITDA by 11%, whereas a reduction in Spanish subsidies of the same amount would only reduce FY17 EBITDA by 3%. In common with regulated assets globally, our solar PV WACC assumption, at 4.7%, is low, so we include a sensitivity to a 0.5% move in WACC.
Exhibit 15: Solar PV business: EBITDA and valuation sensitivities ($)
Underlying EBITDA ($000) |
|||
Group FY17 base |
Group FY17 flexed |
% difference |
|
Spanish FiT down 5% |
8,537 |
8,442 |
-1% |
Spanish FiT down 10% |
8,537 |
8,303 |
-3% |
Italian FiT down 5% |
8,537 |
8,102 |
-5% |
Italian FiT down 10% |
8,537 |
7,625 |
-11% |
Solar PV NPV ($) |
|||
WACC (%) |
NPV ($m) |
% difference |
$/share |
Base: 4.7% |
87.1 |
||
Low: 4.2% |
98.2 |
13% |
1.04 |
High: 5.2% |
79.3 |
-9% |
-0.73 |
Source: Edison Investment Research estimates
Exhibit 16: Financial summary
US$000s |
2013 |
2014 |
2015 |
2016e |
2017e |
2018e |
2019e |
2020e |
||
31-December |
IFRS |
IFRS |
IFRS |
IFRS |
IFRS |
IFRS |
IFRS |
IFRS |
||
PROFIT & LOSS |
||||||||||
Revenue |
|
|
12,982 |
15,782 |
13,817 |
14,185 |
14,318 |
14,318 |
14,318 |
14,318 |
EBITDA (company definition) |
|
|
16,807 |
15,694 |
9,685 |
10,242 |
11,248 |
11,433 |
11,581 |
11,696 |
EBITDA (Edison definition, excluding associates) |
7,152 |
8,442 |
7,218 |
7,754 |
8,393 |
8,245 |
8,093 |
7,938 |
||
Operating Profit (before amort. and except.) |
3,131 |
2,990 |
2,306 |
3,367 |
4,236 |
4,305 |
4,358 |
4,396 |
||
Intangible Amortisation |
0 |
0 |
0 |
0 |
0 |
0 |
0 |
0 |
||
Exceptionals |
10,195 |
5,433 |
21 |
0 |
0 |
0 |
0 |
0 |
||
Other |
1,543 |
(1,048) |
3,485 |
0 |
0 |
0 |
0 |
0 |
||
Operating Profit |
14,869 |
7,375 |
5,812 |
3,367 |
4,236 |
4,305 |
4,358 |
4,396 |
||
Net Interest |
(3,997) |
(2,347) |
(2,893) |
(2,568) |
(2,375) |
(1,895) |
(1,664) |
(1,234) |
||
Share of assocs/jvs gains/(losses) |
(540) |
1,819 |
2,446 |
2,488 |
2,855 |
3,188 |
3,487 |
3,758 |
||
Forex gains/(losses |
0 |
0 |
0 |
0 |
0 |
0 |
0 |
0 |
||
Other |
0 |
0 |
0 |
0 |
0 |
0 |
0 |
0 |
||
Profit Before Tax (norm) |
|
|
(1,406) |
2,462 |
1,859 |
3,286 |
4,716 |
5,597 |
6,181 |
6,920 |
Profit Before Tax (FRS 3) |
|
|
10,332 |
6,847 |
5,365 |
3,286 |
4,716 |
5,597 |
6,181 |
6,920 |
Tax |
(245) |
(201) |
1,933 |
(871) |
(1,250) |
(1,483) |
(1,638) |
(1,834) |
||
Profit After Tax (norm) |
(1,651) |
2,261 |
3,792 |
2,416 |
3,466 |
4,114 |
4,543 |
5,086 |
||
Profit After Tax (FRS 3) |
10,068 |
6,658 |
7,553 |
2,416 |
3,466 |
4,114 |
4,543 |
5,086 |
||
Average Number of Shares Outstanding (m) |
10.7 |
10.7 |
10.7 |
10.7 |
10.7 |
10.7 |
10.7 |
10.7 |
||
EPS - normalised ($) |
|
|
(0.15) |
0.21 |
0.35 |
0.23 |
0.32 |
0.38 |
0.42 |
0.47 |
EPS - normalised and fully diluted ($) |
|
(0.15) |
0.21 |
0.35 |
0.22 |
0.32 |
0.38 |
0.42 |
0.47 |
|
EPS - (IFRS) ($) |
|
|
0.94 |
0.62 |
0.70 |
0.23 |
0.32 |
0.38 |
0.42 |
0.47 |
Dividend per share ($) |
0.00 |
0.00 |
0.00 |
0.23 |
0.23 |
0.23 |
0.23 |
0.23 |
||
EBITDA Margin (%) |
55.1 |
53.5 |
52.2 |
54.7 |
58.6 |
57.6 |
56.5 |
55.4 |
||
Operating Margin (before GW and except.) (%) |
24.1 |
18.9 |
16.7 |
23.7 |
29.6 |
30.1 |
30.4 |
30.7 |
||
BALANCE SHEET |
||||||||||
Fixed Assets |
|
|
124,395 |
129,273 |
126,814 |
125,165 |
124,112 |
123,609 |
123,611 |
124,077 |
Intangible Assets |
0 |
0 |
0 |
0 |
0 |
0 |
0 |
0 |
||
Tangible Assets |
93,671 |
93,513 |
78,975 |
74,838 |
70,930 |
67,239 |
63,754 |
60,462 |
||
Investments |
24,601 |
27,237 |
33,970 |
36,458 |
39,313 |
42,501 |
45,988 |
49,746 |
||
Other |
6,123 |
8,523 |
13,869 |
13,869 |
13,869 |
13,869 |
13,869 |
13,869 |
||
Current Assets |
|
|
22,535 |
29,814 |
33,513 |
30,910 |
30,240 |
30,559 |
31,109 |
32,016 |
Stocks |
0 |
0 |
0 |
0 |
0 |
0 |
0 |
0 |
||
Debtors |
4,491 |
6,143 |
8,218 |
8,433 |
8,512 |
8,512 |
8,512 |
8,512 |
||
Cash |
7,238 |
15,758 |
18,717 |
15,899 |
15,150 |
15,468 |
16,019 |
16,925 |
||
Other |
10,806 |
7,913 |
6,578 |
6,578 |
6,578 |
6,578 |
6,578 |
6,578 |
||
Current Liabilities |
|
|
(26,919) |
(10,924) |
(10,103) |
(9,858) |
(9,775) |
(9,701) |
(9,633) |
(9,573) |
Creditors |
(7,465) |
(5,363) |
(4,092) |
(3,847) |
(3,764) |
(3,690) |
(3,622) |
(3,562) |
||
Short term borrowings |
(19,454) |
(5,561) |
(6,011) |
(6,011) |
(6,011) |
(6,011) |
(6,011) |
(6,011) |
||
Other |
0 |
0 |
0 |
0 |
0 |
0 |
0 |
0 |
||
Long Term Liabilities |
|
|
(20,250) |
(54,037) |
(56,159) |
(51,159) |
(46,159) |
(41,159) |
(36,159) |
(31,159) |
Long term borrowings |
(11,050) |
(44,081) |
(48,117) |
(43,117) |
(38,117) |
(33,117) |
(28,117) |
(23,117) |
||
Other long term liabilities |
(9,200) |
(9,956) |
(8,042) |
(8,042) |
(8,042) |
(8,042) |
(8,042) |
(8,042) |
||
Net Assets |
|
|
99,761 |
94,126 |
94,065 |
95,058 |
98,418 |
103,309 |
108,928 |
115,361 |
CASH FLOW |
||||||||||
Operating Cash Flow |
|
|
8,390 |
7,317 |
9,989 |
7,294 |
8,232 |
8,170 |
8,026 |
7,877 |
Net Interest |
(1,788) |
(3,721) |
(2,904) |
(2,568) |
(2,375) |
(1,895) |
(1,664) |
(1,234) |
||
Tax |
(213) |
(260) |
(2,174) |
(871) |
(1,250) |
(1,483) |
(1,638) |
(1,834) |
||
Capex |
(9,152) |
(709) |
0 |
(250) |
(250) |
(250) |
(250) |
(250) |
||
Acquisitions/disposals |
(30,742) |
(13,126) |
0 |
0 |
0 |
0 |
0 |
0 |
||
Financing |
0 |
0 |
0 |
0 |
0 |
0 |
0 |
0 |
||
Dividends |
0 |
0 |
0 |
(2,411) |
(2,411) |
(2,411) |
(2,411) |
(2,411) |
||
Other |
(2,885) |
(2,230) |
(4,485) |
2,488 |
2,855 |
3,188 |
3,487 |
3,758 |
||
Net Cash Flow |
(36,390) |
(12,729) |
426 |
3,682 |
4,801 |
5,319 |
5,550 |
5,907 |
||
Opening net debt/(cash) |
|
|
(12,960) |
23,892 |
32,932 |
33,636 |
31,454 |
27,203 |
21,885 |
16,334 |
HP finance leases initiated |
0 |
0 |
0 |
0 |
0 |
0 |
0 |
0 |
||
Other |
462 |
-3689 |
-461 |
1500 |
550 |
0 |
0 |
0 |
||
Closing net debt/(cash) |
|
|
23,892 |
32,932 |
33,636 |
31,454 |
27,203 |
21,885 |
16,334 |
10,428 |
Source: Ellomay Capital accounts, Edison Investment Research estimates
|
|||||||||||||||||||||||||||||||||||||||||||||
|
|