Last close As at 05/08/2026
GBP3.70
▲ 0.50 (0.14%)
Market capitalisation
GBP2,198m
Research: Investment Companies
Murray International Trust (MYI) is managed by Bruce Stout at Aberdeen Standard Investments. He stresses the importance of sticking to his disciplined investment process, regardless of stock market gyrations, to achieve the trust’s objectives of long-term growth (and protection) of capital while delivering an above-average level of income. Stout is very positive on the prospects for emerging markets, suggesting that now the US has backed away from raising interest rates there is potential for policy easing in these regions, which would be very supportive for economic growth. MYI has a progressive dividend policy; over the last five years, the annual distribution has compounded at an average rate of 3.7% pa and the trust currently offers a 4.4% yield.
Murray International Trust |
Disciplined investment process |
Investment trusts |
26 March 2019 |
Share price/discount performance
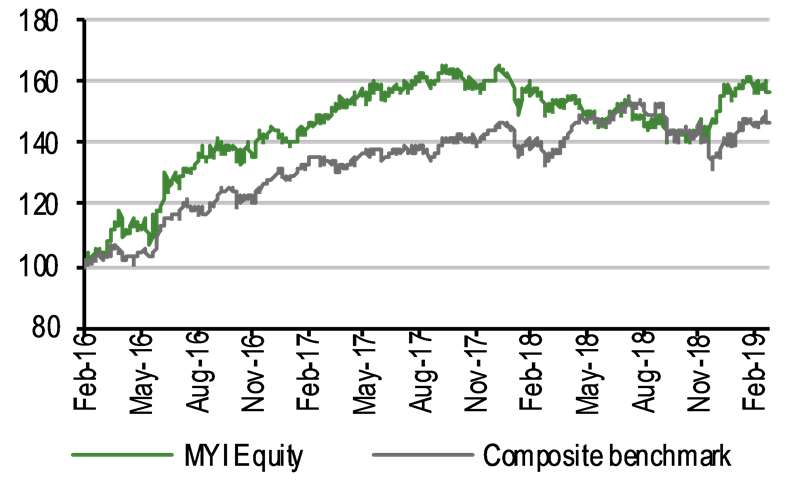
Three-year performance vs index
Gearing
Analysts
|
|||||||||||||||||||||||||||||||||||||||||||||||||||||||||||||||||||||||||||||||||||||||||||||
Murray International Trust (MYI) is managed by Bruce Stout at Aberdeen Standard Investments. He stresses the importance of sticking to his disciplined investment process, regardless of stock market gyrations, to achieve the trust’s objectives of long-term growth (and protection) of capital while delivering an above-average level of income. Stout is very positive on the prospects for emerging markets, suggesting that now the US has backed away from raising interest rates there is potential for policy easing in these regions, which would be very supportive for economic growth. MYI has a progressive dividend policy; over the last five years, the annual distribution has compounded at an average rate of 3.7% pa and the trust currently offers a 4.4% yield.
12 months ending |
Share price |
NAV |
Composite |
FTSE World UK |
FTSE World ex-UK |
28/02/15 |
9.5 |
11.4 |
13.1 |
5.7 |
18.2 |
29/02/16 |
(14.0) |
(6.3) |
(3.8) |
(8.4) |
(0.9) |
28/02/17 |
44.9 |
40.1 |
32.8 |
24.0 |
38.4 |
28/02/18 |
8.9 |
4.0 |
5.9 |
3.2 |
7.6 |
28/02/19 |
(0.5) |
(1.7) |
3.2 |
2.1 |
3.6 |
Source: Refinitiv. Note: All % on a total return basis in pounds sterling. Note: *Composite benchmark is 40% FTSE World UK and 60% FTSE World ex-UK.
The market opportunity
Although developed market economies are slowing, there is potential for an acceleration in emerging market growth due to underlying demand and policy flexibility. Equities across the board are now trading on more reasonable earnings multiples following the sell-off in global markets in 2018, which may provide an opportunity for valuation-aware investors with a longer-term horizon, who can look beyond macro uncertainties such as trade tensions and Brexit.
Why consider investing in Murray International Trust?
■
Benchmark-agnostic approach; ability to select the best growth and value opportunities across the globe, across the market-cap spectrum.
■
Unwavering adherence to the investment strategy, including during periods of heightened stock market volatility, with low portfolio turnover.
■
Long-term, double-digit growth in both NAV and share price total returns.
■
Ability to invest in fixed income securities to help support the trust’s above-average dividend yield.
High investor demand: Shares trading at a premium
MYI’s 3.0% premium to cum-income NAV compares with the average premiums of 0.9%, 0.6% 1.6% and 3.3% over the last one, three, five and 10 years respectively. The trust’s board employs a progressive dividend policy; the proposed 51.5p per share FY18 total distribution is a 3.0% increase year-on-year, and based on its current share price, MYI is offering a dividend yield of 4.4%. Gearing of up to 30% of NAV is permitted, in normal market conditions; at end-February 2019, net gearing was 11.9%.
Exhibit 1: Trust at a glance
Investment objective and fund background |
Recent developments |
||||||||||||||||||||||||||||||||||||||||||||||||||||||||||||||||||||||
Murray International Trust aims to achieve a total return greater than its composite benchmark (40% FTSE World UK and 60% FTSE World ex-UK) by investing predominantly in equities worldwide. It also aims to maintain an above-average dividend yield. |
■ 8 March 2019: 12-month report ending 31 December 2018. NAV TR -7.5% versus benchmark TR -5.2%. Share price TR -6.8%. Proposed final dividend of 17.0p per share (flat year-on-year). ■ 20 December 2018: announcement of a reduction in the management fee (see page 8). ■ 28 November 2018: announcement of third interim dividend of 11.5p per share (+4.5% year-on-year). ■ 16 August 2018: six-month report ending 30 June 2018. NAV TR -8.0% versus benchmark TR +2.2%. Share price TR -7.5%. |
||||||||||||||||||||||||||||||||||||||||||||||||||||||||||||||||||||||
Forthcoming |
Capital structure |
Fund details |
|||||||||||||||||||||||||||||||||||||||||||||||||||||||||||||||||||||
AGM |
April 2019 |
Ongoing charges |
0.69% (FY18) |
Group |
Aberdeen Standard Investments |
||||||||||||||||||||||||||||||||||||||||||||||||||||||||||||||||||
Interim results |
August 2019 |
Net gearing |
12.7% |
Manager |
Bruce Stout |
||||||||||||||||||||||||||||||||||||||||||||||||||||||||||||||||||
Year end |
31 December |
Annual mgmt fee |
Tiered (see page 8) |
Address |
7th Floor, 40 Princes Street, |
||||||||||||||||||||||||||||||||||||||||||||||||||||||||||||||||||
Dividend paid |
Aug, Nov, Feb, May |
Performance fee |
None |
||||||||||||||||||||||||||||||||||||||||||||||||||||||||||||||||||||
Launch date |
December 1907 |
Trust life |
Indefinite |
Phone |
0808 500 0040 |
||||||||||||||||||||||||||||||||||||||||||||||||||||||||||||||||||
Continuation vote |
None |
Loan facilities |
£185m |
Website |
|||||||||||||||||||||||||||||||||||||||||||||||||||||||||||||||||||
Dividend policy and history (financial years) |
Share buyback policy and history (financial years) |
||||||||||||||||||||||||||||||||||||||||||||||||||||||||||||||||||||||
Dividends are paid quarterly in August, November February and May. |
Subject to annual renewal, MYI has authority to repurchase up to 14.99% and allot shares up to 10% of issued share capital. |
||||||||||||||||||||||||||||||||||||||||||||||||||||||||||||||||||||||
|
|
||||||||||||||||||||||||||||||||||||||||||||||||||||||||||||||||||||||
Shareholder base (as at 28 February 2019) |
Portfolio exposure by geography (as at 28 February 2019) |
||||||||||||||||||||||||||||||||||||||||||||||||||||||||||||||||||||||
|
|
||||||||||||||||||||||||||||||||||||||||||||||||||||||||||||||||||||||
Top 10 holdings (as at 28 February 2019) |
|||||||||||||||||||||||||||||||||||||||||||||||||||||||||||||||||||||||
|
|||||||||||||||||||||||||||||||||||||||||||||||||||||||||||||||||||||||
Source: Murray International Trust, Edison Investment Research, Bloomberg, Morningstar. Note: *N/A where not in end-February 2018 top 10.
Market outlook: Need for vigilance
As shown in Exhibit 2 (LHS), in recent years UK equities have failed to keep pace with the world market (in sterling terms); this is partially due to domestic currency weakness following the UK’s European referendum in 2016. However, there are other reasons why investors may favour overseas equities, including higher growth opportunities and, compared to history, better prospects for dividend growth.
The broad-based equity sell-off in Q418, in response to tightening US monetary policy and an escalation in the US-China trade dispute, has led to more attractive company valuations. Although the US still looks relatively expensive (Exhibit 2, RHS), the Datastream World index is trading on a forward P/E multiple that is a 7% premium to its 10-year average; this is meaningfully lower than the c 20% premium before the Q418 stock market volatility. However, investors need to be vigilant: in an environment of macro uncertainties, slowing corporate earnings growth and the potential for further volatility in world markets, an increased focus on a company’s quality, earnings stability and valuation may be rewarded.
|
Exhibit 2: Market performance and valuations (last 10 years) |
|||||||||||||||||||||||||||||||||||||||||||
Performance of UK and world indices (£-adjusted) |
Datastream indices forward P/E valuations (x) |
||||||||||||||||||||||||||||||||||||||||||
|
|
||||||||||||||||||||||||||||||||||||||||||
|
Source: Refinitiv, Edison Investment Research. Note: Valuation data as at 21 March 2019. |
|||||||||||||||||||||||||||||||||||||||||||
Fund profile: Bias to emerging markets
MYI is a well-established trust, launched in December 1907 and managed by Aberdeen Standard Investments. Since June 2004, the lead manager has been Bruce Stout, a member of Aberdeen Standard Investments’ global equity team; he has worked for the company (and its predecessors) since 1987 and has been directly involved with MYI since 1992. The manager aims to generate long-term capital growth (while preserving capital during periods of stock market weakness) and an above-average dividend yield from a globally diversified portfolio of equities and fixed income securities. There are no limits on geographic or sector exposure. Single holdings, at the time of investment, are limited to 15% of the portfolio and total gearing of up to 30% of NAV is permitted in normal market conditions (net gearing of 11.9% at end-February 2019).
The trust has a composite benchmark: 40% FTSE World UK and 60% FTSE World ex-UK indices; the high UK weighting is due to historical considerations, as in the past, other regions did not offer competitive dividend yields. (MYI’s UK exposure has declined from c 45% in 2004 to c 10% now.) Because of a change in the Financial Conduct Authority’s rules, whereby fund managers are required to explain their use of and adherence to benchmarks in the funds they manage, the board and the manager are considering if there is a more appropriate benchmark for MYI. This is deemed necessary due to the trust’s relative high exposure to emerging markets (more than 55% of the portfolio – held in both equities and fixed income securities). Given MYI’s focus on both capital- and income-derived returns, an inflation-based or absolute return (cash-plus) benchmark may be considered appropriate. Stout emphasises that whatever the trust’s benchmark is, he will continue to adhere to his index-agnostic investment process, seeking to both grow and preserve capital, while generating an above-average portfolio yield.
The fund manager: Bruce Stout
The manager’s view: Positive on outlook for emerging markets
Reflecting on 2018, the manager says there were two key drivers to the global stock market: tighter US monetary policy and the rise of US protectionism, which particularly affected emerging markets, including their currencies, many of which are linked to the US dollar. The Federal Reserve has since adopted a more dovish approach, anticipating no interest rate hikes in 2019 and a slowdown in the reduction of its holdings in US Treasury bonds in response to stronger economic headwinds than previously anticipated. Stout says this change in stance is very positive for the interest rate cycles in the Asia Pacific and Latin American regions, where policy is much tighter than it would have been as a result of rising US interest rates and protectionism. The manager says that in selected emerging market countries, such as Indonesia and Mexico, levels of inflation are much lower than interest rates and if interest rates come down, it should be very positive for the performance of cyclical stocks, including consumer discretionary and financials.
In contrast, Stout is less enthusiastic about the prospects for developed markets, given the upcycle is now more than a decade old and there is increasing evidence of slowing economic growth, including in Europe and the US. However, the manager says that although the macro backdrop is interesting and can be influential, he continues to select stocks on a bottom-up basis, seeking companies that can consistently grow earnings and dividends. In general, he sees more attractive opportunities in emerging markets, where fundamentals are more ‘normal’ and there is a lack of headwinds such as excessive levels of debt, low consumer demand or a lack of policy flexibility. The manager believes that if developed economies slow, the impact on emerging market consumption will probably be modest, given most emerging market countries no longer have export-led economies.
Asset allocation
Investment process: Focus on quality and value
Stout adheres to Aberdeen Standard Investments’ (ASI’s) house style, seeking high-quality companies that are trading on a reasonable valuation. Meeting company managements is a key feature of the investment process. The manager is able to invest in companies that are included on the ‘buy lists’ of any of ASI’s specialist regional fund management teams (UK, Europe, Asia Pacific ex-Japan, North America, Japan and emerging markets). As in-depth bottom-up stock selection rather than a consideration of macro factors is the key driver of MYI’s portfolio construction, individual share price performance rather than asset allocation should be the trust’s main value driver. There is a board requirement that MYI’s portfolio has between 45 and 150 holdings (there were 50 equities and 28 fixed interest investments at end-February 2019, which was in line with the prior year). The manager stresses that he invests without regard to benchmark allocations and is happy to invest across the market-cap spectrum. More than 55% of the portfolio is invested in Asia Pacific ex-Japan, Latin America and other emerging markets, as these are regions where Stout finds the best growth and value opportunities. His emphasis is on investing in defensive businesses where he has a high degree of confidence in a company’s ability to deliver earnings and dividend growth; essentially ‘buying good companies that are doing good things’. The process for selecting fixed income securities is the same as for equity investments, with the manager determining the relative value and prospects of each position. Initial equity investments are generally between 1.0% and 1.5% of the portfolio, while fixed income positions are generally smaller. To mitigate stock-specific risk, a holding will be trimmed within 30 days if it reaches 5% of the portfolio, and Stout is required to sell a holding within 30 days if it is no longer included in ASI’s regional ‘buy lists’. Portfolio turnover is very low, and many of the trust’s positions have been held for many years.
Current portfolio positioning
MYI’s portfolio breakdown is shown in Exhibit 3. Over the 12 months to end-February 2019, there have been modest changes in exposure, with the largest moves being a 2.8pp higher allocation to North America and decreased exposure to the UK (-1.6pp).
Stout says he is comfortable with the trust’s level of fixed income securities, which at 16.2% is towards the lower end of the 15–20% five-year historical range. MYI’s top 10 concentration was 31.4% at end-February 2019 (Exhibit 1), which was modestly lower than 32.8% a year earlier; eight positions were common to both periods, highlighting the fund’s low turnover.
Exhibit 3: Portfolio breakdown by security type and geography (% unless stated)
Portfolio end-February 2019 |
Portfolio end- February 2018 |
Change (pp) |
|
Equities |
|||
Asia Pacific ex-Japan |
25.6 |
24.9 |
0.7 |
North America |
17.2 |
14.4 |
2.8 |
Latin America & EM |
15.9 |
17.0 |
(1.1) |
Europe ex-UK |
10.6 |
10.4 |
0.2 |
UK |
10.2 |
11.7 |
(1.5) |
Japan |
3.7 |
3.6 |
0.1 |
Africa |
0.6 |
1.0 |
(0.4) |
83.8 |
83.0 |
0.8 |
|
Bonds/cash |
|
|
|
Latin America & EM |
8.5 |
8.4 |
0.1 |
Asia Pacific ex-Japan |
5.1 |
5.2 |
(0.1) |
Africa |
1.1 |
1.3 |
(0.2) |
Europe ex-UK |
1.0 |
1.5 |
(0.5) |
UK |
0.4 |
0.5 |
(0.1) |
Japan |
0.0 |
0.0 |
0.0 |
North America |
0.0 |
0.0 |
0.0 |
Cash |
0.1 |
0.1 |
0.0 |
16.2 |
17.0 |
(0.8) |
|
Total |
|
|
|
Asia Pacific ex-Japan |
30.7 |
30.1 |
0.6 |
Latin America & EM |
24.4 |
25.4 |
(1.0) |
North America |
17.2 |
14.4 |
2.8 |
Europe ex-UK |
11.6 |
11.9 |
(0.3) |
UK |
10.6 |
12.2 |
(1.6) |
Japan |
3.7 |
3.6 |
0.1 |
Africa |
1.7 |
2.3 |
(0.6) |
Cash |
0.1 |
0.1 |
0.0 |
100.0 |
100.0 |
|
Source: Murray International Trust, Edison Investment Research
During FY18 (ended 31 December), there were four new positions initiated:
■
Bank Pekao – Stout explains that fundamentals in the Polish banking sector are robust. Following the European banking crisis in 2011/12, regional competitors retrenched to their own countries; there is increased loan demand in Poland; and its financial services sector is underpenetrated. The manager says that Bank Pekao is the best-capitalised bank in Europe, with a total capital ratio of 17.4% and he believes it is managed by a high-quality team.
■
Epiroc – a Swedish industrial company spun out of Atlas Copco, providing mining and construction products and equipment. Stout says the company is able to generate high margins as it offers specialist equipment for use in hostile underground environments and has a good balance between original equipment and higher-margin aftermarket sales.
■
Samsung Electronics – the manager explains that historically, this company was not a suitable investment for an income fund, due to its low distribution policy. However, in recent quarters, Samsung has meaningfully increased its dividend and its shares now yield more than 3%. The company has a very strong balance sheet and a broad product range; however, its share price suffered in the 2018 stock market weakness, which afforded Stout an attractive entry point.
■
Schlumberger – the leading global oil service company, which along with the rest of the sector was negatively affected by oil price weakness, prompting energy companies to significantly reduce their capex. The cycle is now improving as higher commodity prices and the results of cost-cutting programmes mean energy companies are once again flush with cash and consolidation within the oil service industry has led to an improved demand/supply balance, which should result in a firmer pricing environment. Stout says Schlumberger is a high-quality company with a conservative balance sheet, while its stock offers a c 5% dividend yield.
The four stocks sold in FY18 were Mexican beverage company Femsa (investing for future growth rather than growing its dividend), Italian steel pipe manufacturer Tenaris (very long-term holding, but a competitive market) and small positions in European companies Casino and Engie (concerns about economic growth in the region and the sustainability of dividend growth).
Performance: Long-term double-digit total returns
In FY18, MYI’s NAV and share price total returns of -7.5% and -6.8% respectively trailed the benchmark’s -5.2% total return. Individual stock contributions were led by US exchange company CME group (+0.8pp) and Malaysia’s Public Bank and US telecom company Verizon (both +0.4pp), while the largest detractors were tobacco firms British American Tobacco and the US’s Philip Morris (-1.4pp and -0.9pp respectively), along with Chilean lithium producer Química y Minera (-1.2pp). However, of the overall 110bp portfolio underperformance (before costs), 90bp was due to asset allocation, with just 20bp due to stock selection.
|
Exhibit 4: Investment trust performance to 28 February 2019 |
|
Price, NAV and benchmark total return performance, one-year rebased |
Price, NAV and benchmark total return performance (%) |
|
|
|
Source: Refinitiv, Edison Investment Research. Note: Three, five and 10-year performance figures annualised. |
|
Over the last three and 10 years, MYI has generated double-digit average annual total returns in both NAV and share price terms (Exhibit 4, RHS). On a relative basis, the trust has outperformed its composite benchmark in share price terms over three years, while lagging over one, five and 10 years (Exhibit 5). Its NAV has underperformed over these periods. MYI’s defensive qualities are shown in Exhibit 6, as it meaningfully outperformed its composite benchmark in the Q418 global stock market correction.
|
Exhibit 5: Share price and NAV total return performance, relative to indices (%) |
||||||||
|
One month |
Three months |
Six months |
One year |
Three years |
Five years |
10 years |
|
Price relative to composite benchmark* |
(1.4) |
7.9 |
10.2 |
(3.6) |
8.2 |
(6.5) |
(6.1) |
|
NAV relative to composite benchmark* |
(2.5) |
0.3 |
4.5 |
(4.7) |
(1.2) |
(5.3) |
(4.0) |
|
Price relative to FTSE World UK |
(1.9) |
5.3 |
8.8 |
(2.5) |
20.3 |
16.9 |
18.7 |
|
NAV relative to FTSE World UK |
(3.0) |
(2.1) |
3.2 |
(3.7) |
9.8 |
18.4 |
21.5 |
|
Price relative to FTSE World ex-UK |
(1.0) |
9.8 |
11.4 |
(3.9) |
1.8 |
(18.2) |
(17.3) |
|
NAV relative to FTSE World ex-UK |
(2.2) |
2.1 |
5.6 |
(5.1) |
(7.0) |
(17.1) |
(15.4) |
|
|
Source: Refinitiv, Edison Investment Research. Note: Data to end-February 2019. Geometric calculation. *Composite benchmark is 40% FTSE World UK and 60% FTSE World ex-UK. |
||||||||
|
Exhibit 6: NAV total return performance relative to benchmark over three years |
||||||||
|
||||||||
|
Source: Refinitiv, Edison Investment Research |
||||||||
Capital structure and fees
MYI is a conventional investment trust with one class of share; there are 128.8m ordinary shares in issue. The trust has £185m in debt, including a £60m, five-year facility with the Royal Bank of Scotland International (RBSI) at an all-in rate of 2.328%, which was taken out on 31 May 2018. MYI also has a £15m loan with RBSI that is due to mature in May 2019; the board is reviewing options to replace this facility. Total gearing of up to 30% is permitted in normal market conditions; net gearing was 11.9% at end-February 2019.
The trust has recently revised its management fee. With effect from 1 January 2019, 0.500% will be charged on net assets up to £1.2bn, with 0.425% of NAV above this level (previously 0.575% up to £1.2bn, 0.500% between £1.2bn and £1.4bn, and 0.425% above £1.4bn). The management fee is split 30% and 70% between the revenue and capital accounts respectively. In FY18, MYI’s ongoing charge was 0.69%, 5bp higher than 0.64% in FY17.
Dividend policy and record
MYI pays quarterly dividends in August, November, February and May. The board employs a progressive dividend policy, meaning in years when the trust’s income is lower distributions will be supplemented from reserves. MYI’s revenue stream is affected by the strength or weakness of sterling; however, due to the complexities and costs associated with currency hedging, the board believes hedging would not be in shareholders’ best interests.
The FY18 proposed total dividend of 51.5p per share (0.96x covered) is 3.0% higher year-on-year, and while this increase is modestly lower than the 3.7% average annual compound growth rate over the last five years, it is higher than the rate of UK inflation over the period. At end-FY18, MYI had £73.6m in revenue reserves, which is c 1.1x the FY18 dividend payment. Based on its current share price, MYI is offering a dividend yield of 4.4%.
Peer group comparison
Exhibit 8: AIC Global Equity Income sector as at 21 March 2019*
% unless stated |
Market cap £m |
NAV TR |
NAV TR |
NAV TR |
NAV TR |
Discount (cum-fair) |
Ongoing charge |
Perf. |
Net gearing |
Dividend yield (%) |
Murray International |
1,543.6 |
4.5 |
41.7 |
48.9 |
218.0 |
3.5 |
0.7 |
No |
113 |
4.3 |
Blue Planet Investment Trust |
18.8 |
0.8 |
21.1 |
5.8 |
|
(15.5) |
3.7 |
No |
106 |
12.6 |
Henderson International Income |
285.0 |
3.0 |
39.3 |
63.3 |
|
0.7 |
0.8 |
No |
100 |
3.4 |
Invesco Perp Select Global Equity Inc |
63.0 |
2.2 |
39.3 |
60.0 |
225.3 |
(2.8) |
0.8 |
Yes |
107 |
3.5 |
JPMorgan Global Growth & Income |
414.2 |
1.1 |
51.6 |
75.0 |
304.3 |
2.0 |
0.6 |
Yes |
108 |
4.0 |
Scottish American |
543.0 |
7.1 |
51.8 |
77.3 |
299.8 |
4.1 |
0.8 |
No |
115 |
3.0 |
Securities Trust of Scotland |
179.6 |
8.4 |
38.5 |
53.2 |
269.2 |
(7.6) |
0.9 |
No |
109 |
3.6 |
Average |
435.3 |
3.9 |
40.5 |
54.8 |
263.3 |
(2.3) |
1.2 |
108 |
4.9 |
|
MYI rank in sector (7 trusts) |
1 |
3 |
3 |
6 |
5 |
2 |
6 |
2 |
2 |
Source: Morningstar, Edison Investment Research. Note: *Performance as at 20 March 2019 based on ex-par NAV. TR=total return. Net gearing is total assets less cash and equivalents as a percentage of net assets.
MYI is by far the largest trust in the AIC Global Equity Income sector (Exhibit 8). Its NAV total returns are above the mean over one and three years, ranking third out of seven funds in each period, while they are below average over five and 10 years. However, Stout is keen to stress that he does not consider how the peer group is performing; his sole focus is on MYI’s shareholders and delivering on the trust’s strategy of long-term capital growth (and capital preservation during periods of market weakness), while offering an above-average dividend yield.
MYI is one of the four peers trading at a premium; it has a competitive ongoing charge and an above-average level of gearing. Excluding Blue Planet’s double-digit dividend yield, MYI offers the highest yield in the sector, which is 0.7pp above the 3.6% (ex-Blue Planet) average.
The board
There are six directors on the board of MYI, all of whom are non-executive and independent of the manager: Kevin Carter (appointed to the board on 23 April 2009, chairman since 28 April 2011); Peter Dunscombe (appointed on 29 April 2011, senior independent director since 26 April 2018); Marcia Campbell (appointed on 27 April 2012); David Hardie (appointed on 1 May 2014); Alexandra Mackesy (appointed on 1 May 2016); and Claire Binyon (appointed on 1 May 2018).
The board is planning for the future, as Dunscombe will retire at the 2020 AGM, with Hardie becoming the new senior independent director, while chairman Carter will retire at the 2021 AGM.
|
|
Telford Homes represents a pure play on London’s clear requirement for the delivery of more good-quality, new build homes. Management is continuing to orient development activities towards the more robust build to rent (BTR) subsector, although there will be a near-term dip in earnings as the pipeline transitions, factoring in isolated other project delays and current market conditions also. Regaining and sustaining historic profit levels would warrant a share price significantly ahead of the present valuation.