Last close As at 06/08/2026
—
— 0.00 (0.00%)
Market capitalisation
—
Research: Investment Companies
European Assets Trust (EAT) aims to achieve capital growth through investing in listed small- and medium-sized companies in Europe, excluding the UK. It is also focused on capital preservation, seeking quality companies with strong business models and balance sheets that can sustain long-term earnings growth through economic cycles. The trust has delivered annualised NAV total returns of 11.2% over the past 10 years, while a high payout policy supports a generous yield, currently 6.2%. Leading indicators suggest that Europe’s recovery, which started later than many major economies, remains embedded. Notwithstanding higher equities valuations, the manager continues to find attractive investment ideas and is focused on companies’ structural growth characteristics.
Written by
European Assets Trust |
Capital growth objective with high yield |
Investment trusts |
11 July 2018 |
Share price/discount performance
Three-year performance vs index
Gearing
Analysts
|
|||||||||||||||||||||||||||||||||||||||||||||||||||||||||||||||||||||||||||||||||||||||||
European Assets Trust (EAT) aims to achieve capital growth through investing in listed small- and medium-sized companies in Europe, excluding the UK. It is also focused on capital preservation, seeking quality companies with strong business models and balance sheets that can sustain long-term earnings growth through economic cycles. The trust has delivered annualised NAV total returns of 11.2% over the past 10 years, while a high payout policy supports a generous yield, currently 6.2%. Leading indicators suggest that Europe’s recovery, which started later than many major economies, remains embedded. Notwithstanding higher equities valuations, the manager continues to find attractive investment ideas and is focused on companies’ structural growth characteristics.
12 months ending |
Share price |
NAV |
EMIX Smaller European ex-UK (%) |
FTSE AW Europe ex-UK (%) |
FTSE All- |
30/06/14 |
17.1 |
18.2 |
26.8 |
15.6 |
13.1 |
30/06/15 |
18.2 |
18.3 |
(0.3) |
0.4 |
2.6 |
30/06/16 |
(4.1) |
2.9 |
14.2 |
6.3 |
2.2 |
30/06/17 |
41.7 |
30.9 |
35.8 |
28.7 |
18.1 |
30/06/18 |
(0.1) |
3.2 |
6.9 |
3.0 |
9.0 |
Source: Morningstar, Thompson Datastream. Note: All % on a total return basis in GBP.
Investment strategy: Rigorous and patient
Manager Sam Cosh has a bottom-up investment approach involving meetings with company managements and rigorous fundamental analysis of their financials and business models. This process is facilitated by a well-resourced team of 12 European equity specialists. The manager is unconstrained by index considerations and the portfolio of c 40 stocks is therefore a reflection of his highest-conviction investment ideas, which he believes can be held for the long term. Valuation discipline is deemed important and Cosh is willing to be patient, placing portfolio candidates that do not meet his valuation criteria on the trust’s ‘patient fishermen’ list, awaiting a better purchase opportunity.
Market outlook: Europe recovery embedded
The EMIX Smaller Europe ex-UK index has performed strongly over the past 18 months, outpacing the large-cap FTSE AW Europe ex-UK index over this period. Company valuations have risen, but have so far been supported by strong earnings momentum. Leading indicators suggest Europe’s economic recovery is well embedded, with strong consumer confidence and falling unemployment. These factors should help underpin earnings growth, although equities could be vulnerable should earnings disappoint.
Valuation: Narrow discount supported by high yield
EAT currently trades at a 5.0% discount to its cum-income NAV, which is below the three-year average of 0.9%. Supported by the board’s high dividend payout policy, the trust typically trades close to its NAV, and has often traded at a premium. EAT’s current dividend yield of 6.2% is significantly above those of its peers.
Exhibit 1: Trust at a glance
Investment objective and fund background |
Recent developments |
||||||||||||||||||||||||||||||||||||||||||||||||||||||||||||||||||||||
European Assets Trust is an investment company incorporated in the Netherlands and listed on the LSE and Euronext Amsterdam. It targets capital growth through investment in quoted small- and medium-sized companies in Europe (ex-UK), taking the EMIX Smaller Europe ex-UK index as a benchmark. It has adopted a high distribution policy; dividends have been paid from a combination of income and capital. |
■ 18 April 2018: AGM – shareholders approved a 10-for-one stock split, trading effective 3 May 2018. ■ 7 March 2018: Final results announced. Sterling NAV TR +22.6% vs +23.3% for benchmark. Sterling share price TR +35.8%. ■ January 2018: Declaration of 2018 total dividend €0.088 per share, payable in four equal instalments (previously three instalments). ■ 16 November 2017: Announcement of a tiered management fee; assets in excess of €500m will be charged at a reduced rate of 0.65%. |
||||||||||||||||||||||||||||||||||||||||||||||||||||||||||||||||||||||
Forthcoming |
Capital structure |
Fund details |
|||||||||||||||||||||||||||||||||||||||||||||||||||||||||||||||||||||
AGM |
May 2019 |
Ongoing charges |
1.06% |
Group |
BMO Global Asset Mgt (formerly F&C) |
||||||||||||||||||||||||||||||||||||||||||||||||||||||||||||||||||
Interim results |
August 2018 |
Net cash |
4.0% as at end-May 2018 |
Manager |
Sam Cosh |
||||||||||||||||||||||||||||||||||||||||||||||||||||||||||||||||||
Year end |
31 December |
Annual mgmt fee |
0.8% of gross assets reducing to 0.65% above €500m |
Address |
Exchange House, Primrose Street, London, EC2A 2NY |
||||||||||||||||||||||||||||||||||||||||||||||||||||||||||||||||||
Dividend paid |
Quarterly |
Performance fee |
None |
||||||||||||||||||||||||||||||||||||||||||||||||||||||||||||||||||||
Launch date |
1972 |
Trust life |
Indefinite |
Phone |
+44 (0)800 136420 |
||||||||||||||||||||||||||||||||||||||||||||||||||||||||||||||||||
Continuation vote |
None |
Loan facilities |
€45m with Kas Bank |
Website |
|||||||||||||||||||||||||||||||||||||||||||||||||||||||||||||||||||
Dividend policy and history |
Share buyback policy and history |
||||||||||||||||||||||||||||||||||||||||||||||||||||||||||||||||||||||
The board targets a distribution of 6% of euro-denominated NAV as at the end of the preceding year, payable in January, April, July and October. |
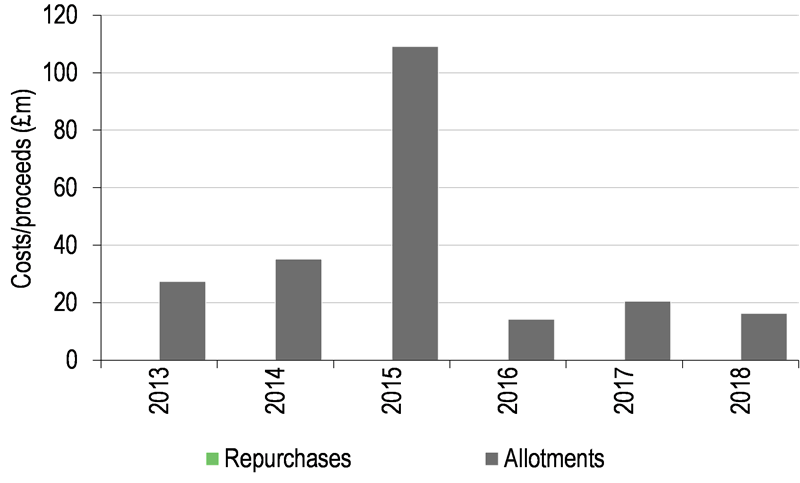
EAT is authorised to both repurchase and allot its ordinary shares. The chart of buybacks and issuance excludes shares issued as scrip dividends. |
||||||||||||||||||||||||||||||||||||||||||||||||||||||||||||||||||||||
|
|
||||||||||||||||||||||||||||||||||||||||||||||||||||||||||||||||||||||
Shareholder base (as at 26 June 2018) |
Portfolio exposure by geography (as at 31 May 2018) |
||||||||||||||||||||||||||||||||||||||||||||||||||||||||||||||||||||||
|
|
||||||||||||||||||||||||||||||||||||||||||||||||||||||||||||||||||||||
Top 10 holdings (as at 31 May 2018) |
|||||||||||||||||||||||||||||||||||||||||||||||||||||||||||||||||||||||
|
|||||||||||||||||||||||||||||||||||||||||||||||||||||||||||||||||||||||
Source: European Assets Trust, Edison Investment Research, Bloomberg, Morningstar. Note: *N/A where not in May 2017 top 10.
Market outlook: European recovery still underway
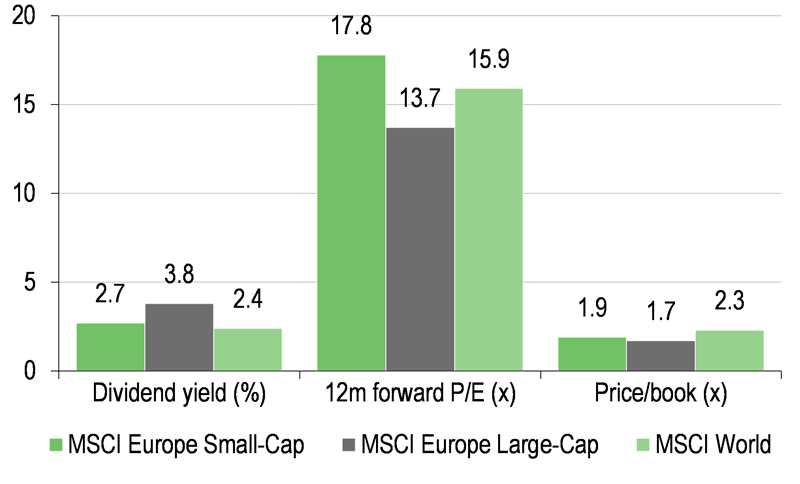
European smaller companies have performed strongly over the past 18 months and, as shown in the left-hand chart of Exhibit 2, the EMIX Smaller Europe ex-UK index has outperformed the large-cap FTSE AW Europe ex-UK index over this period. The positive performance of European equities was initially driven by exporters, which benefited from a US-led global economic recovery at a time when Europe was still relatively weak. Growth has since extended to the domestic European economy, and appears well embedded. Although the eurozone purchasing managers index has recently fallen slightly, it remains above 50, a level consistent with continued economic expansion. Meanwhile, consumer confidence has surpassed the pre-global financial crisis levels and unemployment has continued to fall. These factors should help underpin continued earnings momentum for European companies. However, valuations appear relatively expensive, as shown in the right-hand chart, especially if earnings fail to meet market expectations.
|
Exhibit 2: Market performance and valuation |
|
European and world index total returns over five years (£) |
Valuation metrics for European small-cap, large-cap and world equities* |
|
|
|
Source: Thomson Datastream, Edison Investment Research, Bloomberg, MSCI. Note: *Valuation data as at 25 June 2018. |
|
Fund profile: High conviction, high yield
EAT was launched in 1972, and is dual-listed on the London and Amsterdam stock exchanges. It aims to achieve capital growth through investing in listed small- and medium-sized companies in Europe (excluding the UK), defined as those with a market capitalisation below that of the largest company in the EMIX Smaller European Companies ex-UK Index. Manager Sam Cosh follows a bottom-up approach, selecting stocks for a high-conviction, relatively concentrated portfolio of around 40 stocks. The manager is benchmark agnostic and comfortable with being contrarian, focusing on quality businesses that are attractively valued, which should do well through economic cycles. The board adopts a high distribution policy and targets a dividend representing 6% of the company’s prior year-end NAV in euro terms, funded from both income and other reserves. EAT’s current dividend yield of 6.2% is the highest among its peers (see Exhibit 8).
The fund manager: Sam Cosh
The manager’s view: Favours structural over cyclical drivers
Cosh believes Europe’s economic recovery, which started later than that of the US and other major economies, is not yet complete. However, he is slightly more cautious than six months ago, and says that valuations for small-cap equities are generally extended, especially as the earnings recovery cycle has moved beyond the nascent stage. At this juncture, the manager believes valuation discipline becomes even more important, and is unwilling to ‘pay up’ for companies. His watchlist of stocks that he would like to own, but at more attractive valuations (the ‘patient fishermen’ list) is long, and has been so for some time as European small-cap equities have continued to perform; they have been resilient even during periods of uncertainty, such as the during the June 2018 Italian parliamentary election.
As the European economic recovery matures, Cosh believes companies exposed to cyclical factors, such as commodity prices, are at a higher risk of earnings disappointment and share price correction. He is shifting his focus in favour of companies that can benefit from multi-year structural growth and do well through economic cycles.
Asset allocation
Investment process: Fundamental and patient approach
The manager’s investment approach is focused on bottom-up stock selection. There are approximately 2,000 listed European (ex-UK) small- and mid-cap companies. Meeting firms is an important part of the investment process as the manager seeks to find companies that are less well known. The BMO European equities team is well resourced, with 12 members, which allows an intense schedule of management meetings and thorough company fundamental analysis. Key attributes for portfolio companies include strong balance sheets, healthy cash flows, and high and sustainable returns on capital over a long-term horizon. The team produces detailed, proprietary research for each candidate stock, which includes valuation targets and the identification of triggers for the sale of a stock. Companies that meet the manager’s investment criteria, but not the manager’s entry valuation level, are added to EAT’s ‘patient fishermen’ list, awaiting an opportunity for purchase.
The portfolio has four broad investment themes (typical weights in brackets):
■
Durable franchise (40-50%). This is the core of the portfolio and represents companies with at least modest growth potential, disciplined management and robust business models.
■
Wide moat growth (25-30%). These are faster growing companies with an ability to defend market share in a competitive environment, for example through having a strong brand or unique product.
■
Transformation/recovery (15-20%). These are companies that are undervalued but have a catalyst for change, such as new management or reallocation of capital.
■
Deep value (10-15%). These companies are often out-of-favour, where the manager believes a recovery potential is underappreciated. At present, the manager is finding it more challenging than normal to find stocks in this category.
Current portfolio positioning
The manager has been relatively active over the past year and EAT’s portfolio’s exposure has shifted away from cyclically vulnerable stocks in favour of less economically sensitive companies, with multi-year structural growth drivers. Recent sells have included stocks that benefited as Europe’s economic recovery got underway, but now reflect valuations that are full, at a time when the manager believes the economic cycle is getting more mature. Examples include: SAF-Holland, a German commercial vehicles parts supplier; Ireland-based building materials supplier, Grafton; and Interpump, an Italian manufacturer of high-pressure piston pumps with significant exposure to the commercial vehicle and construction industries. The manager has also reduced EAT’s holdings in companies exposed to raw material price fluctuations, with the sale of Sweden’s Nordic Waterproofing and Spain’s Ebro Foods.
As shown in Exhibit 3, the largest reduction in sector exposure over the year to end-May 2018 has been in consumer goods (-5.9pp). In addition to the sale of Ebro Foods, the manager sold Finnish sporting goods company Amer Sports as it reached his fair value target, and two Spanish media stocks Atresmedia and Mediaset España. Cosh believes the media sector is facing structural challenges with consumption shifting rapidly from traditional TV channels to internet- and subscription-based channels, such as Netflix.
Exhibit 3: Portfolio geographic and industrial exposure* (% unless stated)
Portfolio end-May 2018 |
Portfolio end- May 2017 |
Change (pp) |
Portfolio end- May 2018 |
Portfolio end- May 2017 |
Change (pp) |
|||
Germany |
19.9 |
19.8 |
0.1 |
Industrials |
33.5 |
34.3 |
(0.8) |
|
Switzerland |
13.8 |
7.5 |
6.3 |
Consumer goods |
17.0 |
22.9 |
(5.9) |
|
Sweden |
13.4 |
8.3 |
5.1 |
Financials |
15.6 |
15.2 |
0.4 |
|
Norway |
10.6 |
7.5 |
3.1 |
Consumer services |
13.0 |
10.7 |
2.3 |
|
Spain |
10.2 |
8.7 |
1.5 |
Basic materials |
7.4 |
4.6 |
2.8 |
|
Netherlands |
8.3 |
6.8 |
1.5 |
Healthcare |
7.0 |
5.9 |
1.1 |
|
Ireland |
6.9 |
14.2 |
(7.3) |
Technology |
4.9 |
6.4 |
(1.5) |
|
Italy |
6.2 |
13.1 |
(6.9) |
Oil & gas |
1.6 |
0.0 |
1.6 |
|
France |
4.8 |
4.6 |
0.2 |
|||||
Denmark |
3.4 |
4.6 |
(1.2) |
|||||
Austria |
2.6 |
0.0 |
2.6 |
|||||
Finland |
0.0 |
2.7 |
(2.7) |
|||||
Portugal |
0.0 |
2.2 |
(2.2) |
|||||
Total |
100.0 |
100.0 |
Total |
100.0 |
100.0 |
Source: European Assets Trust, Edison Investment Research. Note: *All figures are subject to rounding.
Netherlands listed Sligro Food Group is a new addition to the portfolio. It operates food cash-and-carry outlets and delivery services, with a leading position in the Dutch market and a growing presence in the less-mature Belgium market. In December 2017, Sligro entered a strategic partnership with Heineken to provide distribution logistics for its beer and cider products. The manager believes Sligro’s business is highly scalable and this partnership has good potential to increase the company’s margins. Cosh also purchased a Swiss healthcare company, Tecan Group, a provider of automated laboratory instruments and solutions. The company is well-placed to capitalise on the long-term trend for increasing automation in laboratories, and the growth of the medical consumables market. Tecan is well-managed, has a strong balance sheet with net cash, and Cosh believes that investors underestimate the company’s ability to expand margins over time.
The manager has invested in the internet subsector (where the trust previously had no exposure), through the purchase of German company Rocket Internet, an incubator and investor in internet and technology companies globally. Cosh has found it challenging to identify companies in this sector with proven business models and cash flows at reasonable valuations. However, Rocket gives EAT exposure through a diversified portfolio of over 100 investments, including three companies that are already listed: Delivery Hero, home24 and HelloFresh. The company has a pipeline of future listings and has significant net cash on its balance sheet.
Cosh has also purchased TGS, its first oil and gas sector exposure for some time. The company provides geoscience data to exploration and production companies globally. TGS has one of the most extensive libraries of data in the industry, which the manager believes is undervalued given the higher oil price.
Performance: Weighed by referendum result
As shown in Exhibits 4 and 5, EAT’s 10-year NAV total return has outperformed its benchmark EMIX Smaller Europe ex-UK index. It has also significantly outperformed the FTSE AW Europe ex-UK and FTSE All-Share indices over five and 10 years. However, the trust has underperformed the benchmark over one, three and five years. The three- and five-year numbers reflect a pronounced underperformance in 2016, following the result of the UK’s European referendum (as shown in Exhibit 6). EAT was poorly positioned for the outcome, with a significant position in Ireland-listed companies, which were heavily exposed to the UK. These companies suffered as sterling fell sharply, and investors feared deteriorating prospects for the UK economy. Although many of these stocks have since recovered and contributed positively to the portfolio, the post-referendum period of underperformance has continued to weigh on the three- and five-year figures. The one-year underperformance largely reflects EAT’s underweight positions in sectors which have performed strongly, namely technology and energy, where the manager finds it hard to identify companies that meet his investment criteria. Cosh is committed to the investment process, which focuses on long-term capital growth, unconstrained by index considerations, and may result in deviations in performance against the benchmark over shorter time periods.
|
Exhibit 4: Investment trust performance to 30 June 2018 |
||||||||
Price, NAV and benchmark total return performance, one-year rebased |
Price, NAV and benchmark total return performance (%) |
|||||||
|
|
|||||||
|
Source: Thomson Datastream, Edison Investment Research. Note: Three-, five- and 10-year performance figures annualised. |
||||||||
|
Exhibit 5: Share price and NAV total return performance, relative to indices (%) |
||||||||
|
One month |
Three months |
Six months |
One year |
Three years |
Five years |
10 years |
|
Price relative to EMIX Smaller Europe ex-UK |
3.9 |
(4.7) |
(4.9) |
(6.5) |
(18.1) |
(10.3) |
6.5 |
|
NAV relative to EMIX Smaller Europe ex-UK |
1.5 |
(1.5) |
(1.6) |
(3.4) |
(16.1) |
(7.1) |
0.9 |
|
Price relative to FTSE AW Europe ex-UK |
3.3 |
(3.9) |
(3.1) |
(3.0) |
(3.8) |
14.8 |
48.1 |
|
NAV relative to FTSE AW Europe ex-UK |
0.9 |
(0.7) |
0.3 |
0.2 |
(1.4) |
18.7 |
40.2 |
|
Price relative to FTSE All-Share |
3.8 |
(9.1) |
(5.9) |
(8.3) |
3.1 |
23.0 |
37.5 |
|
NAV relative to FTSE All-Share |
1.4 |
(6.1) |
(2.6) |
(5.3) |
5.6 |
27.2 |
30.1 |
|
|
Source: Thomson Datastream, Edison Investment Research. Note: Data to end-June 2018. Geometric calculation. |
||||||||
|
Exhibit 6: NAV total return performance relative to benchmark over five years |
||||||||
|
||||||||
|
Source: Thomson Datastream, Edison Investment Research |
||||||||
Discount: Typically trades close to NAV
EAT currently trades at a 5.0% discount to its cum-income NAV, slightly below the three-year average of 0.9%. The range over that period is a premium of 3.9% to a discount of 9.6%. As shown in Exhibit 7, EAT typically trades close to its NAV and wider discounts generally reflect periods of unusual volatility, including the UK’s European referendum and US election results and, more recently, the Italian parliamentary election.
|
Exhibit 7: Share price premium/discount to NAV (including income) over three years (%) |
|
|
Source: Thomson Datastream, Edison Investment Research |
Capital structure and fees
EAT has one class of share and, following a 10-for-one stock split effective 3 May 2018, there are currently 359.6m ordinary shares in issue, and none held in treasury. Demand for EAT shares has historically been good, and the board has issued new shares through block listing arrangements to meet investor demand. For the six months to end-June 2018, EAT allotted 7.7m shares raising c €16.2m, leaving 5.3m shares available for issuance.
The trust has a €45m loan facility with Kas Bank. As at end-June 2018, it had no gearing and held net cash of 4.0%. A tiered management fee was introduced in November 2017, and is paid annually to BMO Global Asset Management. A fee of 0.8% is payable on the value of funds below €500m, reducing to 0.65% on funds above €500m (previously a flat fee of 0.8%). The ongoing charges in FY17 were 1.06% (FY16: 1.12%).
Dividend policy and record
The board aims to pay shareholders a dividend of 6% of the trust’s preceding year-end NAV, funded from income and other reserves. For FY18, the board has declared a total dividend of €0.088, representing an increase of 11.6% (FY17: €0.079). From 2018, the dividend will be paid in four equal instalments in January, April, July and October (previously three equal instalments in January, May and August). Dividends are declared in euros and paid in either sterling or euros, with the sterling amount determined by the prevailing exchange rate on the payment dates. Subject to currency fluctuations, the current sterling yield of the trust is 6.2%.
Peer group comparison
The AIC European Smaller Companies sector consists of just four trusts. In terms of NAV total return performance, EAT ranks third over one year, and fourth over three, five and 10 years. The trust ranks first in terms of dividend yield, which at 6.2% is significantly higher than its peers, and helps underpin a narrow discount to NAV.
Exhibit 8: AIC European Smaller Companies peer group as at 10 July 2018*
% unless stated |
Market cap £m |
NAV TR |
NAV TR |
NAV TR |
NAV TR |
Discount (ex-par) |
Ongoing charge |
Perf. fee |
Net gearing |
Dividend yield (%) |
European Assets Trust |
427.9 |
3.7 |
39.9 |
90.2 |
194.1 |
(4.9) |
1.1 |
No |
100 |
6.2 |
JPMorgan European Smaller Cos |
643.2 |
11.2 |
77.9 |
126.4 |
222.2 |
(9.5) |
1.0 |
No |
101 |
1.7 |
Montanaro European Smaller |
151.4 |
14.3 |
88.0 |
96.1 |
208.6 |
(9.9) |
0.0 |
No |
103 |
0.9 |
TR European Growth |
502.1 |
(0.1) |
73.5 |
139.2 |
201.1 |
(10.0) |
0.8 |
Yes |
109 |
1.2 |
Weighted average in sector |
6.3 |
68.1 |
118.5 |
207.9 |
(8.5) |
1.0 |
103 |
2.4 |
||
EAT rank in sector |
3 |
3 |
4 |
4 |
4 |
1 |
1 |
4 |
1 |
Source: Morningstar, Edison Investment Research. Note: *Performance data to 9 July 2018. TR = total return. Net gearing is total assets less cash and equivalents as a percentage of net assets.
The board
EAT is incorporated in the Netherlands and has a two-tiered board structure. The management board has a single director, FCA Management, which is represented by Wilbert van Twuijver and Tim Koster. The supervisory board is more akin to a board of directors on a UK investment trust. This board consists of five independent members, chaired by Jack Perry (appointed in 2014). Professor Robert van de Meer is deputy chairman (2007) and Julia Bond is the senior independent director (2014). The other directors are Laurence Jacquot (2011) and Martin Breuer (2016).
|
|
Blancco’s FY18 trading update confirms that despite weaker than expected revenue growth, work on reducing the cost base resulted in a better than expected operating margin of 11%. Positive cash flow in H2 reduced the net debt position to below our forecast. We have revised our forecasts to reflect lower revenues but stronger profitability, resulting in an upgrade to our normalised EPS forecasts of 49% for FY18e and 10% for FY19e. With the appointment of a permanent CFO, the new management team is now complete, and we expect more detail on strategy when the company reports FY18 results in September.