If Fluence can deliver on its H218e target, its shares could re-rate sharply. Its membrane-aerated biofilm reactor (MABR) technology provides a competitive advantage in the growing market for decentralised water treatment. We see the ramp in sales here transforming its scale, revenue visibility and profitability by FY20e. The shares currently trade at a 28% discount to peers’ FY20 EV/EBITDA and a DCF approach, which assumes delivery in H2 and beyond, suggests value up to A$0.85 per share.
Written by
Fluence Corporation |
Time for better treatment? |
Initiation of coverage |
Industrials |
25 September 2018 |
Share price performance
Business description
Next events
Analysts
Fluence CorporationFluence Corporation is a research client of Edison Investment Research Limited |
|||||||||||||||||||||||||||||||||||||||||||||||||
If Fluence can deliver on its H218e target, its shares could re-rate sharply. Its membrane-aerated biofilm reactor (MABR) technology provides a competitive advantage in the growing market for decentralised water treatment. We see the ramp in sales here transforming its scale, revenue visibility and profitability by FY20e. The shares currently trade at a 28% discount to peers’ FY20 EV/EBITDA and a DCF approach, which assumes delivery in H2 and beyond, suggests value up to A$0.85 per share.
Year end |
Revenue ($m) |
EBITDA* |
EPS* |
EV/Revenue |
EV/EBITDA |
P/E |
12/17 |
33.2 |
(23.6) |
(0.07) |
2.8 |
N/A |
N/A |
12/18e |
107.0 |
(13.8) |
(0.03) |
0.9 |
N/A |
N/A |
12/19e |
154.0 |
(2.0) |
(0.01) |
0.6 |
N/A |
N/A |
12/20e |
194.4 |
11.9 |
0.02 |
0.5 |
7.8 |
13.8 |
Note: *EBITDA and EPS are normalised, excluding amortisation of acquired intangibles, exceptional items and share-based payments.
The ‘decentralised’ water and wastewater opportunity
Fluence provides a broad range of water and wastewater treatment solutions from standardised products to large customised projects. Custom project revenue should still grow, but it is the prospects for standardised products such as NIROBOX, Aspiral and submerged MABR (SUBRE) that look the most exciting, in our view. These ‘plug and play’ solutions can cost-effectively boost the performance of existing centralised treatment plants and address unserved, greenfield rural populations. Aspiral and SUBRE are based on a proprietary technology (MABR) that offers both superior treatment and lower energy costs. We see rising government spending on rural wastewater treatment in China as a particularly large opportunity.
Transforming the financial profile
Based on proprietary technology and a capability to ramp up to scale without incurring additional operating costs, the shift to standardised products should improve both revenue visibility and margins. We forecast profitability in Q419e and sustainable cash generation from Q320e. The step-up implied by our forecasts in FY18e and beyond looks daunting compared to historical (pro forma) performance. However, now deep into Q3, the company should have reasonable visibility of H2 FY18e. It recently reiterated full-year revenue guidance of US$105–115m, implying US$77m in H2 FY18e at the midpoint. If Fluence can deliver this, annualised revenues need only grow by a further 12% to reach EBITDA break even.
Valuation: Discount awaiting delivery
At A$0.42 and assuming US$38m of net cash, Fluence’s current share price implies a US$93m enterprise valuation (EV) and 7.8x FY20e EV/EBITDA. A sector average multiple (10.9x) suggests a valuation of A$0.54 per share (28% upside), but a DCF approach that reflects the growth and margins of which we believe Fluence is ultimately capable, suggests a A$0.85 valuation. Investors are, perhaps understandably, cautious after a miss versus guidance last year. We believe meeting FY18e guidance could act as a catalyst for a sharp re-rating of the shares.
Investment summary
Company description: Water and wastewater treatment
Fluence is a global supplier of water and wastewater treatment solutions. Formed in July 2017 from the merger of RWL Water and Emefcy, it undertakes custom projects for industrial and municipal customers and supplies standardised products. Its standardised wastewater products (Aspiral and SUBRE) are based on its proprietary MABR technology. We forecast pro forma revenues nearly doubling in FY18e as a large custom project (San Quintin) ramps in H218e, but it is the prospects for standardised products that look most exciting in our view. We forecast revenue nearly doubling again by FY20e and gross margins rising by 5.9pp driven by this growth. The key points are:
■
The ‘decentralised’ water treatment opportunity: Fluence’s standardised products (NIROBOX, Aspiral and SUBRE) offer ‘plug and play’ solutions that cost-effectively boost performance and capacity at existing treatment plants, and address unserved rural sites. Rising spending on rural wastewater treatment in China presents a particularly large opportunity.
■
MABR offers a competitive advantage: at the heart of Fluence’s standardised wastewater products is a technology (MABR) that delivers superior treatment while significantly cutting energy costs. Fluence believes its containerised solution enables rapid, large-scale deployment and, factoring in energy and monitoring costs, is the cheapest solution capable of meeting China’s exacting Class 1A effluent standard.
■
Transforming the financial profile: the shift away from large lumpy contracts to standardised products based on proprietary technology and capable of scaling up without incurring additional opex should improve both revenue visibility and margins. A rising proportion of gross profits generated by service revenues should also enhance visibility.
Valuation: A 28% EV/EBITDA discount awaiting delivery
At A$0.42, and assuming US$38m of net cash, Fluence’s current share price implies a US$93m EV and 7.8x FY20e EV/EBITDA. A sector average multiple (10.9x) suggests a A$0.54 per share average (28% upside) by the end of FY18e. A DCF approach, which assumes a 2020-30e revenue CAGR of 6% and 15% EBITDA margin, suggests a A$0.85 valuation, more than double the current price. The current discount suggests the market is sceptical about delivery. We believe meeting FY18e guidance could act as a catalyst for a sharp re-rating of the shares.
Financials: Prospects for H218 and beyond
We forecast rapid growth over the next two years as Fluence recognises additional custom project revenue (San Quintin) and (higher margin) standardised products ramp up. Combined with a largely static operating cost base, this growth should deliver profitability in Q419e and sustainable cash generation from Q320e. The step-up implied by our forecasts in FY18e and beyond looks daunting compared to historical performance but the midpoint of FY18 guidance implies revenues of US$77m in H218e (we forecast $74m). If Fluence can deliver H218e, annualised revenues need only grow by a further 12% to reach EBITDA break-even.
Sensitivities: Significant upside and downside risk
The combination of large lumpy contracts and products at an early stage of commercial deployment makes accurately forecasting Fluence’s growth trajectory tough. Given the company missed 2017 forecasts, investor caution is understandable. A 9% cut to our FY20e revenue assumption halves EBITDA and would mean the company needs to raise additional funding. Conversely, the company is negotiating a large ($100m+) custom contract, which is not in our forecasts.
Business description: Global Water Treatment
Fluence is a global supplier of water and wastewater treatment solutions. Formed in July 2017 from the merger of RWL Water and Emefcy, the combination brings together RWL’s scale, distribution and engineering resources with Emefcy’s proprietary technology. For a company of its size, Fluence provides a wide range of solutions. It is active in both drinking and wastewater treatment with desalination, reuse and waste to energy solutions and sells to both municipal (local government) and industrial customers. It has over 330 members of staff and a presence in over 70 countries.
While the scope of the business is broad, its standardised water and wastewater products offer the greatest growth opportunity. Fluence’s ASPIRAL and NIROBOX products provide ‘plug and play’ solutions that are cheaper, more effective and quicker to deploy than traditional alternatives.
From customised projects to standardised products
Fluence’s solutions range from large customised projects to standardised products. The customised projects were the staple of the old RWL business and encompass equipment, engineering, construction and service elements. In these contracts, Fluence can be either the turnkey supplier or work alongside partners to deliver specific elements. Standardised products such as NIROBOX and Aspiral offer a high-quality, cost-effective solution for smaller treatment centres. The company is active in the following areas:
■
Desalination: in arid coastal areas desalinating seawater can be the most effective way of supplying drinking water. Fluence’s NIROBOX provides rapidly deployable solution for low volumes but it also provides larger customised desalination projects for both municipal and industrial customers
■
Wastewater treatment – municipal: in many (particularly developing) countries, rural communities are not connected to piped sewerage systems. Fluence’s Aspiral product provides a scalable turnkey solution for small communities while SUBRE can be fitted to existing treatment centres to increase capacity and effectiveness. Fluence also delivers customised wastewater treatment solutions
■
Water and wastewater treatment – industrial: Fluence provides customised solutions to companies in a range of sectors including food processing, chemical, utilities, oil and gas and steel manufacturing. Customers include Coca-Cola and ArcelorMittal Steel.
■
Wastewater reuse: in some circumstances and if treated sufficiently wastewater can be recycled, significantly cutting input costs and preserving water resources. Fluence has delivered several reuse contracts for both municipal and industrial customers
■
Wastewater to energy: converting the sludge recovered from industrial wastewater treatment into energy reduces energy costs and greenhouse gas emissions. Fluence has developed proprietary anaerobic treatment technologies to extract energy from wastewater and has secured many customised projects, particularly in the food processing sector.
|
Exhibit 1: The water treatment cycle and where Fluence operates |
|
|
Source: Company data, Edison Investment Research (adapted from Robeco). Note: PW = process water, WWT = wastewater treatment, WWR = wastewater re-use, W2E = waste to energy. |
The shift in portfolio
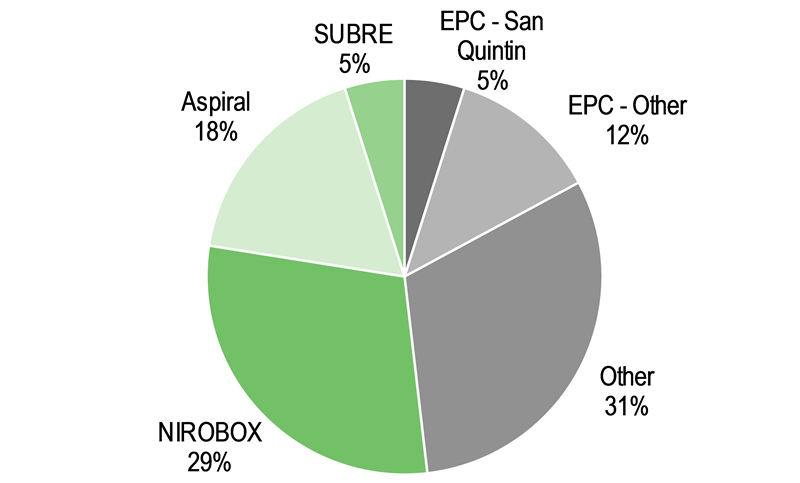
The bulk of Fluence’s current revenue (72% of FY18e) is generated from customised projects including two large engineering, procurement and construction (EPC) contracts at PVDSA (currently $7m per quarter) and San Quintin (ramping from Q318 onwards). The company is also in the final stages of bidding for a large ($100m+) EPC deal to supply drinking water in an African country that, while not factored into our forecasts yet, would boost EPC revenue still further.
|
Exhibit 2: Revenue mix FY18e |
Exhibit 3: Revenue mix FY20e |
|
|
|
Source: Company data, Edison Investment Research estimates |
|
Exhibit 2: Revenue mix FY18e |
|
|
Source: Company data, Edison Investment Research estimates |
|
Exhibit 3: Revenue mix FY20e |
|
|
Source: Company data, Edison Investment Research estimates |
While these contracts build scale and add to the bottom line, over the next two years we expect the majority of Fluence’s growth to be driven by its standardised products such as NIROBOX, Aspiral and SUBRE. As discussed in more detail on page 7, the market for decentralised solutions is expected to grow rapidly and Fluence’s R&D investment since 2010 should give it a competitive advantage. The trajectory may be hard to predict but these standardised products should change the financial profile. A revenue base composed of many smaller deals should prove less ‘lumpy’ than the current one and selling proprietary, rather than third party, equipment should also boost margins. The company indicates SUBRE and Aspiral gross margins are 30–50%, more than double that of a large project. In addition, the company is looking to add service elements to both its standardised and customised contracts to improve visibility and margins. The San Quintin project is expected to start generating $10m in recurring service revenue at a 50% gross margin from FY20e.
Senior management
Fluence’s management, the senior executives highlighted below and the board and operational team, has extensive experience in the water industry and in creating value from technology-driven companies. Management and staff own 10.0% of the shares and options equivalent to c 11% of the share base have been issued.
Executive chairman, Richard Irving: executive chairman of Emefcy since 2010, Richard is also co-founder of Pond Venture Partners. He brings over 30 years’ experience in venture capital, management, marketing and engineering and has helped create over $3bn in shareholder value through IPOs, acquisitions, and private financings including LiveRail (Facebook), Gigle Networks (Broadcom), 4Home (Motorola Mobility) and Transitive (IBM).
MD and CEO, Henry J Charrabé: as president and CEO of RWL Water since its founding in 2010, Henry helped grow the company both organically and through strategic acquisitions. Prior to RWL, Henry was a senior executive at RSL Investments and COO of W2W, an electrocoagulation wastewater technology company.
CFO, Francesco Fragasso: before joining Fluence in March 2018, Francesco was CFO at Desalitech, a reverse osmosis technology company and CFO and VP of operations for Nuvera Fuel Cells, a developer and manufacture of multi-fuel processing systems. Prior to that, he spent more than 10 years in public accounting and corporate finance with Deloitte.
Industry background: Huge unaddressed need
The water industry provides two distinct but interlinked services: supplying clean water and treating wastewater (see Exhibit 1). Both rely heavily on capital-intensive infrastructure (mostly the in-ground pipe, pump and storage network) that is expensive to build and upgrade. It is estimated that the annual global investment in water infrastructure is approximately c $250bn (source: GWI).
Many believe investment must rise sharply if huge public health and environmental issues are to be addressed. Perennially unreported in a developed world that often takes water for granted, it is estimated that over 2 billion people lack access to clean drinking water and 2.3 billion do not have basic sanitation. Groundwater levels are falling in some countries as demand to feed rising populations and supply clean drinking water leads to over abstraction. In developed countries, intensive fertiliser use often leads to nitrogen (N) run-off, eutrophication and enormous damage to aquatic ecosystems. There are growing concerns about the impact of even low levels of some chemicals and metals are having on human health and legacy infrastructure struggles to cope with rising loads and higher standards. Despite these needs, annual growth in infrastructure investment over the last decade has been just 2% globally. Spending is constrained by public finances and attempts to attract private investment into market have met with mixed success.
Supplying clean drinking water is traditionally a passive, low-tech infrastructure-driven process. Water is impounded in reservoirs and sedimentation tanks, filtered and any chemical treatments such as fluoridisation applied. The exceptions are converting seawater into drinking water (desalination), which can be cost efficient in arid coastal areas, and supplying industrial processes (such as boilers for power stations) with ‘ultra-pure’ water. The provision of clean drinking water often raises demand, exacerbating supply shortages and driving the need for wastewater treatment.
Treating wastewater is generally more complex. While the proportion of ‘waste’ generated is usually very small (municipal wastewater is typically only 0.1% waste), the amount and type varies widely by location and pollutants can have significant environmental and public health impacts even at low levels. Recommendations for the maximum levels of over 100 pollutants are set by organisations such as the World Health Organization and implemented through national regulation (see Exhibit 4) but are continually being updated. Three indicators are key:
■
SS (suspended solids) can consist of both organic (faecal) and inorganic material such as metals, which both carry significant health threats.
■
BOD (biological oxygen demand) measures the level of bacterial activity in the water and therefore is a good proxy indicator of dissolved organic matter.
■
N (nitrogen) is produced by municipal waste in the form of ammonia but can be particularly problematic in areas of intensive agriculture where high levels of untreated run-off can lead to eutrophication. Removing N is a particularly difficult and energy intensive.
Exhibit 4: Municipal wastewater discharge standards (mg/l)
Indicator |
China 1A |
China 2 |
EU |
US* |
BOD |
10 |
30 |
25 |
30/45 |
SS |
10 |
30 |
35 |
30/45 |
N |
15 |
10 |
By state |
Source: EPA and Deng and Wheatly (2016). Note: *Seven-day and 30-day averages.
Conventional wastewater treatment consists of:
■
Primary sedimentation: after a preliminary treatment process to remove larger floating and suspended materials, the wastewater is fed into a sedimentation tank. BOD is reduced by c 30% and roughly half the SS settles out at this stage and is removed as sludge.
■
Secondary (biological) treatment: reducing BOD further requires passing the water through filters, which allows bacteria to convert the ammonia to nitrates, which can then be extracted. Historically this was done through a percolating filter but this requires a large land area and significant capital investment. An activated sludge treatment, where the effluent is remixed with air to ensure optimal bacterial conditions, requires power but can produce better results.
■
Final treatment and return to the environment: after a secondary sedimentation period (a third stage is sometimes required in sensitive areas) water can be returned to the environment and for re-use in certain permitted circumstances. The sludge collected in both the primary and secondary stages is potentially available as an energy product or fertiliser.
An increasingly important factor when evaluating wastewater treatment technology is the ongoing operating costs. Energy is often the single largest cost item and lifetime charges can easily exceed the initial investment. Plants with activated sludge treatment typically consume at least 0.8kWh/m3. For a plant serving 15,000 people, this can amount to an electricity demand of 0.8GWh and costs above $120,000 annually. Greater energy efficiency also has wider environmental benefits: reducing the electricity supplied by fossil fuel sources cuts water usage and CO2 emissions. Advanced designs can offset power consumption by converting sewage by-products to energy. Increasingly sophisticated remote monitoring can help reduce staffing and maintenance costs, a particularly important issue for smaller treatment plants.
The potential of the decentralised model
Spending on supply and wastewater treatment infrastructure has understandably focused on urban areas historically. In these locations the problems are often the most acute and provision can benefit the greatest number of people. However, replacing ageing treatment facilities is both hard and expensive as two-thirds of the system is typically in-ground pipes, pumps and storage tanks. Smaller-scale solutions, treating water close to the point of supply or discharge, can supplement existing infrastructure, reducing the need for expensive upgrades. As urban provision rises, the residual underserved population is increasingly composed of smaller towns and rural communities. Aside from the benefits for the local population, improving upstream water treatment can improve food production and cut downstream pollution. Due to their dispersed distribution, rural locations typically require more pipework and pumps to connect a population and are therefore more expensive on a per capita basis. Extending infrastructure out to rural communities requires a different model if it is to be cost effective. While the overall water market may be growing only slowly, we see significant growth potential in this underserved segment (see Exhibit 5).
|
Exhibit 5: Growth in the Global decentralised water treatment market |
|
|
Source: MarketandMarkets analysis, Global Water Intelligence, company estimates |
Fluence’s standardised products provide solutions for this market. NIROBOX is a desalination treatment system packaged into a 40ft lorry container. Based on proprietary technology, this system primarily takes seawater and converts it into drinkable water using advanced filtration. Each container can provide up to 1,500m3 per day, but it can be deployed modularly to meet higher or lower volume requirements. As a standardised, readily transportable solution, it can also be deployed rapidly to supplement existing treatment options and in disaster recovery situations.
Its Aspiral product for wastewater treatment is potentially even more significant. Fluence sees the MABR technology at the heart of this product as a competitive differentiator. This technology allows air to pass into the effluent, providing the aeration and biological treatment needed to remove biological contamination, nitrogen and phosphorus without needing to pump in compressed air. This reduces the power consumption by up to 90% compared to traditional activated sludge treatments. Crucially, the greater efficiency of the process means it is the system with the lowest total cost of ownership (capital + operating cost) able to meet the Chinese class 1A wastewater standard.
Based on the same core MABR technology, SUBRE is designed to be retrofitted into existing wastewater treatment plants to improve both performance and capacity. Rising effluent loads mean that legacy wastewater treatment plants in many areas struggle to meet ever more stringent standards. This product is at an early stage (Fluence has just one customer currently) but it could be a significant growth driver.
The competitive landscape in decentralised solutions is still evolving. Players such as GE Water (now part of Suez), Clearford, Azud, EEC and Newterra all offer solutions but much of the activity has been in desalination so far. The market for decentralised wastewater treatment, where Fluence’s aerated approach appears to offer an efficiency advantage, is just emerging. Fluence’s ‘innovative and smart technology’ was recognised by Frost and Sullivan in 2018.
We see these standardised products giving Fluence a technology-driven competitive advantage in this rapidly growing market. Evidence for the size of the opportunity should emerge over the next six months. We forecast revenue from these products growing to $32.5m in FY18e (mostly H2 weighted) from $16m in FY17. Critically, this growth should be gross margin accretive and, unlike traditional heavily customised water treatment solutions, require little incremental operating costs. We forecast revenues from standardised products rising to $106m by 2020.
The China opportunity
The Chinese market represents a major opportunity for Fluence’s standardised products in our view. Annual spending on water supply and wastewater infrastructure is estimated to be $50bn a year, 20% of the global market, and growing at 7% annually. Fluence’s ability to make inroads here is arguably the biggest single driver of its long-term financial performance in our view.
In 2015 the government published the Water Ten Plan, its first attempt to tackle China’s various water issues (drought, over-abstraction, access to clean drinking water), in a co-ordinated way. Tackling the river pollution was seen as top of the priority list. Over 28% of Chinese rivers were classified as ‘unfit for human contact’ (grade IV or worse). Aside from the environmental impact, this pollution is seen as a pressing public health issue, causing disease and reducing the productivity of agriculture. The ambitions of the Water Ten Plan were incorporated in the national government’s 13th five-year plan (FYP) 2016–2020 (13FYP), which aims to stabilise the proportion of rivers that are classified as category at IV and above at 30%.
Treatment of domestic wastewater in upstream rural areas is seen as the biggest cause of the problem. Over the past two decades China has invested heavily in wastewater treatment, particularly for its urban population and, at 86%, a relatively high proportion of its population now has some form of treatment. The problem is that, in a country of 1.3 billion people, the remaining 14% of the population represents 180 million people still sending raw sewage into the rivers. Government statistics indicate that in 2015 only 25% of towns and just 7% of ‘townships’ had wastewater treatment facilities. The 13FYP states the intention to raise treatment rates in towns to 85% and standards are also expected to rise (see Exhibit 4). Currently most rural treatment centres have adopted Class 2. Fluence states that the proportion of rural wastewater adopting the Class 1A standard must rise from 10% to 70% by 2020. To achieve this, overall national government spending on wastewater treatment is rising by 30% and spending on treatment centres by 36%. This investment will be backed up by stricter permits, more monitoring and greater enforcement through fines.
Addressing rural wastewater treatment is precisely where Fluence’s Aspiral product is focused. The average capacity of wastewater treatment plants built in China during the previous 5YP was c 50,000m3 per day. The average volume of wastewater generated by a township is just 197m3 per day. The average Aspiral container has capacity of 150m3 per day and can scale to meet volumes ranging from 20m3–5,000m3. Furthermore, Fluence believes Aspiral is the lowest-cost containerised product able to reach China’s 1A effluent standard once running costs are considered. Requiring little or no maintenance and consuming substantially less energy than alternative solutions lowers running costs and improves the investment case further. As the electricity saved reduces both the consumption of water and fossil fuels, Aspiral also has wider environmental benefits. Priced at $50,000–70,000 per container, the implied capital cost of adding capacity with Aspiral is c $400 per m3 per day. The estimated cost of adding capacity during the 12FYP (calculated by dividing the increase in treatment capacity over the FYP by the capital budget allocated to wastewater treatment over the same time) suggests a price per m3 per day of 10 times greater than implied by Aspiral. Traditional wastewater solutions cannot provide small, scalable solutions economically.
Quantifying this opportunity precisely is difficult. National government spending specifically allocated to new wastewater treatment plants in the 135YP is $23bn ($4.5bn annually), but this spending probably only accounts for a third of the total budget (the majority is devolved to regional governments). Of this c $15bn budget, not all is allocated to rural areas. Assessing from the bottom up based on the stated coverage targets and using an estimate of capital cost per capacity of $400 per m3 per day (Aspiral’s selling price) suggests the total upgrade opportunity for Fluence is $4.7bn, or just under $1.0bn annually. Either way, it appears a huge opportunity for Fluence.
Exhibit 6: Bottom-up estimate of the size of the China opportunity based on 13FYP goals
2015 |
Planned (2020) |
Incremental |
|
WWTP (Wastewater treatment plants) |
|||
- Towns |
4,512 |
15,171 |
10,659 |
- Townships |
815 |
8,035 |
7,220 |
- Total |
5,327 |
23,205 |
17,878 |
Coverage (%) |
|||
- Towns |
25.3 |
85.0 |
59.7 |
- Townships |
7.1 |
70.0 |
62.9 |
- Total |
18.2 |
79.1 |
61.0 |
Average Capacity per WWTP (m3/day) |
|||
- Towns |
977 |
977 |
977 |
- Townships |
197 |
197 |
197 |
- Total |
858 |
707 |
662 |
Capacity cost ($ per m3/day) |
400 |
||
Total investment required ($m) |
4,735 |
Source: Edison Investment Research estimates, China’s urban statistical yearbook
Delivering on this opportunity will take time and require good execution. Securing funding for rural projects is not straightforward (even with national government support) and decision making is typically devolved to regional and local levels where relationships can trump objective consideration of the price/performance specifications. Thus establishing strong relationships with regional partners will be key. Fluence has 22 distribution agreements covering 14 provinces (see Exhibit 7) and expects to increase this further over the next 12 months. It has announced 10 commercial contracts so far (three signed in Q2) and has established a production site in Changzhou to remove any potential production bottlenecks. We expect low single-digit millions in revenue from China in FY18e and growth is unlikely to be visible in the group revenue line even in FY19e. Nevertheless, orders should ramp steadily and by FY20e we see China accounting for over half our Aspiral forecast (ie $18m or 300 units). It could be substantially higher. The Changzhou facility has capacity to produce c $100m of Aspiral units annually.
|
Exhibit 7: Coverage and progress in China so far |
|
|
Source: Company data |
Valuation: A 28% discount awaiting delivery
At A$0.42, and assuming US$38m of net cash, Fluence’s current share price implies a US$93m EV, 7.8x FY20e EV/EBITDA and 13.8x adjusted EPS. Representing an average discount to peer group multiples of 23%, this valuation reflects neither the size of its market opportunity nor the value of its technology, in our view. A DCF model with a 10% WACC generates this valuation with a 2020–30 growth rate of 6% and an EBITDA margin of 7%. Fluence’s nearest peers have a +2FY growth rate of 6% and an EBITDA margin above 15%.
|
Exhibit 8: Peer group EV/EBITDA multiples |
Exhibit 9: Peer group P/E rating |
|
|
|
Source: Company data, Edison Investment Research estimates |
|
Exhibit 8: Peer group EV/EBITDA multiples |
|
|
Source: Company data, Edison Investment Research estimates |
|
Exhibit 9: Peer group P/E rating |
|
|
Source: Company data, Edison Investment Research estimates |
Applying a sector average EV/EBITDA multiple (10.9x) suggests an enterprise valuation of US$129m or A$0.54 per share, 28% upside to the current share price. To generate this per-share valuation, a DCF model (again with a 10% WACC) has to assume a long-term growth rate of 6% and EBITDA margins of 9%, still significantly below peers. Its more mature valuation peers (see Exhibit 8 and 9) are expected to grow 6% and generate EBITDA margins of 17% in 2019. Applying these into our 10-year DCF suggests a value of A$0.85, more than double the current price. There are few recent, directly comparable M&A transactions to benchmark Fluence’s valuation against, but GE Water Technologies sale to Suez and Xylem’s acquisition of Sensus completed at an average of 2.0x EV/LTM Sales multiple. Applying this to Fluence’s FY18e would imply a valuation of US$214m or A$0.80 per share, 91% upside.
In our view, the current discount suggests the market is sceptical about delivery. As discussed below, the trajectory of the ramp up in standardised products and timing of revenue recognition, particularly on large contracts, is hard to predict. Given the company missed its 2017 guidance by a wide margin, some scepticism is perhaps understandable. Only modest changes in assumptions are needed to halve our FY20e EBITDA and raise concerns about funding. In our view, delivery against its FY18 guidance (US$105–115m) could act as a catalyst for a re-rating of the shares.
Financials
We expect Fluence to deliver substantial growth over the next two years, roughly doubling revenue from FY18e levels to generate $194m in FY20e. This growth should be accompanied by an improvement in mix that lifts gross margins (5.9pp from 23.0% in FY18e to 28.9% in FY20e) and levers a largely static operating cost base. We expect Fluence to be profitable in Q419 and sustainably profitable and cash generative by H220.
Growth assumptions
Exhibit 10 depicts pro forma revenue generation (ie Emefcy plus the sales of RWL before the merger). The principal assumptions underpinning our forecasts are:
■
Custom solutions
•
Flat ‘base’ business. RWL’s historical growth between FY15 and FY17 was negligible. We assume this trend continues with FY20e broadly unchanged from FY17 levels.
•
San Quintin ramping up from Q318e. We assume $13m of (mostly low margin) revenue in FY18, rising to $33m in FY19e. We forecast $10m of service revenues in FY20e.
•
A new large EPC contract in FY20e. We assume $25m from another EPC contract by FY20e largely offsetting declines in San Quintin and PVDSA revenue. The $100m deal under negotiation is not explicitly factored in.
■
Standard products
•
NIROBOX revenues growing to $60m by FY20e. Fluence sold 25 units in FY17 and expects to sell 40 in FY18. We assume 100 units in FY20e with a $0.6m ASP (average selling price). Assuming 25% gross margin, NIROBOX growth modestly improves the mix.
•
Aspiral sales of $36m by FY20e. We expect growth in China (see page 8) to lift sales of Aspiral containers to 600 by FY20e.
•
SUBRE sales of $10m in FY20e. The company sold its first $2.5m unit in FY18e. We conservatively forecast four sales in FY20e.
|
Exhibit 10: Pro forma revenue and EBITDA progression |
Exhibit 11: The H218e step-up and break-even points |
|
|
|
Source: Company data, Edison Investment Research estimates |
Source: Company data, Edison Investment Research estimates. Note: Confidence bars show break-even with 22% and 25% GM (high and low respectively). |
|
Exhibit 10: Pro forma revenue and EBITDA progression |
|
|
Source: Company data, Edison Investment Research estimates |
|
Exhibit 11: The H218e step-up and break-even points |
|
|
Source: Company data, Edison Investment Research estimates. Note: Confidence bars show break-even with 22% and 25% GM (high and low respectively). |
Explaining the increase
The revenue step-up implied by our forecasts looks daunting compared to historical performance and investors may be sceptical following a miss versus management guidance in FY17. However, much of it is premised on the increase expected in H218e on which management should have at least some visibility. The company confirmed FY18e guidance of $105–115m in August, which implies H2 FY18e revenue of $77m at the midpoint. The order backlog of $84m at H118 implies a book to NTM (next 12 months) bill ratio of 0.6x. Of this order book, $49m is expected to be recognised in H2 FY18e (including $13m from San Quintin), implying 0.6x coverage; Fluence has to sign and recognise an additional $28m. If Fluence achieves its guidance, it would only need to grow its H2 FY18e revenue run-rate by a further 12% and 20% to reach EBITDA and FCF break even respectively. Our FY19e revenue forecast is similar to the annual run-rate implied by our H218e forecast.
The impact of growth on the margins and cash flow
The growth in standardised products should drive a 5.9pp rise in margins from 24.1% in FY18e to 28.9% in FY20e. The company indicates SUBRE and Aspiral gross margins are 40–50%, more than double that of a large project revenue. We also forecast minimal growth in operating costs between FY18e and FY20e as a major benefit of standardised products is that growth should require little additional headcount to support. Additionally, following the merger there should be scope for operational savings to offset any need to grow headcount. In this scenario, we expect Fluence to reach EBITDA break even in FY19e and to record a 9% margin in FY20e. The company should have enough cash to reach FCF break-even but we see cash balances troughing at $14m in Q220e, marginally below the $15m level which we see as a comfortable level of reserves.
Sensitivities
The combination of large lumpy contracts and growth in standard products (NIROBOX, Aspiral and SUBRE) at an early stage of commercial deployment makes accurately forecasting Fluence’s growth trajectory tough. Consequently, we model the impact of variation to our base case revenue assumptions on margins and cash generation. The parameters used to model an upside and downside cases are shown in Exhibit 12.
Exhibit 12: Main scenario parameters
|
|
Downside |
Base case |
Upside |
||||||
$m |
FY18e |
FY19e |
FY20e |
FY18e |
FY19e |
FY20e |
FY18e |
FY19e |
FY20e |
San Quintin revenue |
5 |
20 |
20 |
13 |
33 |
10 |
13 |
33 |
10 |
Ethiopia revenue |
0 |
0 |
0 |
0 |
0 |
0 |
10 |
30 |
30 |
Other EPC revenue |
0 |
0 |
0 |
0 |
0 |
25 |
0 |
0 |
25 |
Aspiral multiplier* (%) |
0 |
(10) |
(20) |
0 |
0 |
0 |
0 |
5 |
10 |
Source: Edison Investment Research. Note: *Percentage increase/decrease applied to base case Aspiral forecasts.
Generally, Fluence has low operational gearing (a function of modest gross margins) but, as it is only marginally profitable in the forecast period, even small revenue changes have a big difference on absolute profits and cash generation. In our downside case, the San Quintin project is delayed, no additional EPC is signed in FY20e and the take-up of Aspiral is slower than expected. In this scenario FY20e EBITDA halves, adjusted EPS is only marginally positive ($0.01) and Fluence is likely to require additional capital before Q220 to reach FCF break even. We estimate that it will need $15m to maintain a minimum cash balance of $15m.
|
Exhibit 13: Impact of downside and upside scenarios on revenue and EBITDA |
Exhibit 14: Impact of downside and upside scenarios on cash balance |
|
|
|
Source: Company data, Edison Investment Research estimates |
|
Exhibit 13: Impact of downside and upside scenarios on revenue and EBITDA |
|
|
Source: Company data, Edison Investment Research estimates |
|
Exhibit 14: Impact of downside and upside scenarios on cash balance |
|
|
Source: Company data, Edison Investment Research estimates |
The upside case models an additional large EPC contract plus an accelerated uptake of Aspiral. In this scenario, FY20e base case EBITDA rises to $19m and EPS to $0.04. The cash balance stays above the $15m minimum.
Exhibit 15: Financial summary
$m |
2016 |
2017 |
2018e |
2019e |
2020e |
||
Year-end 31 December |
IFRS |
IFRS |
IFRS |
IFRS |
IFRS |
||
INCOME STATEMENT |
|||||||
Revenue |
|
|
0.8 |
33.2 |
107.0 |
154.0 |
194.4 |
Cost of Sales |
(2.0) |
(27.2) |
(82.4) |
(113.6) |
(138.1) |
||
Gross Profit |
(1.2) |
6.0 |
24.6 |
40.4 |
56.3 |
||
EBITDA |
|
|
(8.8) |
(23.6) |
(13.8) |
(2.0) |
11.9 |
Operating Profit (before amort. and except). |
|
(8.1) |
(24.3) |
(16.1) |
(4.6) |
9.3 |
|
Amortisation of acquired intangibles |
0.0 |
0.0 |
0.0 |
0.0 |
0.0 |
||
Exceptionals |
0.1 |
(1.2) |
(43.1) |
0.0 |
0.0 |
||
Share-based payments |
0.0 |
0.0 |
0.0 |
0.0 |
0.0 |
||
Reported operating profit |
(9.1) |
(25.4) |
(59.2) |
(4.6) |
9.3 |
||
Net Interest |
(0.0) |
2.6 |
3.5 |
0.5 |
0.3 |
||
Joint ventures & associates (post tax) |
0.0 |
0.0 |
0.0 |
0.0 |
0.0 |
||
Exceptionals |
0.0 |
0.0 |
0.0 |
0.0 |
0.0 |
||
Profit Before Tax (norm) |
|
|
(9.1) |
(21.7) |
(12.6) |
(4.1) |
9.6 |
Profit Before Tax (reported) |
|
|
(9.1) |
(22.9) |
(55.7) |
(4.1) |
9.6 |
Reported tax |
0.0 |
(0.7) |
0.3 |
0.0 |
0.0 |
||
Profit After Tax (norm) |
(9.1) |
(22.4) |
(12.3) |
(4.1) |
9.6 |
||
Profit After Tax (reported) |
(9.1) |
(23.6) |
(55.4) |
(4.1) |
9.6 |
||
Minority interests |
0 |
0 |
0 |
0 |
0 |
||
Discontinued operations |
0 |
0 |
0 |
0 |
0 |
||
Net income (normalised) |
(9.1) |
(22.4) |
(12.3) |
(4.1) |
9.6 |
||
Net income (reported) |
(9.1) |
(23.6) |
(55.4) |
(4.1) |
9.6 |
||
Average Number of Shares Outstanding (m) |
214 |
320 |
425 |
435 |
435 |
||
EPS - basic normalised ($) |
|
|
(0.04) |
(0.07) |
(0.03) |
(0.01) |
0.02 |
EPS - diluted normalised ($) |
|
|
(0.04) |
(0.07) |
(0.03) |
(0.01) |
0.02 |
EPS - basic reported ($) |
|
|
(0.04) |
(0.07) |
(0.13) |
(0.01) |
0.02 |
Dividend per share ($) |
0 |
0 |
0 |
0 |
0 |
||
Revenue growth (%) |
4.7 |
(10.4) |
39.5 |
36.1 |
22.7 |
||
Gross Margin (%) |
-147.5 |
18.0 |
23.0 |
26.2 |
28.9 |
||
EBITDA Margin (%) |
(1,089.3) |
(71.1) |
(12.9) |
(1.3) |
6.1 |
||
Normalised Operating Margin |
(1,126.1) |
(73.1) |
(15.1) |
(3.0) |
4.8 |
||
BALANCE SHEET |
|||||||
Fixed Assets |
|
|
3.2 |
72.7 |
25.4 |
26.8 |
28.2 |
Intangible Assets |
2.1 |
60.2 |
5.8 |
5.8 |
5.8 |
||
Tangible Assets |
1.0 |
7.1 |
14.5 |
15.9 |
17.3 |
||
Investments & other |
0.1 |
5.5 |
5.0 |
5.0 |
5.0 |
||
Current Assets |
|
|
24.4 |
131.9 |
117.1 |
117.1 |
141.8 |
Stocks |
0.5 |
18.5 |
20.3 |
24.7 |
31.4 |
||
Debtors |
0.7 |
26.7 |
44.7 |
56.8 |
75.4 |
||
Cash & cash equivalents |
22.9 |
75.2 |
40.7 |
24.1 |
23.5 |
||
Other |
0.3 |
11.5 |
11.4 |
11.4 |
11.4 |
||
Current Liabilities |
|
|
(2.5) |
(95.9) |
(93.3) |
(98.8) |
(115.4) |
Creditors |
(1.4) |
(27.8) |
(52.8) |
(54.4) |
(62.9) |
||
Tax and social security |
0.0 |
(0.1) |
(0.1) |
(0.1) |
(0.1) |
||
Short term borrowings |
0.0 |
(1.1) |
(1.1) |
(1.1) |
(1.8) |
||
Other |
(1.1) |
(66.9) |
(39.3) |
(43.3) |
(50.6) |
||
Long Term Liabilities |
|
|
(1.0) |
(5.1) |
(11.0) |
(11.0) |
(11.0) |
Long term borrowings |
0.0 |
0.0 |
0.0 |
0.0 |
0.0 |
||
Other long term liabilities |
(1.0) |
(5.1) |
(11.0) |
(11.0) |
(11.0) |
||
Net Assets |
|
|
24.1 |
103.6 |
38.1 |
34.0 |
43.6 |
Minority interests |
0.0 |
0.2 |
0.1 |
0.1 |
0.1 |
||
Shareholders' equity |
|
|
24.1 |
103.8 |
38.2 |
34.1 |
43.7 |
CASH FLOW |
|||||||
Op Cash Flow before WC and tax |
(8.8) |
(23.6) |
(13.8) |
(2.0) |
11.9 |
||
Working capital |
1.7 |
(4.8) |
(13.6) |
(10.2) |
(8.7) |
||
Exceptional & other |
0.0 |
0.2 |
0.1 |
0.0 |
0.0 |
||
Tax |
0.0 |
(0.9) |
(0.4) |
(0.4) |
(0.4) |
||
Net operating cash flow |
|
|
(7.2) |
(29.0) |
(27.6) |
(12.6) |
2.8 |
Capex |
(0.4) |
(3.7) |
(4.1) |
(4.0) |
(4.0) |
||
Acquisitions/disposals |
(1.0) |
50.6 |
(1.8) |
0.0 |
0.0 |
||
Net interest |
0.0 |
0.5 |
2.4 |
0.1 |
(0.1) |
||
Equity financing |
22.9 |
31.3 |
0.0 |
0.0 |
0.0 |
||
Dividends |
0.0 |
0.0 |
0.0 |
0.0 |
0.0 |
||
Other |
(0.2) |
1.1 |
(0.7) |
0.0 |
0.0 |
||
Net Cash Flow |
14.2 |
50.8 |
(31.8) |
(16.5) |
(1.3) |
||
Opening net debt/(cash) |
|
|
(8.5) |
(22.9) |
(74.0) |
(39.5) |
(23.0) |
FX |
0.2 |
2.1 |
(2.7) |
0.0 |
0.0 |
||
Other non-cash movements |
0.0 |
(1.8) |
0.0 |
0.0 |
0.0 |
||
Closing net debt/(cash) |
|
|
(22.9) |
(74.0) |
(39.5) |
(23.0) |
(21.7) |
Source: Company accounts, Edison Investment Research
|
|||||||||||||||||||||||||||||||||||||||||||||||
|
|
With the completion of the up-listing to the Nasdaq Stockholm main market and the successful gross SEK110m capital raise, Nuevolution continues to strengthen both its investor base and financial position. Amgen’s opt-in on the first programme in its multi-target collaboration and the identification of much sought-after small-molecule IL-17A inhibitors continue to validate Nuevolution’s Chemetics technology. Its transition to a clinical asset-focused company continues with the Almirall RORγt inhibitor programme likely to enter the clinic in 2019 and additional internal programmes (RORγt and BET-BD1) nearing clinical readiness. In addition to current partnerships, the company forecasts that a new deal is possible by year end. We value Nuevolution at SEK1,127m or SEK22.8/share.