Last close As at 05/08/2026
—
— 0.00 (0.00%)
Market capitalisation
—
Research: Financials
Through innovative securitisations, Attica has de-risked its portfolio, reducing net impaired loans from over 250% to just 79% of net tangible assets incorporating the gain on the Metexelixis transaction. This will also lift the common equity Tier 1 (CET1) ratio of 12.8% to 14.3%, representing significant headroom over regulatory requirements. Management will now move on to the next stage of recovery, shifting the group’s focus to the small and medium-sized enterprise (SME) market and raising profitability to improve the price/net tangible asset ratio, estimated at just 0.14x.
Written by
Attica Bank |
Innovative approach to de-risking |
Initiation of coverage |
Banks |
5 November 2018 |
Share price performance
Business description
Next event
Analysts
Attica Bank is a research client of Edison Investment Research Limited |
|||||||||||||||||||||||||||||||||||||||||||||||
Through innovative securitisations, Attica has de-risked its portfolio, reducing net impaired loans from over 250% to just 79% of net tangible assets incorporating the gain on the Metexelixis transaction. This will also lift the common equity Tier 1 (CET1) ratio of 12.8% to 14.3%, representing significant headroom over regulatory requirements. Management will now move on to the next stage of recovery, shifting the group’s focus to the small and medium-sized enterprise (SME) market and raising profitability to improve the price/net tangible asset ratio, estimated at just 0.14x.
Year end |
PBT |
Underlying PBT* (€m) |
EPS |
NTA per share (€) |
P/E |
Price/NTA |
12/17 |
1.13 |
(67.91) |
N/A |
0.21 |
N/A |
0.673 |
12/18e |
3.12 |
(20.97) |
0.00 |
1.04 |
57.7 |
0.13 |
12/19e |
4.02 |
14.02 |
0.00 |
1.05 |
36.7 |
0.13 |
12/20e |
32.92 |
32.92 |
0.05 |
1.11 |
2.9 |
0.13 |
Note: *Excludes gain from securitisation, staff retirement compensation and associates.
Balance sheet clean-up
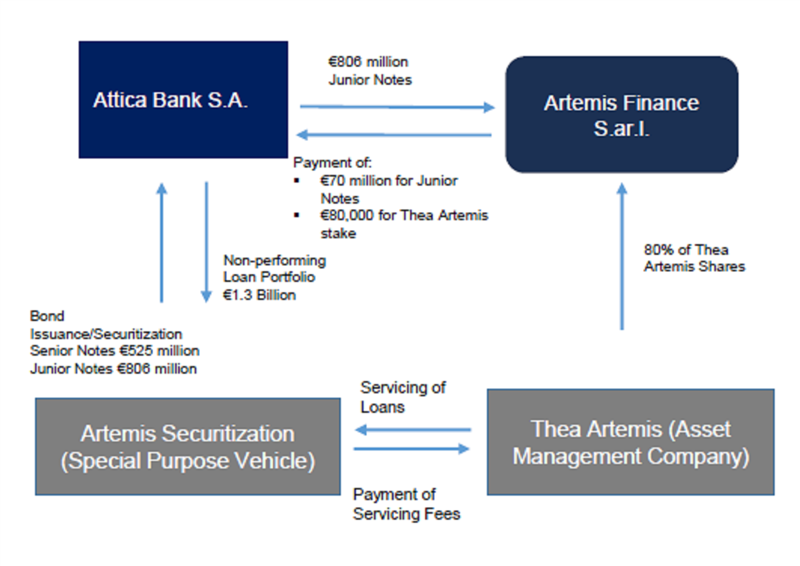
Attica has significantly de-risked its portfolio with two securitisations so that impaired loans have reduced from €2.4bn (end-2016) to c €590m (or c €370m net of provisions. Attica transferred some €2bn of non-performing loans (NPLs) into two special purpose vehicles (SPVs), which then issued junior and senior notes to Attica. Subsequently, Aldridge EDC Speciality Finance and PIMCO, the distressed debt managers, paid a premium to acquire the junior notes. Attica is still at risk on the senior notes, but is protected by over-collateralisation and its position in the debt hierarchy. Although its capital raise in Q218 was only 44.9% subscribed, we estimate that the capital gains on the most recent securitisation deal will allow the bank’s CET1 ratio to reach 14.3%, or 11.2% including full phasing of IFRS 9.
Restructure and refocus
Attica is Greece’s fifth-largest bank, with assets of €3.45bn and 55 branches centred around Athens. It offers a full range of products to both retail and business, but intends to focus on the latter to exploit attractive margins and an existing 3% market share. Rebuilding profitability will be achieved through: voluntary retirement schemes; pricing leverage as the major Greek banks review their product offerings; and normalisation of impairments facilitated by reduced exposure to the collateral underpinning impaired loans and an economy anticipated to grow 2% pa with declining unemployment. We expect that, by 2020, Attica will be close to achieving a 5% return on tangible equity.
Good news not priced: PTBV 0.14x
By 2020, Attica’s profitability will be comparable with the major banks. We estimate that the current valuation is considerably lower, with the share price to net tangible book value (PTBV) ratio at 0.14x. This compares with a 0.23–0.26x range for most other Greek peers and would suggest a fair value for Attica of €0.26 per share or around double the current share price. Additional upside could come from Greece’s economic recovery, reducing the excessive risk premium attached to bank equity.
Investment summary
The fifth-largest bank in Greece
With assets of €3.45bn and 55 branches centred around Athens, Attica is dwarfed by Greece’s big four systemic banks. Although primarily an SME bank, it offers a full range of banking and deposit-taking services for individuals and businesses. Corporate and business banking provides over 90% of revenues, while the small retail segment is unprofitable even before allowing for impairments. In terms of products, Attica has a 3% share of business lending, but market shares of consumer products are generally below 1%.
A new management team, in place since 2016, has completed an extensive reorganisation plan and developed an innovative approach to management of impaired loans.
Repairing the balance sheet
Innovative de-risking. In the two successful securitisations (Artemis and Metexelixis), about €2,031m of impaired loans was placed in SPVs, which then issued both senior and junior notes. This represented over 80% of the then existing NPLs and more than half of the gross loan book. The preparedness of Aldridge and PIMCO to pay a premium (€117m over written-down value) for the junior notes indicates that the €868m of senior notes, which have first claim on the liquidation proceeds of the impaired loans, should stand an excellent chance of being repaid in full. Part of the success of the securitisation process stems from the conservative provisioning that Attica put in place in earlier years. Coverage of impaired loans, by both the LLA and collateral is reported at 105.3% for H118.The securitisation transactions are irrevocable, which means that the loans will not come back on to Attica’s balance sheet. On the flip side, it is conceivable that Aldridge/PIMCO will realise collateral quicker than expected, in which case the senior note could be repaid to Attica before its redemption date.
Capital now looks good. The share issue in Q218 may have only raised €88.9m (the bank had been targeting double that figure), but the capital gains from the second securitisation will make up much of the shortfall. Supporting management’s view that further issuance is not necessary, pro forma CET1 stands at 14.3% and, even allowing for the full phasing of IFRS 9, will be no lower than 11.2%, two percentage points of headroom over the regulatory minimum.
To date, the securitisations have not provided any benefit to Attica’s capital position. However, this will change once the senior notes are repaid; the reduction in RWAs would be worth five percentage points to the CET1 ratio. In theory, the senior notes have 10-year maturity but could be redeemed before that if realisation of the SPV loans proceeds at a faster pace than anticipated.
The road to profitability
At the headline level, we expect Attica to be marginally profitable in 2018, primarily because of the gain on the Metexelixis transaction, which disguises a material loss due to the extended restructuring of the bank. However, this position should improve over the next two years.
■
Through the securitisation process, Attica has exchanged €2,031m of impaired loans for €868m of 10-year senior notes with a 3% coupon. The income on the senior notes is likely to exceed the interest income that would have accrued from the impaired portfolio, which should give some impetus to net interest income.
■
Attica has some pricing leverage on the liability side of its balance sheet and should also benefit as other Greek banks seek to repair profitability by pushing up asset yields, exploiting a healthy differential between the pricing of new and existing lending. For example, the rate on new SME lending is reported at 1% higher than on the existing stock.
■
Following on from a voluntary retirement scheme in 2016, a second such scheme was launched this year and we believe a third scheme will be implemented in 2019 to facilitate scaling back the retail bank. The cost/income ratio, which was 78% last year, is expected to decline to the mid-50s by 2020.
■
Impairments should diminish, reflecting the impact of the two securitisations, which have reduced exposure to the collateral underpinning impaired loans. In addition, Greece’s economic recovery (Reuters consensus anticipated 2% pa GDP growth 2018–20 and a continued decline in unemployment) will help on all fronts, slowing the rate of NPL formation, supporting the value of real estate collateral and generating new lending opportunities.
As a result of these measures, we estimate Attica should be capable of achieving close to a 5% return on net tangible equity by 2020. This is in line with the consensus estimates for the major Greek banks.
Progress not in the shares
In normal circumstances, a 5% ROTE would not be sufficient to make Attica an exciting investment opportunity. However, the current valuation indicates that investors do not believe that Attica will be able to achieve even this modest level of profitability. We estimate that, after incorporating the gain on the Metexelixis transaction, the shares are trading at a price to tangible book value of only 0.14x. Other Greek banks, which are expected to have similar levels of profitability in 2020, are trading at 0.23–0.26x.This comparison suggests that a PTBV of 0.25x would be a fair valuation for Attica (equivalent to €0.26 per share), which is almost double the current price.
The real upside to Attica’s shares will come from investors becoming more comfortable with Greece’s economic recovery, easing perceptions of risk in the banking system. According to our calculations, the implied cost of equity for Greek banks is around 25%. Compared to Greece’s 10-year sovereign rate below 5%, there is clearly scope for this risk premium to decline, boosting valuations significantly, including that of Attica.
The negative points against Attica include its smaller size, its challenging restructuring, continued use of emergency liquidity assistance (ELA) and failure to raise the targeted quantum of equity in the last capital raise. However, liquidity assistance is declining, the capital position has 2pp headroom over regulatory requirements after allowing for the full phasing of IFRS 9, while in the longer term, Attica’s size (and valuation) might leave it an acquisition target.
Once assets included in the Metexelixis securitisation are deconsolidated from Attica’s balance sheet (scheduled for Q318), then the unprovided element of impaired loans (IFRS 9 Stage 3) will represent 79% of net tangible assets or 63% allowing for surplus capital. This is around half the level of peer group banks.
If the bank delivers on the cost-cutting and the market better understands the extent of the bank’s restructure and recapitalisation, the shares should better reflect its fair value.
Company description: Niche business bank
Attica Bank was established in 1925 and listed on the Athens Stock Exchange in 1964. Initially, Emporiki Bank acquired 70% but this relationship ended in 1997 and subsequently Attica has been supported by major pension funds. Following Greece’s financial crisis, share capital increases were undertaken in 2013, 2015 and 2018, with exclusively private sector participation and no reliance on the Hellenic Financial Stability Fund. The take-up of the most recent issue was only 44.9% subscribed, raising €88.9m. Following the share capital increase, EFKA holds 66.9% of Attica’s equity. The Fund of Civil Engineers and Public Works Contractors (TMEDE) holds 11.8% and the Fund for Mutual Assistance of the Employees of Ioniki-Laiki and Other Banks (TAPILT-AT) holds 2.8%. Under the provisions of a government ordinance, EFKA’s voting rights are restricted to 33%, with the remaining 13.2% exercised by the Hellenic Financial Stability Fund.
Attica offers a full range of banking and investment products and services for individuals, SMEs and large corporates. However, in terms of its own balance sheet and revenues, business banking for SMEs predominates. As at mid-2018, SMEs and small business lending represented 42.3% of the gross lending and large corporates a further 34.3%. Ancillary services include foreign exchange, documentary credits, payments, leasing and factoring. Attica’s treasury offers brokerage, custodian and wealth management services.
The retail bank (23% of lending) provides personal customers with specialist investment and bancassurance products alongside traditional mortgage, credit cards and deposit accounts.
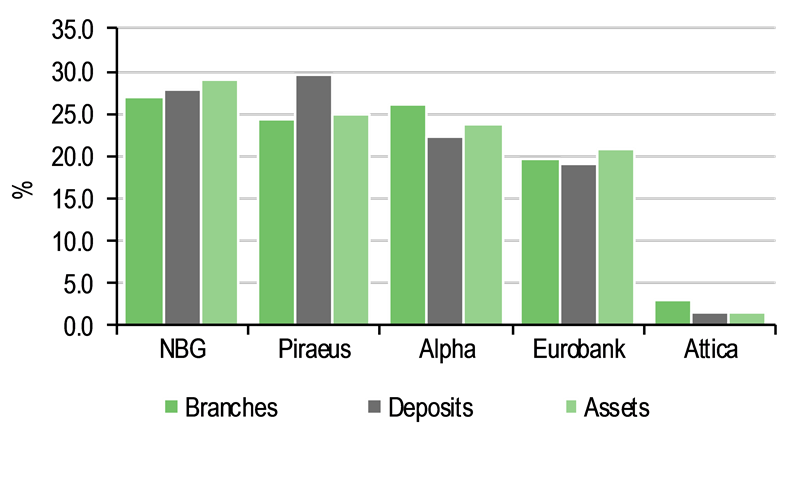
Attica is materially smaller than the four major Greek banks, with market shares of lending and deposits at 1.5% and 1.6% respectively, and a slightly larger share of branches (Exhibit 1). In terms of products, Attica has a 2% share of business lending, but market shares of consumer products are generally below 1% (Exhibit 2). Attica claims 32,000 corporate relationships. In this segment, the principal industries supported are construction and real estate, wholesale and retail distribution, and energy. The bank has 0.7m personal customers and has been gaining new customers at the rate of 1–2% pa in recent years. Although Attica has been improving its electronic distribution channels, use of debit cards and e-banking remains relatively modest).
|
Exhibit 1: Greek banking system market shares |
Exhibit 2: Attica’s market share by product |
|
|
|
Source: Company data H118 |
|
Exhibit 1: Greek banking system market shares |
|
|
Source: Company data H118 |
|
Exhibit 2: Attica’s market share by product |
|
|
Source: Company data H118 |
New team drives strategy
A new management team initiated an extensive transformation programme in 2016. This amounted to a complete overhaul of the management information systems and internal methodologies supporting key functions, principally: information technology, credit risk management, budgeting, and the pricing of corporate loans. Implementation of the programme was completed at the end of 2017.
Management believes that the strategy for managing all categories of risk is now in line with best international practices, current legislation and the supervisory framework. It is kept under constant review by the risk management committee of the board of directors.
For 2018, the main objective is the effective management of impaired loans. Attica now has a clear and realistic strategy for de-risking its portfolio through co-operation with specialised external partners. Longer term, Attica will seek to refocus as a corporate and commercial bank servicing the SME market. This reflects the current distribution of assets and revenues. Retail bank revenues are comparable to operating costs indicative of a structural profitability problem. It is probable that refocusing on the SME market entails de-emphasising the retail offering.
Management
The board of directors is collectively responsible for setting strategic targets, supervising senior executives and exercising effective control over the bank’s operations. The board consists of 12 members: three executive officers, eight non-executives and one government appointee.
Mr Theodoros N Pantalakis has been the chief executive of Attica Bank since September 2016. Previously, he served as deputy chief executive officer of Piraeus Bank, and chairman and governor of Agricultural Bank of Greece. Mr Athanassios Tsadaris is joint deputy chief executive and serves as director of the treasury and markets division. Mr Ioannis Tsakirakis is also deputy chief executive. He has 28 years’ banking industry experience and currently serves as head of credit restructuring.
Sensitivities
The main risks derive from the macroeconomic and political environment in Greece. Principal concerns are the high unemployment rate, restricted liquidity in the banking system and uncertainty regarding the implementation of reforms agreed as part of the Third Economic Adjustment Programme. Crystallisation of these risks would have a negative impact on the profitability, liquidity and capital adequacy of all Greek banks. Quantification of these risks is best expressed by the10-year government bond yield at 4.6%. Attica has limited exposure to government bonds and public sector lending, which in aggregate amount to 9% of net tangible assets.
Despite the above, credit risk appears subdued. The major Greek banks are reporting negative non-performing exposure (NPE) formation, which appears to reflect positive GDP growth and declining unemployment, although it remains just below 20%. Evidence of stability in residential and commercial property markets is a further positive and loan portfolios, having contracted for many years, have been purged of high-risk assets.
Deferred tax assets form a significant part of Attica’s regulatory capital (49% as at end-2017). Eligibility depends in part on management’s assessment of the recoverability of tax losses, but also the legislative framework, which converts deferred tax claims into deferred tax credits that are amortised over 20 years. Ending this special provision is unlikely, requiring changes to Greek and EU law, but would result in the group becoming inadequately capitalised.
Attica has undertaken securitisations, transferring €2bn of impaired loans to two SPVs. The first has already been deconsolidated from the group balance sheet and the second will be deconsolidated in Q3. However, the group remains at risk for the performance of the senior notes issued by the SPVs. For this reason, the securitisations have not resulted in a reduction of RWAs. However, once the senior notes are repaid from the proceeds of liquidating the SPVs, the RWAs will decline.
Healthier balance sheet
Loan book cleaned up
As previously indicated, repayment of the senior notes hinges on the value of collateral supporting impaired loans. The evidence regarding the quantum of this collateral comes from a table published with Attica’s 2017 full-year results (Exhibit 5), showing that the LLA represented 39.9% of impaired loans and collateral a further 59.8%, making cover 99.7% in total. By H118, this had risen to 105.3%.
The table also highlights the SME sector as the principal source of both impaired lending and collateral. This collateral is predominantly commercial real estate, but also includes financial assets and third-party guarantees. Outside the SME segment, the second-largest source of impairments is the mortgage portfolio (55% impaired), where collateral takes the form of residential property.
Aside from providing reassurance on the senior notes, Exhibit 5 also provides some comfort on Attica’s €1,916m residual portfolio following the Metexelixis deconsolidation, suggesting that residual impaired loans will also be fully covered by LLA and collateral.
Exhibit 5: Impaired loans, LLA, collateral and cover (end-2017)
€m |
Total |
Past due |
Impaired |
Impaired % |
LLA |
Cover (a) |
Collateral |
Cover (b) |
Mortgage |
444.3 |
68.3 |
243.4 |
54.8% |
69.9 |
28.7% |
185.3 |
104.9% |
Consumer |
82.2 |
7.3 |
59.8 |
72.8% |
32.6 |
54.5% |
26.9 |
99.4% |
Credit card |
32.9 |
0.9 |
14.5 |
44.2% |
12.9 |
89.1% |
0.8 |
94.8% |
Other |
60.7 |
0.6 |
29.4 |
48.4% |
21.8 |
74.4% |
7.5 |
100.0% |
Retail total |
620.0 |
77.1 |
347.1 |
56.0% |
137.3 |
39.6% |
220.6 |
103.1% |
Large |
836.1 |
19.5 |
140.3 |
16.8% |
57.5 |
41.0% |
78.3 |
96.8% |
SME |
1,178.9 |
102.4 |
701.8 |
59.5% |
279.8 |
39.9% |
411.6 |
98.5% |
Corporate total |
2,015.0 |
121.9 |
842.1 |
41.8% |
337.3 |
40.1% |
489.9 |
98.2% |
Greece public sector |
31.7 |
- |
- |
0.0% |
- |
|||
Total |
2,666.7 |
199.0 |
1,189.2 |
44.6% |
474.7 |
39.9% |
710.5 |
99.7% |
Source: Attica. Note: Cover (a) = LLA/impaired loans; Cover (b) = LLA + collateral/impaired loans.
Economic recovery should help
Two concerns often arise when assessing whether provisioning is adequate in these situations: (1) the realisation value of the collateral is lower the value Attica ascribes to it; and (2) how the loan book quality will evolve in the future. We believe that the economic recovery in Greece, which consensus expects to continue, should help on both fronts.
First, real estate prices, after consistent declines 2010–14, have stabilised in the past four years giving us some comfort regarding collateral values. Second, the impairment charge for H118 of €21.1m, although comparable to the prior year, was inflated by the write-down of off-balance sheet items, disguising a significant fall in credit impairments.
IFRS 9 impact
The introduction of IFRS 9 makes the interpretation of credit quality data more difficult. Under this accounting change, introduced at the start of this year, the LLA no longer reflects the difference between the nominal amount of an impaired loan and its recovery value, but rather an assessment of statistically expected losses for segments of the loan portfolio differentiated by changes in risk.
Exhibit 6: Impact of IFRS 9 on impairment allowance (€m)
IAS39 |
Q417 |
IFRS 9 |
Q417 |
Q218 |
||||||
Loans |
LLA |
Change credit risk |
Exp Loss |
Loans |
LLA |
Loans |
LLA |
|||
Performing |
1,279 |
Stage 1 |
No change |
12-month |
1,038 |
13 |
874 |
17 |
||
90days past due |
199 |
Stage 2 |
Deterioration |
Lifetime |
439 |
54 |
451 |
39 |
||
Impaired |
1,189 |
475 |
Stage 3 |
Impaired |
Lifetime |
1,189 |
505 |
1,291 |
523 |
|
Total |
2,667 |
475 |
Total |
2,667 |
573 |
2,616 |
579 |
|||
Impaired as % total |
45% |
Impaired as % total |
45% |
49% |
||||||
LLA/impaired |
40% |
LLA/impaired |
43% |
40% |
||||||
LLA/total loans |
18% |
LLA/total loans |
21% |
22% |
Source: Attica
The adoption of IFRS 9 necessitated €98m being added to the LLA to take account of 12-month expected losses on Stage 1 loans and lifetime expected losses on Stage 2 loans.
The extent to which the pick-up in impaired Stage 3 loans through Q218 reflects an underlying deterioration in credit quality or a change in methodology under the new accounting regime is unclear, but this question is somewhat academic as the Metexelixis transaction will take the volume of impaired loans down to around €591m (Exhibit 4).
Capital now looks better
Recapitalisation, securitisation and IFRS9 entailed significant changes to Attica’s capital position. At the end of 2017, Attica reported a CET1 ratio of 14.7%. The capital raise in Q218 added 2.7% but a regulatory change removing preference shares from CET1 removed most of this benefit. The loss reported for H118 and adoption of IFRS 9 were additional negatives, which brought mid-year CET1 down to 12.8%.The good news is that the Metexelixis transaction, where Attica expects the €47m gain on the disposal of the junior bond to add 1.5% to the ratio, gives a pro forma figure of 14.3%.
As a smaller bank, Attica’s capital requirements are set by the Bank of Greece, rather than the European Central Bank, but are determined along similar lines. The minimum CET1 requirement is probably around 8.375%, or 9% incorporating full phasing of the capital conservation buffer. On this basis, Attica’s 14.3% seems ample. However, along with its peers, Attica Bank is phasing in IFRS 9 over five years (5% in the first year, then 15%, 30%, 50% and 75%). The bank estimates the full impact of IFRS 9 at €110m or 3.3pp of CET1 – therefore, the fully adjusted figure would be only 11.2%.
Attica’s fully adjusted ratio is lower than the comparable ratios of major Greek banks, which are now reporting their ratios on this basis. This is balanced by the group’s regulatory requirement being somewhat lower since it is not a systemic bank. Its capital headroom of 2.2pp (ie 11.2–9.0) is comparable to the peer group (Exhibit 7). This may explain why, despite failing to raise the full €198m from the Q2 share issuance, management believes the capital position is adequate.
Aside from IFRS 9, Attica also takes advantage of Greek and European law converting relevant deferred tax assets into deferred tax credits, which are amortised over 20 years, rather than deducted from capital. Relevant deferred tax assets on Attica’s balance sheet stand at €216m or 6.4% of CET1. It is unlikely this favourable treatment will be reversed, as that would be a major disincentive preventing Greek banks from disposing of problem loans.
Apart from future asset growth and profitability, there will be two key influences on Attica’s capital position. On the positive side, since Attica is on the standardised approach to CRD IV the €868m of senior notes have 100% risk weighting. Hence, repayment would remove around one-quarter of the group’s RWAs, adding around 5% to CET1. However, it could be up to 10 years before Attica sees this benefit and, more immediately, the capital position faces the amortisation of deferred tax credits, which will depress the CET1 ratio by 0.3% pa.
|
Exhibit 7: Current CET1 ratios, CET1 fully adjusted for IFRS9, and regulatory requirement |
|
|
Source: Attica, Edison Investment Research |
ELA funding still present
Exchange controls were introduced in June 2015 to halt an outflow of deposits from the domestic banking sector. Attica was disproportionately affected by this shrinkage in the sector’s funding base, seeing its share of domestic deposits slipping from 1.9% to 1.4%, and being forced to borrow at the peak €1.12bn of Eurosystem funding through ELA. Although ELA funding to Attica has subsequently been reduced to €570m, (supported by €1.7bn of pledged assets), major Greek banks have repaid their liabilities.
The good news is that Attica’s customer deposits have been on an upward trajectory since mid-2017. Q218 saw a 7% increase from the start of this year, and a 13% year-on-year increase. Growth has come primarily from household term deposits and the public sector. As a consequence, the loan-to-deposit ratio has declined from 114% (end-2017) to 99.9% at H118. We estimate that the Metexelixis transaction will drive the ratio down to 80%.
|
Exhibit 8: Funding structure |
|
|
Source: Attica Q218 |
Outlook
Exhibit 9: Consensus forecasts for Greece; real estate price index
2015 |
2016 |
2017 |
2018e |
2019e |
2020e |
|
Real GDP growth (%) |
(0.2) |
(0.3) |
1.4 |
2.1 |
2.0 |
2.0 |
CPI (%) |
(1.1) |
0 |
1.1 |
0.9 |
1.2 |
1.3 |
Unemployment (%) |
24.9 |
23.6 |
21.5 |
19.8 |
18.1 |
17.2 |
Current acc % GDP |
0 |
(0.5) |
(0.5) |
(0.4) |
(0.5) |
(0.5) |
Fiscal balance % GDP |
(5.7) |
0.5 |
0.8 |
0.3 |
0.1 |
0.4 |
Real estate price index (2010 =100) |
||||||
Apartments |
62 |
62 |
61 |
|||
Office |
70 |
70 |
72 |
|||
Retail |
71 |
70 |
72 |
Source: Reuters, Bank of Greece
Revenue drivers
For 2018, net interest income is subject to two conflicting influences. Through the Artemis securitisation, Attica exchanged €1.33bn of impaired loans for €525m of 10-year senior notes with a 3% coupon. The income on the senior notes is likely to exceed the interest income that would have accrued on the impaired portfolio. However, we believe this positive is likely to be offset by the continued shrinkage of performing loans, with the result that net interest income will be lower than the prior year. Net interest income was down 1% at the interim stage.
The improvement we project for 2019 assumes a stabilisation in performing loans and incremental income on the Metexelixis senior note. In addition, we believe Attica has some scope to reduce rates offered on time deposits, since these rates appear more generous than those offered by competitor institutions (average term deposit rate 1.35% compared with the major Greek banks at 0.7–0.9%). Likewise, there may be scope to improve asset yields as Greek banks are highlighting a healthy differential between the pricing of new business and the existing stock. For example, in a recent presentation Piraeus Bank cites the difference between new and back-book pricing of SME loans at 1.0%. Aside from this, Attica would be a beneficiary from the early redemption of the senior notes and redeployment of the proceeds to the SME sector, since yields on SME lending are characteristically 5–6%.
Fee and commission income is derived from many different sources, but the largest elements come from loan commitments and letters of guarantee. This revenue stream therefore reflects the subdued lending environment, but there has been some progress from the provision of point-of-sale terminals and business credit cards to SMEs. Management is seeking supplementary revenues through a bancassurance agreement with a major insurance company.
Profit from financial transactions and the investment portfolio stems from realised and unrealised gains on portfolios of Greek government and corporate bonds. Gains on the transfer of loans are the product of recent securitisations, and the €47m gain from Metexelixis will appear in Q318.
Cost-cutting to continue
Recognising the necessity of ‘right sizing’ the cost base in line with the declining level of performing assets, expenses have fallen 14% since 2015 and the ratio of expenses to operating income (net interest plus fee and commission income) has fallen from 94% (end-2016) to a current 87%. However, the major Greek banks are generally in the 50–60% range (Exhibit 11).
An initial voluntary redundancy scheme reduced Attica’s headcount from 870 to just under 780. The board of directors approved a second voluntary retirement scheme at the end of Q118. 23% of the workforce agreed to participate. This should save €8–9m pa on an ongoing basis, but Attica believes the cost of the scheme will approach €20m of which €17.2m was charged in H118. Nonetheless, even excluding this item we anticipate the expense ratio rising to 82% this year.
Exhibit 10: Attica earnings model
(€000, unless otherwise stated) |
FY16 |
FY17 |
H118 |
FY18e |
FY19e |
FY20e |
||
Interest income |
143,085 |
137,302 |
61,397 |
124,369 |
136,031 |
140,071 |
||
Interest expense |
(56,391) |
(50,310) |
(22,971) |
(47,609) |
(48,025) |
(44,173) |
||
Net interest income |
86,694 |
86,992 |
38,426 |
76,760 |
88,006 |
95,899 |
||
Net fees and commissions |
10,894 |
10,626 |
3,384 |
8,501 |
8,926 |
9,372 |
||
Profit from financial transactions |
3,317 |
1,334 |
464 |
464 |
- |
- |
||
Profit from investment portfolio |
606 |
155 |
377 |
377 |
- |
- |
||
Gain from securitisation |
- |
70,000 |
- |
47,000 |
- |
- |
||
Other income |
2,715 |
(2,478) |
441 |
441 |
- |
- |
||
Operating income |
6,638 |
69,010 |
1,282 |
48,282 |
- |
- |
||
Personnel expenses |
(53,264) |
(38,554) |
(18,828) |
(33,369) |
(29,927) |
(24,370) |
||
Staff retirement compensation |
(17,214) |
(20,000) |
(10,000) |
- |
||||
General operating expenses |
(32,374) |
(31,051) |
(13,736) |
(30,119) |
(29,216) |
(28,339) |
||
Depreciation |
(6,205) |
(6,511) |
(3,712) |
(6,706) |
(6,773) |
|||
Costs |
(91,843) |
(76,116) |
(53,491) |
(90,195) |
(75,916) |
(59,348) |
||
Impairment charge for loan losses |
(40,000) |
(73,500) |
(21,108) |
(36,939) |
(17,000) |
(13,005) |
||
Impairment charge for AFS |
(95) |
- |
- |
- |
- |
- |
||
Impairment other assets |
(12,421) |
(14,925) |
(378) |
(378) |
- |
- |
||
Associates |
(2,198) |
(953) |
(2,910) |
(2,910) |
- |
- |
||
Pre tax |
(42,331) |
1,134 |
(34,795) |
3,121 |
4,016 |
32,918 |
||
Adjustments |
6,898 |
(69,047) |
20,124 |
(24,090) |
10,000 |
- |
||
Underlying PBT* |
(35,433) |
(67,913) |
(14,671) |
(20,969) |
14,016 |
32,918 |
||
PBT |
(42,331) |
1,134 |
(34,795) |
3,121 |
4,016 |
32,918 |
||
Taxation |
(7,498) |
(704) |
(1,074) |
(2,010) |
(2,270) |
(10,652) |
||
Non-controlling interests |
173 |
- |
- |
- |
- |
- |
||
Attributable |
(60,516) |
(11,830) |
(35,869) |
1,110 |
1,746 |
22,266 |
||
Shares ranking (m) |
2,339 |
2,339 |
1,647 |
461 |
461 |
461 |
||
EPS (€) |
(0.026) |
(0.005) |
(0.0218) |
0.002 |
0.004 |
0.048 |
||
Expense ratio (%)* |
94% |
78% |
87% |
82% |
68% |
56% |
||
Shareholders’ equity |
632,644 |
632,705 |
585,852 |
522,631 |
524,377 |
546,644 |
||
Intangibles |
43,515 |
46,668 |
49,930 |
44,052 |
39,537 |
35,111 |
||
Preference shares |
100,200 |
100,200 |
100,200 |
|
- |
- |
||
Net tangible assets |
488,929 |
485,837 |
435,722 |
478,579 |
484,841 |
511,533 |
||
Net tangible assets per share (€) |
0.21 |
0.21 |
0.94 |
1.04 |
1.05 |
1.11 |
||
CET1 capital |
513,154 |
503,618 |
429,440 |
469,804 |
466,180 |
477,491 |
||
RWAs |
3,468,755 |
3,421,732 |
3,355,000 |
3,322,939 |
3,389,397 |
3,457,185 |
||
CET1 ratio |
14.8% |
14.7% |
12.8% |
14.1% |
13.8% |
13.8% |
||
Return on net tangible assets (%) |
(11.2) |
(2.4) |
(14.8) |
0.2 |
0.4 |
4.6 |
Source: Attica, Edison Investment Research estimates. Note: *excludes gain from securitisation, staff retirement compensation and associates.
There should, however, be a significant improvement in 2019, reflecting the delayed benefit of the retirement scheme. We believe a third scheme is likely to be implemented next year to facilitate scaling back the retail bank. This will entail another restructuring charge (estimated €10m) and take the group headcount down to around 500. We estimate this level would be consistent with an expense ratio in the 55–60% range.
Impairments
Despite positive economic growth and stable employment levels, the impairment charge for H118 was little changed on the comparative period. However, within this figure write-downs of off-balance items offset a significant improvement in loan loss experience. Consequently, there is still scope for the charge to decline in future periods, and with the group’s exposure to impaired loans significantly reduced through the two securitisations the sensitivity to collateral values is diminished. We have impairments stabilising at 1.5% of Stage 1 loans, which approximates to the 12-month expected loss rate under IFRS 9.
Forecast ROTE of 4.6% by 2020
We expect Attica to report a small pre-tax profit in 2018. However, this is not indicative of underlying earnings power, since it includes the €47m gain from the Metexelixis transaction, the €20m cost of the voluntary retirement scheme, and a material negative contribution from associates following the write-off of venture capital investments. Excluding these three non-recurring items, our projections indicate an underlying pre-tax loss of €21.0m. Significantly, on the same basis, Attica produced an underlying pre-tax loss of 14.7m for H118, compared to the headline reported loss of €34.8m.
At the headline level, 2019 looks materially similar to 2018 because of the absence of gains from securitisations and a further restructuring charge. However, on an underlying basis, there is a material improvement in Attica’s core profitability. This reflects the lower cost base facilitated by the second voluntary retirement scheme, net interest income benefiting from a full year’s contribution from the Metexelixis senior note and stabilisation in the level of performing loans. We project underlying PBT of €14.0m, which would represent a significant inflection point. 2020 represents the steady state position in that it is assumed there are no further restructuring charges and impairments normalise. If our assumptions are correct, Attica should be reporting headline (and underlying) PBT of c €33m, giving €0.048 of EPS, equivalent to a 4.6% return on tangible equity.
Exhibit 11: Attica vs peer group
H118 (€m) |
Attica |
Alpha |
Eurobank |
NBG |
Piraeus |
Bank of Cyprus |
||||||||
Underlying revenue |
42 |
1,090 |
849 |
695 |
934 |
285 |
||||||||
Underlying costs |
(36) |
(a) |
(540) |
(436) |
(468) |
(505) |
(197) |
|||||||
Impairment |
(21) |
(700) |
(337) |
(168) |
(300) |
(81) |
||||||||
Underlying PBT |
(15) |
(a) |
(149) |
77 |
59 |
129 |
7 |
|||||||
Nominal tax @ 29% |
(22) |
(17) |
(37) |
(2) |
||||||||||
Non-controlling interest |
(20) |
(3) |
2 |
|||||||||||
Attributable |
54 |
22 |
89 |
7 |
||||||||||
Impairment/loans |
2.2% |
2.5% |
1.4% |
0.8% |
1.1% |
1.2% |
||||||||
Cost/revenues |
87% |
49% |
51% |
67% |
54% |
69% |
||||||||
Return on tangible shareholders’ funds |
n/a |
N/A |
2% |
1% |
4% |
1% |
||||||||
CET1 |
480 |
(b) |
8,891 |
5,592 |
5,800 |
6,636 |
2,100 |
|||||||
RWAs |
3,355 |
48,100 |
37,795 |
36,100 |
47,400 |
14,890 |
||||||||
CET1 ratio |
14.3% |
18.5% |
14.8% |
16.4% |
14.0% |
14.1% |
||||||||
CET1 ratio ex IFRS 9 adj |
11.2% |
15.5% |
11.9% |
13.0% |
10.6% |
13.6% |
||||||||
Est regulatory requirement |
9.0% |
10.0% |
10.0% |
10.0% |
10.8% |
10.0% |
||||||||
Surplus capital |
74 |
2,646 |
718 |
1,083 |
(71) |
536 |
||||||||
Surplus % tangible shareholders' funds |
16% |
34% |
15% |
22% |
(1%) |
28% |
||||||||
Deposits |
2,786 |
37,059 |
36,388 |
41,228 |
42,102 |
16,486 |
||||||||
Of which ELA funding |
665 |
2,500 |
3,800 |
0 |
0 |
0 |
||||||||
Loans/deposits |
80% |
(b) |
119% |
111% |
73% |
94% |
68% |
|||||||
Stage 1 |
874 |
N/A |
20,300 |
15,570 |
N/A |
4,500 |
||||||||
Stage 2 |
451 |
N/A |
7,400 |
7,760 |
N/A |
4,000 |
||||||||
Stage 3 |
591 |
(b) |
28,800 |
19,000 |
16,930 |
29,387 |
5,200 |
|||||||
Gross loans |
1,916 |
55,432 |
46,760 |
40,416 |
53,749 |
13,710 |
||||||||
LLA |
(222) |
(b) |
(14,225) |
(10,554) |
(10,118) |
(14,368) |
(2,522) |
|||||||
Net loans |
1,695 |
41,207 |
36,206 |
30,298 |
39,381 |
11,188 |
||||||||
Stage 3 less LLA as % of tangible shareholders’ funds |
||||||||||||||
79% |
186% |
174% |
138% |
307% |
141% |
|||||||||
Shareholders’ funds |
519 |
|
8,250 |
5,020 |
5,088 |
5,185 |
2,063 |
|||||||
Goodwill, intangibles |
(50) |
(405) |
(168) |
(136) |
(295) |
(169) |
||||||||
Tangible shareholders’ funds |
469 |
(b) |
7,845 |
4,852 |
4,952 |
4,890 |
1,895 |
|||||||
Shares in issue (m) |
461 |
1,544 |
2,186 |
915 |
437 |
44 |
||||||||
Share price (€) |
0.14 |
1.26 |
0.50 |
1.39 |
1.12 |
1.71 |
||||||||
Market capitalisation |
64 |
1,937 |
1,095 |
1,268 |
490 |
763 |
||||||||
Unprovided stage 3 less surplus (%) |
63% |
152% |
159% |
116% |
309% |
113% |
||||||||
Price/tangible shareholders’ funds |
0.14 |
0.25 |
0.23 |
0.26 |
0.10 |
0.40 |
||||||||
P/E (x) |
N/A |
N/A |
20.2 |
57.9 |
5.5 |
114.4 |
||||||||
Source: Attica, Edison Investment Research. Note: (a) excludes provision voluntary retirement scheme; (b) pro forma post-Metexelixis.
Valuation: Discount to peers
Before discussing valuation, it is worthwhile comparing Attica to its immediate quoted peer group. In conducting this exercise, we have relied on H118 data adjusted where possible to exclude non-recurring revenues and costs, discontinued operations or those subject to disposal.
The key feature of all these institutions is that they are either loss-making or only marginally profitable. This is mainly because of impairment charges in excess of 1% of lending, but in addition Attica has a relatively high cost/income ratio, reflecting more limited scale economies.
On the plus side, however, allowing for the Metexelixis transaction, Attica has a relatively liquid balance sheet (as evidenced by an 80% loan to deposit ratio, and modest levels of Stage 3, or impaired loans, It is not strictly correct to deduct all the LLA against Stage 3 loans (because under IFRS 9 an element is ascribed to Stage1 and Stage 2), but on this basis, net impaired loans represent 79% of tangible shareholders’ funds compared to a peer group range of 138–307%. This highlights the extent to which Attica has resolved legacy credit issues.
In terms of capital, Attica is comfortably positioned particularly because as a non-systemic institution its regulatory requirement will be lower than other banks. We estimate that after fully adjusting for IFRS 9, surplus capital will represent 16% of net tangible assets. As previously indicated, the repayment of senior notes would add around 5% to CET1.
In terms of valuation, PE comparisons are unhelpful because earnings are cyclically depressed. There is more consistency in price/tangible shareholders’ funds ratios and we compare them with 2020 ROEs, with the caveat that even by this stage earnings may not have normalised. Tangible shareholders’ funds for Attica is calculated as H118 stated equity of €586m less €100m preference shares less €50m intangible assets plus the €47m gain on the Metexelixis taxed at 29%, which divided by 461.3m shares in issue following the reorganisation, gives tangible book value per share (TBV) of €1.02.
The Greeks banks are trading at a range between 0.1x and 0.41x, based on Reuters I/B/E/S consensus numbers. At the bottom of this range is Piraeus Bank with an anticipated ROTE of just 3.0% in 2020. At the top end is Bank of Cyprus with a ROTE of 8.6%. The other banks (including Attica) have an ROTE in the 4.5–6.0% range. However, despite offering a comparable level of profitability Attica is trading at a PTBV of 0.14x; in comparison with peers at 0.23–0.26x. We believe that this supports a fair value of 0.25x for Attica, equivalent to €0.26 per share, which is almost double the current share price.
The real upside to Attica’s shares will come from investors becoming more comfortable with Greece’s economic recovery easing perceptions of risk in the banking system. According to our calculations (Exhibit 12), if we take the 2020 returns as sustainable then the cost of equity for Greek banks is around 25% for Greek banks (reciprocal of the gradient of the best-fit straight line). Compared to Greece’s 10 year sovereign rate (4.3%), there is clearly scope for this risk-premium to decline boosting valuations significantly, including that of Attica. The sensitivity of valuation to the sustainable ROTE and cost of equity is set out in Exhibit 13.Our fair value price of €0.26 per share is consistent with a 5% ROTE and 20% COE.
It seems to us that the very low Greek bank PTBV multiples also reflect some fears regarding significant future asset write-downs. It is impossible for us to guarantee that this will not happen. However, as we mentioned before in this report, Attica has completed a significant restructuring exercise. Also, if we allow for surplus capital (excess capital over regulatory requirement), we note that Attica’s level of unprovided impaired loans at 63% of tangible equity is around half that of other banks and compares with over 250% before the capital restructuring and securitisations. To date, investors have entirely ignored this transformation.
|
Exhibit 12: Capital asset pricing model |
|
|
Source: Reuters , Edison Investment Research |
Exhibit 13: Attica, theoretical share price
Sustainable ROTE |
||||
COE |
3% |
5% |
7% |
10% |
10% |
0.32 |
0.53 |
0.74 |
1.05 |
15% |
0.21 |
0.35 |
0.49 |
0.70 |
20% |
0.16 |
0.26 |
0.37 |
0.53 |
25% |
0.13 |
0.21 |
0.29 |
0.42 |
Source: Edison Investment Research
|
|||||||||||||||||||||||||||||||||||||||
|
|
STEMMER IMAGING (SI) started its life as a listed company by posting the highest full-year revenues in its history. We expect further improvement as SI benefits from its broad product portfolio, customisation expertise and extensive customer base across many markets to take advantage of double-digit growth in the machine vision industry. This organic growth is being supplemented with acquisitions, as management has allocated half of the €51m (gross) raised at the IPO in February for expansion.