Last close As at 05/08/2026
—
— 0.00 (0.00%)
Market capitalisation
—
Research: Investment Companies
The Scottish Investment Trust (SCIN) employs a high-conviction, global contrarian approach, aiming to deliver long-term, above-average returns via capital growth and rising income. It seeks to do this by ignoring the crowd, anticipating change and identifying a diversified portfolio of undervalued international stocks that will benefit when change comes. Manager Alasdair McKinnon views minimising losses during turbulent episodes as a key part of maximising long-term returns. Current positioning, implemented ahead of the severe market weakness triggered by the COVID-19 crisis, is thus intended to preserve capital and ride out the volatility. This pre-emptive approach has paid off, as the trust has outperformed during the downturn.
Written by
The Scottish Investment Trust |
Contrarian approach paying off in tough times |
Investment trusts |
23 April 2020 |
Share price/discount performance
Three-year performance vs index
Gearing
Analysts
|
||||||||||||||||||||||||||||||||||||||||||||||||||||||||||||||||||||||||||||||||||||||||||||||||||||||||
The Scottish Investment Trust (SCIN) employs a high-conviction, global contrarian approach, aiming to deliver long-term, above-average returns via capital growth and rising income. It seeks to do this by ignoring the crowd, anticipating change and identifying a diversified portfolio of undervalued international stocks that will benefit when change comes. Manager Alasdair McKinnon views minimising losses during turbulent episodes as a key part of maximising long-term returns. Current positioning, implemented ahead of the severe market weakness triggered by the COVID-19 crisis, is thus intended to preserve capital and ride out the volatility. This pre-emptive approach has paid off, as the trust has outperformed during the downturn.
|
Recent performance: Early action limited losses |
|
|
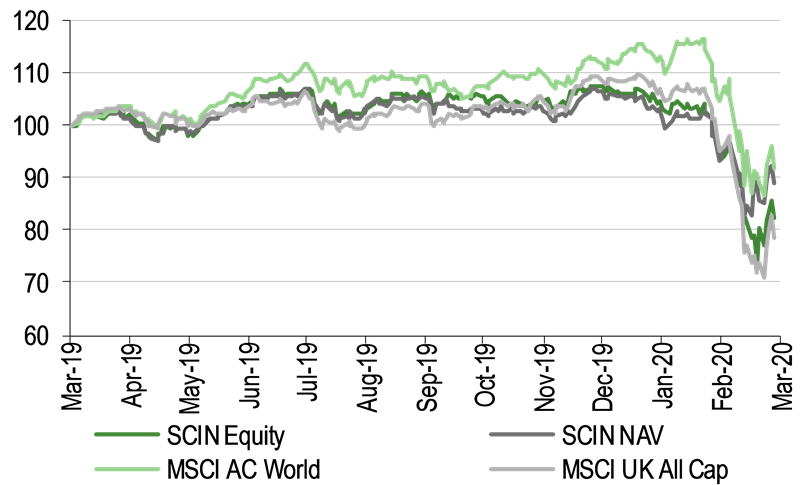
Source: Refinitiv, Edison Investment Research. Shows performance relative to MSCI ACWI. |
The market opportunity
The recent turbulence in global equity markets has created many attractive opportunities amid the indiscriminate selling. It is not yet possible to say when markets will stabilise. But when they do, forward-looking investors, focused on longer-term gains, will be well rewarded for purchasing stocks that are presently severely undervalued, in anticipation of significant outperformance as these unloved and unfashionable companies show their true worth.
Why consider investing in The Scottish IT?
■
A highly differentiated contrarian approach intended to weather unforeseen events such as the coronavirus, by limiting downside risk.
■
A 36-year record of dividend growth, aimed at outpacing UK inflation.
■
A long track record of relative outperformance versus the UK market.
Dividend continues to rise and the discount widens
Dividends are paid quarterly and the total dividend for FY19 was 20% higher than in the previous year. The shares currently have a yield of 3.2%. As at 21 April 2020, SCIN’s shares traded at an 11.7% discount to NAV on a cum-fair basis. The trust has an active buyback policy, aiming to limit the discount to 9% under normal market conditions. The average discount stood at 9.0% during the three-year period to end March 2020.
Exhibit 1: Trust at a glance
Investment objective and fund background |
Recent developments |
|||||||||||||||||||||||||||||||||||||||||||||||||||||||||||||||||||
The Scottish Investment Trust’s objective is, over the longer term, to provide investors with above-average returns through a diversified portfolio of international equities, and to achieve dividend growth ahead of UK inflation. The manager takes a patient approach and seeks to invest in companies that are undervalued, unfashionable and ripe for improvement. |
■ 25 March 2020: First quarter interim dividend of 5.7p declared, to be paid 7 May 2020 ■ 14 February 2020: Payment of final dividend of 6.9p and special dividend of 7.45p, meaning total dividend for the year increased by 20% to 30.25p ■ 4 February 2020: Russell Napier stepped down from the board at the February AGM |
|||||||||||||||||||||||||||||||||||||||||||||||||||||||||||||||||||
Forthcoming |
Capital structure |
Fund details |
||||||||||||||||||||||||||||||||||||||||||||||||||||||||||||||||||
AGM |
February 2021 |
Ongoing charges |
0.58% |
Group |
SIT Savings Ltd (AIFM) |
|||||||||||||||||||||||||||||||||||||||||||||||||||||||||||||||
Interim results |
June 2020 |
Net cash |
6.3% |
Manager |
Alasdair McKinnon and team |
|||||||||||||||||||||||||||||||||||||||||||||||||||||||||||||||
Year end |
31 October |
Annual mgmt fee |
N/A (self-managed) |
Address |
6 Albyn Place, |
|||||||||||||||||||||||||||||||||||||||||||||||||||||||||||||||
Dividend paid |
Quarterly |
Performance fee |
N/A (self-managed) |
|||||||||||||||||||||||||||||||||||||||||||||||||||||||||||||||||
Launch date |
July 1887 |
Trust life |
Indefinite |
Phone |
+44 (0) 131 225 7781 |
|||||||||||||||||||||||||||||||||||||||||||||||||||||||||||||||
Continuation vote |
No |
Loan facilities |
£83.9m long-term debt |
Website |
||||||||||||||||||||||||||||||||||||||||||||||||||||||||||||||||
Dividend policy and history (financial years) |
Share buyback policy and history (financial years) |
|||||||||||||||||||||||||||||||||||||||||||||||||||||||||||||||||||
Dividends historically paid twice a year in July and February, with special dividends (where applicable) paid alongside the final dividend. From FY18 dividends have been paid quarterly. SCIN has grown its regular dividend every year since 1983. |
SCIN has the authority to buy back up to 14.99% of shares annually, and targets a maximum discount (based on cum-income NAV, with debt at market value) of 9%. Buyback figures for FY17 below include the repurchase of the legacy Aviva shareholding. |
|||||||||||||||||||||||||||||||||||||||||||||||||||||||||||||||||||
|
|
|||||||||||||||||||||||||||||||||||||||||||||||||||||||||||||||||||
Shareholder base (as at 6 April 2020) |
Portfolio exposure by category (as at 31 March 2020) |
|||||||||||||||||||||||||||||||||||||||||||||||||||||||||||||||||||
|
|
|||||||||||||||||||||||||||||||||||||||||||||||||||||||||||||||||||
Top 10 holdings (as at 31 March 2020) |
||||||||||||||||||||||||||||||||||||||||||||||||||||||||||||||||||||
|
||||||||||||||||||||||||||||||||||||||||||||||||||||||||||||||||||||
Source: The Scottish Investment Trust, Edison Investment Research, Bloomberg, Morningstar. Note: *N/A where not in end-March 2019 top 10.
Market outlook: Crisis brings change and opportunities
It took some time for global financial markets’ risk assessment of the coronavirus outbreak to catch up with the reality. Even as large-scale disruption in China became evident, markets hit historical highs in February as growth stocks basked in seemingly perpetual euphoria. But reality eventually prevailed and equity markets sustained heavy losses in late February and March, as fears of a deep global recession spread. Western governments and central banks implemented massive stimulatory efforts to ward off a prolonged downturn and keep businesses and citizens solvent during the crisis. It is not yet clear whether these efforts will be sufficient to stabilise markets and investor sentiment.
In this uncertain and frightening climate, it is difficult to be optimistic. However, we can be fairly confident that recent, unprecedented events will eventually lead to many changes in the way the global economy operates. Global, just-in-time supply chains will be reconsidered, international business travel will likely decline, governments will be under pressure to step up investment in health infrastructure and medical research, and remote working and learning will become more widespread. All of these changes, and many others more difficult to anticipate, will create opportunities for technological innovation, new and stronger businesses and long-term economic growth. Equity investors may be well-served by looking through the near-term gloom and taking a longer-term, contrarian view. Where general expectations are low, and fear dominates, there is significant scope for positive surprises, and this is where the best balance between risk and reward exists. It will take time for all the ramifications of this crisis to play out, but contrarian investors seeking opportunities in undervalued stocks could be well rewarded for their patience.
|
Exhibit 2: Market performance and valuation |
|||||||||||||||||||||||||||||||||||||||||||
UK and global equity index performance over five years |
Forward P/E valuation metrics of Datastream indices |
||||||||||||||||||||||||||||||||||||||||||
|
|
||||||||||||||||||||||||||||||||||||||||||
|
Source: Refinitiv, Edison Investment Research. Note: Valuation data as at 21 April 2020. |
|||||||||||||||||||||||||||||||||||||||||||
Fund profile: Award-winning active contrarian
SCIN is a self-managed global investment trust that adopts a global contrarian approach. Manager Alasdair McKinnon and his four-person investment team aim to provide longer-term capital appreciation and annual dividend growth outpacing UK inflation. The trust has achieved its dividend growth goal over the last 36 consecutive years and is one of the highest-yielding trusts in its peer group, the Association of Investment Companies (AIC) Global Sector.
The trust has been based in Edinburgh since its launch in 1887. Its management team has built a ‘best ideas’ portfolio containing 50–100 global stocks. These stocks are undervalued by the market, but their fundamentals suggest scope for valuations to increase over the longer term as a result of operational and cyclical improvements. The trust does not have a formal benchmark, as the portfolio is unlike any benchmark or index, although it uses the MSCI AC World and MSCI UK All-Cap indices as broad comparators of performance. As such, it is expected to have a differentiated performance.
SCIN has scope to use gearing up to 20% of net assets, which it uses flexibly. The board actively manages the trust’s discount to NAV. In normal market conditions, it uses regular share buybacks aiming to cap the discount at 9%. The trust is one of the lowest-cost funds in its AIC peer group, and its ongoing charge of 0.58% is low relative to other actively managed investment vehicles.
The fund manager: Alasdair McKinnon
The manager’s view: Preserving capital and eyeing bargains
As the virus spread rapidly from China to Europe, SCIN’s manager Alasdair McKinnon was shocked by the complacency of most investors. By contrast, McKinnon and his team began to consider the economic implications of a global lockdown. In the first days of February, the team made changes to the portfolio, in advance of the market downturn. To preserve capital, they sold stocks that would suffer from the lockdown and recession to follow, and increased cash holdings. However, they also added exposure to investments with resilient revenues, especially those in healthcare, utilities and tobacco, set to benefit from increased demand during the crisis.
The trust also added to its gold holdings, purchasing two new gold mining companies. Gold has long been a particular favourite of McKinnon’s, due to its use as a store of value, especially in times of inflation or aggressive monetary and fiscal stimulus. He favours exposure via investment in gold mining companies, which he views as undervalued. McKinnon maintained positions in telecoms, which he believes represent particular value relative to the market at the moment – as people work online from home and use the internet to socialise and entertain themselves during lockdowns, the increased use of data will benefit telecom providers. McKinnon believes that spending on communication services will be the last thing that households cut, and governments will not allow telecoms to shut down. He says the crisis is proving the sector’s true worth. McKinnon stresses that all of these portfolio adjustments were not ‘reactive’ moves, but ones made in anticipation of the market’s realisation of the risks posed by the coronavirus.
Looking ahead, contrary to the general gloom currently pervading equity markets, the manager sees ‘tremendous opportunities’. He believes the aggressive monetary easing and massive government support packages for businesses and workers are ‘very good news’ for the value stocks he seeks. McKinnon says there are lots of good companies that have been hit hard, but that will nonetheless be well-placed when this extraordinary stimulus takes effect. ‘There will be a bounce back for oil, and for consumer spending power, and that’s where we’ll be looking in due course’.
Asset allocation
Investment process: Rejecting ‘group think’
SCIN’s manager, Alasdair McKinnon, heads an investment team comprising Deputy Manager Martin Robertson, investment managers Sarah Monaco and Mark Dobbie, and analyst Igor Malewicz. The team employs an active, contrarian investment approach, seeking out unpopular, undervalued stocks. Rooted in the principles of behavioural finance, the approach rejects the ‘group think’ tendencies of most investors, who pursue returns from companies that have already performed well. Instead, SCIN uses fundamental analysis to identify value in overlooked parts of the market that have the potential to recover and prosper.
The investment process is clearly defined. Team members meet regularly to discuss ideas gleaned from fundamental analysis and various internal and external sources. The team places companies in one of three categories:
Ugly ducklings – operationally challenged companies that the market shuns. However, the SCIN team has identified reasons to believe the performance of these companies will exceed expectations, hence their out-of-favour status is an opportunity to purchase at a relatively low cost. These stocks comprise about 37% of the portfolio. Current examples include AT&T, China Mobile, Carrefour and Altria.
Change is afoot – companies that have also endured a long period of poor operational performance, but whose prospects have recently improved significantly, without attracting more favourable assessments from the market in general. Comprising around 59% of the portfolio, stocks in this category include Tesco, Newmont, Barrick Gold, Gilead Sciences and Roche.
More to come – companies that have graduated from other categories and are now generally recognised as good businesses with decent prospects. However, the team sees scope for further upside in performance and price, which is not fully recognised by the market. Such stocks comprise 4% of the portfolio, and include PepsiCo and KDDI.
New additions to the portfolio usually come in at between 0.5% and 3.0% of NAV, depending on the strength of the team’s view. Stocks are sold once the forecast improvement in performance is fully realised. Positions may also be closed if there is a deterioration in a holding’s fundamentals which reduces the stock’s capacity to realise previously forecast share price gains. Because of the long-term approach of this strategy, turnover tends to be low.
Current portfolio positioning
In early February 2020, ahead of the severe market correction, SCIN reduced exposure to economically sensitive industries such as retail, energy, banks and other cyclicals, paring back its positions in stocks such as Target, Tesco, Royal Dutch Shell, Royal Bank of Scotland, BNP Paribas and ING. The trust also increased exposure to investments with resilient revenues, such as utilities, tobacco and healthcare, and to gold, which are all set to benefit from recent events. Buys included new positions in Severn Trent, Gilead Sciences and two South African gold mining companies, AngloGold Ashanti and Gold Fields, and an increase in its holding of Japan Tobacco.
As at end-March 2020, SCIN’s portfolio comprised 52 stocks. The top 10 holdings (Exhibit 1) represented 35.3% of portfolio value, up 0.7% from a year earlier. The manager’s positive view on gold is manifested in the fact that the top three holdings – Newmont, Barrick Gold and Newcrest Mining – are gold mining companies. Overall, gold now accounts for 16.5% of the portfolio, up from 13.1% at end-March 2019 (Exhibit 4). The manager’s confidence in telecoms is reflected in a communication services weighting of 14.2%, up from 8.5% a year ago, via holdings of BT Group, China Mobile, AT&T, Verizon Communications, Orange and Deutsche Telekom. Exposures to consumer staples, healthcare and utilities have risen, while there have been marked reductions in weightings to financials, consumer discretionary and energy.
The portfolio remains geographically well spread (Exhibit 3). Exposure to North America, at 31.6%, is similar to this time last year. Exposure to the UK and Europe has been reduced in favour of modest increases in Japan, Pacific ex-Japan, the Middle East and Africa, as well as a higher cash position. The manager’s contrarian approach means that compared to global indices, the portfolio remains heavily underweight North America, which is driven by the expensive US growth stocks so popular with investors, but spurned by McKinnon. Conversely, SCIN’s smaller, but persistent overweight to the UK reflects the fact that this market remains out of favour with most investors. The portfolio currently has 18.2% in cash, ready to deploy once market conditions stabilise.
Exhibit 3: Portfolio geographic exposure (% of total assets unless stated)
Portfolio end-March 2020 |
Portfolio end-March 2019 |
Change (pp) |
|
North America |
31.6 |
31.5 |
0.1 |
UK |
15.6 |
26.2 |
(10.6) |
Europe ex-UK |
13.1 |
16.7 |
(3.6) |
Japan |
9.8 |
9.0 |
0.9 |
Pacific ex-Japan |
9.6 |
7.0 |
2.6 |
Middle East & Africa |
1.9 |
0.0 |
1.9 |
Cash |
18.2 |
9.5 |
8.7 |
100.0 |
100.0 |
Source: The Scottish Investment Trust, Edison Investment Research
Exhibit 4: Portfolio sector exposure vs MSCI AC World Index (% unless stated)
Portfolio end- March 2020 |
Portfolio end- March 2019 |
Change (pp) |
Index weight |
Active weight vs index (pp) |
Trust weight/ index weight (x) |
|
Materials |
16.5 |
13.1 |
3.4 |
4.4 |
12.1 |
3.8 |
Consumer staples |
15.7 |
9.8 |
5.9 |
8.8 |
6.9 |
1.8 |
Healthcare |
15.7 |
9.6 |
6.1 |
13.3 |
2.4 |
1.2 |
Communication services |
14.2 |
8.5 |
5.7 |
9.3 |
4.9 |
1.5 |
Utilities |
8.8 |
2.0 |
6.8 |
3.6 |
5.2 |
2.4 |
Energy |
4.9 |
13.5 |
(8.6) |
3.7 |
1.2 |
1.3 |
Industrials |
2.4 |
2.7 |
(0.2) |
9.6 |
(7.2) |
0.2 |
Financials |
2.2 |
18.0 |
(15.8) |
14.5 |
(12.3) |
0.2 |
Consumer discretionary |
1.0 |
11.7 |
(10.8) |
10.8 |
(9.8) |
0.1 |
Real estate |
0.4 |
1.6 |
(1.2) |
3.2 |
(2.8) |
0.1 |
Information technology |
0.0 |
0.0 |
0.0 |
18.8 |
(18.8) |
0.0 |
Cash |
18.2 |
9.5 |
8.7 |
0.0 |
18.2 |
N/A |
100.0 |
100.0 |
100.0 |
Source: The Scottish Investment Trust, Edison Investment Research
Performance: Pre-emptive moves drive outperformance
Exhibit 5: Five-year discrete performance data
12 months ending |
Share price |
NAV |
MSCI AC World net |
MSCI UK All Cap net |
31/03/16 |
(4.5) |
(0.6) |
(1.3) |
(4.3) |
31/03/17 |
37.6 |
31.5 |
32.0 |
22.3 |
31/03/18 |
1.8 |
(0.4) |
2.6 |
1.2 |
31/03/19 |
4.3 |
5.2 |
10.8 |
6.3 |
31/03/20 |
(16.2) |
(11.7) |
(7.0) |
(19.4) |
Source: Refinitiv. Note: All % on a total return basis in pounds sterling.
Although no area of the market has escaped the recent sell-off unscathed, SCIN’s performance during the recent correction is well ahead of the broader market (Exhibit 6). In March, its share price and NAV total returns of -9.8% and -5.1%, respectively, compare favourably with returns of -11.0% on the MSCI AC World Index and -15.1% on the MSCI UK All Cap Index. For the three months to end March, the trust’s share price and NAV total returns of -21.1% and -16.1%, respectively, compare to a return of -15.9% for the MSCI AC World Index and -25.3% for the MSCI UK All Cap Index.
Relative to UK equities, as measured by the MSCI UK All-Cap Index, performance has also been solid over the longer term, with returns outstripping the index on a one-, three-, five- and 10-year basis (Exhibit 7). This clearly illustrates the benefits to UK investors of a global investment strategy.
|
Exhibit 6: Investment trust performance to 31 March 2020 |
|
Price, NAV and index total return performance, one-year rebased |
Price, NAV and index total return performance (%) |
|
|
|
Source: Refinitiv, Edison Investment Research. Note: Three-, five- and 10-year performance figures annualised. |
|
The trust has underperformed global markets, as measured by the MSCI AC World Index, over the same periods. This is not surprising, as global indices have long been highly influenced by the US market, where momentum-driven growth stocks have underpinned returns. However, the recent flight to safety suggests global investors may have lost their appetite for some risky, high valuation growth stocks and will instead begin to see value in the more attractively priced companies favoured by SCIN. If this proves the case, the trust’s future performance relative to global markets is likely to improve.
SCIN’s recent performance has been assisted by the strong performance of its gold mining holdings. Positions in consumer staples (tobacco and food retail), healthcare and communication services (telecoms) also added to returns, while the underweight to technology detracted from relative performance. Positions in consumer discretionary and real estate also hurt returns, but these have since been sold. Capital preservation during the recent market rout has been assisted by the rise in the portfolio’s cash position.
While recent events have ensured SCIN’s near-term absolute performance has fallen into negative territory, longer-term absolute returns have been respectable. On a share price and NAV basis, the trust has made annualised total returns of 3.2% and 3.9%, respectively, over a five-year period, and 5.8% and 6.1% on a 10-year basis.
Exhibit 7: Share price and NAV total return performance, relative to indices (%)
|
One month |
Three months |
Six months |
One year |
Three years |
Five years |
10 years |
Price relative to MSCI AC World |
1.3 |
(6.2) |
(6.4) |
(9.8) |
(15.9) |
(15.2) |
(18.8) |
NAV relative to MSCI AC World |
6.6 |
(0.3) |
(1.0) |
(5.1) |
(12.6) |
(12.2) |
(16.8) |
Price relative to MSCI UK All Cap |
6.3 |
5.6 |
2.6 |
4.0 |
2.7 |
15.2 |
17.3 |
NAV relative to MSCI UK All Cap |
11.8 |
12.3 |
8.6 |
9.5 |
6.7 |
19.2 |
20.2 |
Source: Refinitiv, Edison Investment Research. Note: Data to end-March 2020. Geometric calculation.
|
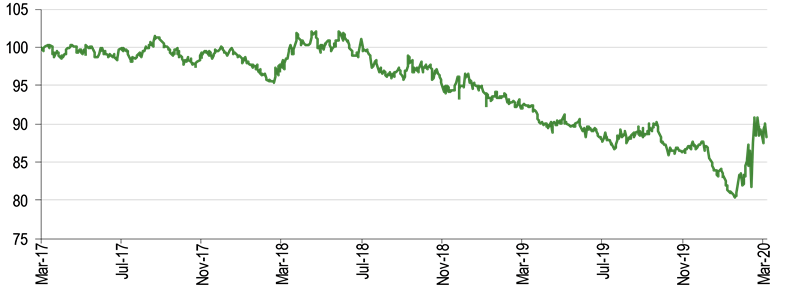
Exhibit 8: NAV total return performance relative to MSCI AC World index over three years |
|
|
Source: Refinitiv, Edison Investment Research |
Discount: Wider in unusual market conditions
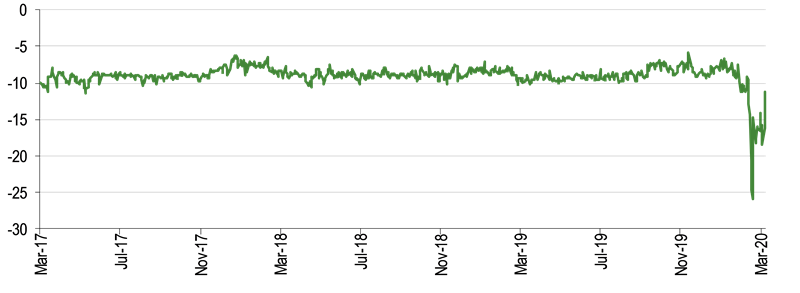
As at 21 April 2020, SCIN’s shares traded at a discount of 11.7% to cum-income NAV (with debt at market value). In normal market conditions, the board has a policy to manage the discount actively through share buybacks, with the aim of keeping it below 9%. This policy has been effective over the longer term. Prior to recent market turbulence, the average discounts over the past one, three, five and 10 years stood at 9.3%, 9.0%, 9.7% and 9.9%, respectively.
The manager’s recent efforts to repurchase shares in line with the discount stabilisation policy have been hampered by high levels of market volatility, which make it difficult to control the price at which shares are repurchased. However, there is scope for the discount to narrow as and when market conditions stabilise. SCIN has also made significant efforts in marketing, especially through its website (www.thescottish.co.uk), with the aim of broadening its appeal to a wider range of potential investors.
|
Exhibit 9: Share price discount to NAV (including income) over three years (%) |
|
|
Source: Refinitiv, Edison Investment Research |
Capital structure and fees
SCIN is a conventional investment trust with a single share class. At 21 April 2020, there were 73.8m ordinary shares in issue. In normal market conditions, shares are repurchased regularly, up to 14.99% of shares in issue, to keep the share price discount to NAV to 9% or less. In FY19, 3.3m shares (4.2% of the share base at the beginning of the year) were repurchased, at a cost of £27.0m. In the previous year, 2.3m shares were purchased. Share repurchases so far in FY20 have been very limited, due mainly to recent market volatility.
The trust is geared via secured bonds issued with an initial maturity of 30 years (maturing 2030), with a fixed coupon of 5.75%. The book value of the debt at end-FY19 was £83.9m, representing a gross gearing of 12.4%. However, SCIN’s cash holdings at 31 March 2020 more than offset the borrowings, and net cash stood at 6.3%. SCIN is a self-managed investment trust so it does not pay management fees. Regular recurring expenses for FY19, including staff costs and directors’ and professional fees, were £3.9m vs £3.8m in FY18. The trust is one of the lowest-cost funds in the AIC global universe, with ongoing charges of 0.58%.
Dividend policy and record
SCIN aims to deliver annual dividend growth greater than the rate of UK inflation, and it has achieved this goal for 36 consecutive years. It pays dividends quarterly, in May, August, November and February, and payouts have often been supplemented by a special dividend, subject to portfolio income. In FY19 the regular dividend was 22.8p, up from 21.2p in FY18 and 20.0p in FY17. The trust also paid a special dividend, which rose very significantly, to 7.45p, versus the FY18 special dividend of 4.0p, and 5.0p in FY17. Thus the total dividend for FY19 increased by 20%, to 30.25p.
For the current financial year ending 31 October 2020, the board has stated that its target is to declare three quarterly interim dividends of 5.7p and to recommend a final dividend of at least 5.7p for approval by shareholders at the AGM in 2021. The board has indicated that the final dividend will be reviewed in accordance with its desire to continue the long track record of annual dividend increases and SCIN’s aim of providing dividend growth ahead of UK inflation over the longer term. Given the trust’s record of dividend growth, and the fact that as at end-FY19, it had revenue reserves amounting to 70.5p per share, up from 63.8p per share in FY18, SCIN appears capable of building on its long-term record of ordinary dividend growth even if portfolio income is lower year-on-year. Based on the current share price and the FY19 total dividend, SCIN’s current yield is 3.2%.
Peer group comparison
SCIN is a constituent of the Association of Investment Companies’ Global sector, which contains a diverse group including some of the largest and longest-established investment trusts, many of which follow a more growth/momentum-focused strategy than SCIN. To give a more meaningful comparison of SCIN’s performance against its true peers, the table below shows a selection of value-orientated strategies from various sectors including the AIC Global, UK All Companies, UK Smaller Companies, UK Equity Income, Europe and Flexible Investment categories. It shows that SCIN’s performance has comfortably beaten the average of this value peer group over one, three, five and 10 years on an NAV total return basis, ranking either second or third out of 12 funds over these periods, with solid positive absolute returns over five and 10 years.
The trust’s ongoing charge of 0.58% is among the lowest in its peer group and is very competitive for an active manager. Additionally, it does not charge a performance fee. Its 4.4% dividend yield is slightly above the average for the value peer group. SCIN’s discount to NAV is the second-widest among its peers. It is presently ungeared on a net basis.
Exhibit 10: Selected ‘value’ style investment companies as at 21 April 2020*
% unless stated |
Market |
NAV TR |
NAV TR |
NAV TR |
NAV TR |
Ongoing |
Perf. |
Discount |
Net |
Dividend |
The Scottish Investment Trust |
521.9 |
(6.0) |
(4.1) |
28.1 |
97.6 |
0.6 |
No |
(11.9) |
100 |
4.4 |
Aberforth Smaller Companies |
747.6 |
(29.9) |
(28.8) |
(14.4) |
83.3 |
0.8 |
No |
(8.4) |
99 |
3.8 |
AVI Global Trust |
643.5 |
(16.8) |
(2.8) |
24.0 |
69.2 |
0.9 |
No |
(10.9) |
107 |
2.8 |
Bankers |
1,117.9 |
(1.3) |
20.7 |
47.7 |
148.6 |
0.5 |
No |
(0.1) |
100 |
2.4 |
EP Global Opportunities |
101.2 |
(13.6) |
(1.8) |
14.2 |
68.2 |
0.9 |
No |
(11.4) |
100 |
2.4 |
Fidelity Special Values |
493.1 |
(32.5) |
(25.3) |
(7.9) |
60.8 |
1.0 |
No |
(2.1) |
103 |
4.3 |
Law Debenture Corporation |
567.3 |
(17.9) |
(6.6) |
7.2 |
101.2 |
0.3 |
No |
(1.6) |
108 |
5.4 |
Lowland |
241.0 |
(27.2) |
(26.4) |
(15.5) |
93.6 |
0.6 |
Yes |
(8.3) |
113 |
6.7 |
Majedie Investments |
115.1 |
(21.4) |
(14.5) |
0.2 |
37.5 |
1.0 |
No |
(7.9) |
111 |
5.3 |
Miton Global Opportunities |
59.6 |
(19.4) |
(10.8) |
20.1 |
62.3 |
1.4 |
Yes |
(4.4) |
100 |
0.0 |
Temple Bar |
454.7 |
(41.8) |
(32.7) |
(27.2) |
28.8 |
0.5 |
No |
(7.7) |
110 |
7.6 |
Value And Income |
88.1 |
(22.7) |
(17.3) |
(10.1) |
47.1 |
1.3 |
No |
(14.9) |
128 |
6.3 |
Average (12 funds) |
429.2 |
(20.8) |
(11.8) |
5.5 |
74.9 |
0.8 |
(7.5) |
107 |
4.3 |
|
SCIN rank in group |
5 |
2 |
2 |
2 |
3 |
9 |
11 |
9 |
6 |
Source: Morningstar, Edison Investment Research. Note: *Performance to 20 April 2020 based on ex-par NAV. TR=total return. Net gearing is total assets less cash and equivalents as a percentage of net assets (100 = ungeared).
The board
SCIN’s board is chaired by James Will, who is the longest serving of five independent, non-executive directors. He joined the board in 2013 and was appointed chairman in 2016. Jane Lewis and Mick Brewis joined the board in 2015, while Karyn Lamont, who chairs the audit committee, was appointed in 2017. Neil Rogan is the board’s newest member, having been appointed in September 2019. The directors have professional experience in fund management, corporate law and accountancy. Russell Napier stepped down at the February 2020 AGM.
|
|
Investment Companies
Research: Metals & Mining
In recent weeks Alkane has announced drilling results from its Boda prospect in the Northern Molong Porphyry Project, a maiden (inferred) resource at its Roswell and San Antonio prospects south of Tomingley and its interim results. In addition, Export Finance Australia (Australia’s export credit agency) has confirmed its interest in participating in the financing of Alkaneâs Dubbo rare earth project in Central West New South Wales. Each has the ability to add to our valuation of Alkane, although by far the largest in terms of magnitude are the drilling results from Boda.