“Edison is the go-to for a new investor to get full understanding of the investment case and business. Edison’s distribution reaches investors that we want to connect with directly.”
Private equity (PE) has established itself as an important asset class for institutional investors globally (to which they often allocate c 5–15% of their portfolios), as it provides access to actively managed, attractive companies not accessible through public markets. Investors can gain exposure to private equity by investing in a number of listed entities that invest in private companies globally. We calculate that the UK-listed private equity investment companies delivered a compelling weighted average net asset value (NAV) per share total return of close to 15% pa over the 10 years to end-2021 in sterling terms and are trading at wider than usual discounts to NAV.
Broadening the investible equities universe
PE managers are flexible in terms of selecting the most promising (sub)sectors of the economy and can therefore focus on companies benefiting from transformative, secular trends such as digitalisation and automation, changing consumer preferences with respect to nutrition, ageing society, leisure and learning or decarbonisation. This flexibility is because they typically have vast deal origination networks and are not limited by any pre-defined sector allocation restrictions and consider the public equity market as a broad reference point rather than strict benchmark. At the same time, businesses increasingly opt to stay private for longer, while the number of listed companies has not been expanding in recent years. Consequently, qualified investors ignoring PE potentially miss out on an attractive investment universe, especially in the small- and mid-cap range.
Active ownership supporting attractive returns
While relatively high leverage remains an inherent part of PE investment strategies, which results in incremental investment risk, particularly as interest rates increase sharply, the industry has matured over the last few decades and PE managers have focused increasingly on the operational improvement of portfolio holdings. PE’s active ownership model is often facilitated by extensive in-house experts (value creation teams) with a hands-on approach to improving the value of private companies (both organically and through M&A) based on a well-tested playbook. Accordingly, sector expertise is becoming a key differentiator within the industry.
Listed PE trading at wide discounts to NAV
Most UK-listed PE companies are trading at 30–40% discounts to their last reported NAV, well above the historical average of c 20%. PE portfolios have so far been marked down modestly despite the sharp sell-off in the broader public markets, which is likely a function of their composition, but also prevailing valuation techniques (therefore we cautiously compare private and public equity performances to end-2021 rather than last available figures). While persistent macroeconomic risks, weaker M&A volumes and buyout debt availability could put pressure on PE valuations in the near term, we believe that the entry point for long-term investors in listed PE has become more attractive, especially given that PE managers tend to value their portfolios conservatively and historically have often realised significant uplifts to previous carrying values upon exits.
PE-backed companies: An underexplored opportunity
Companies stay private longer, listed universe is stagnant
The investment universe of listed equities in terms of the number of companies listed on the New York Stock Exchange (NYSE) and Nasdaq has been broadly flat over the last 10 years and in the longer term has declined from 6,177 in 2001 to 4,805 in 2021, according to PitchBook. Moreover, the share of the largest listed companies has increased over time, as illustrated by the aggregate weight of the top10 constituents of the CRSP US Total Market Index of c 22% at end-December 2022 versus c 16% at end-2012. At the same time, companies can stay private for longer and reach a greater scale because of better access to private capital, as global PE assets under management (AUM) increased from c US$0.6tn in 2001 to US$7.6tn in June 2022 (with c US$745bn raised in 2021 alone, according to Preqin data. PE-backed companies can focus on optimising long-term positioning without the need to deliver on short-term public investor expectations in terms of quarterly results. By staying private, they also avoid the costs associated with being a public company. The growing maturity of PE-backed companies is reflected, among others, in the increasing size of companies sold by PE investors, with the median US and European exit size at US$447m and €160m in 2021 respectively versus US$160m and €77m in 2007 respectively (according to PitchBook). Nevertheless, the size of an average PE-backed company remains in the range of listed small caps and therefore often offers superior earnings growth potential compared to larger listed companies.
As a result, the market capitalisation of US PE-backed companies has been growing faster than that of their public peers over the last 20 years and represented 6.3% of the US public equities market cap in 2021 versus 2.0% in 2001 (12.4% and 4.8% respectively for PE- and venture capital (VC) backed companies combined), according to PitchBook’s Q3 2022 Quantitative Perspectives report. Similarly, global PE NAV grew 14 times between 2000 and 2020 versus a fourfold increase in the market capitalisation of global public equity, according to McKinsey.
Exhibit 1: Number of PE-backed and growth-backed companies versus US-listed companies
Source: PitchBook Data, Inc. US-listed companies include domestic firms publicly listed on NYSE and Nasdaq.
Exhibit 2: US PE-backed market cap versus public equity market cap
Source: PitchBook Data. Note: PE-backed companies include buyouts and growth equity investments
PE funds as a gateway to unlisted companies
Top PE managers can tap into the wide opportunity universe of private companies thanks to their vast origination networks, including, among others, the expertise in acquiring businesses from founders and families (see eg Deutsche Beteiligungs, DBAG), as well as access to off-market deals. They are often patient investors, tracking attractive acquisition targets for many years before investing. PE investors also monitor the public equities space, seeking underappreciated companies, which they can take private. Between 1 January 2006 and 1 December 2022, there were 1,607 PE-backed public-to-private deals with an aggregate value of close to US$2.0tn in North America and Europe, according to PitchBook data (the figure is likely much higher if non-PE acquirers are included).
Consequently, qualified investors ignoring PE potentially miss out on a significant investment universe, especially in the small- and mid-cap range, including several niche subsectors that are hardly accessible through public markets. PE investments, which normally have a horizon of three to five years, capture a greater share of value accretion by successful companies as they typically go public at a later development stage, often during bull markets to take advantage of high valuations.
Growing allocation to PE from institutional investors
Institutional investors have already recognised the PE opportunity, steadily increasing their exposure to the asset class over the last decade and at higher average target allocations, both as limited partners (LPs) in PE funds and co-investors alongside PE managers (general partners or GPs). This is likely to continue in the long term, given that most institutional investor groups (insurance companies, private sector pension funds, sovereign wealth funds, endowments and foundations) still remained below their allocation targets at end-2021, according to McKinsey’s Global Private Markets Review 2022. Institutional investors usually target a c 5–15% exposure, depending on the investor type (eg private and public pension funds normally target a 7–8% allocation to PE) and according to Bain & Co’s mid-year 2022 report, PE LPs have consistently signalled that their intent is to maintain or increase PE allocations.
In the short term however, the ‘denominator effect’ due to declines in public valuations so far outpacing markdowns on PE investments have increased the latter’s share in LP portfolios and therefore discouraged many institutional investors from making new investment commitments[1] to PE recently. That said, US PE fund-raising remained robust in 2022 at US$343.1bn (vs US$362.9bn in 2021), although it slowed down markedly in Europe to €52.8bn vs €106.8bn in 2021, according to PitchBook. At end-2022, US and European PE dry powder (ie capital committed but not yet invested) as a percentage of total AUM stood at 30% versus a 2012 to 2021 average of 38% in the US and 39% in Europe, according to our calculations based on PitchBook data. In absolute terms, dry powder has increased markedly in recent years with close to US$790bn in the US at end-2022 (vs US$612bn in 2017 and US$334bn in 2012) and c €260bn in Europe (vs €230bn in 2017 and €129bn in 2012).
Unlisted PE funds less liquid and reserved for investors with deeper pockets
Investments as LPs in top PE funds or as co-investors alongside them are normally reserved for the above-mentioned institutional investors, as well as accredited high-net-worth individuals (HNWIs) and are subject to high minimum ticket sizes (often at several million US dollars or more), so are beyond the reach of an average retail investor. LP positions in unlisted, closed-end PE funds are also relatively illiquid investments, which are locked until a fund completes its fund-raising-investment-realisation cycle (which may take c 10 years). Capital deployment may take several years to complete and the average holding period of individual companies (as mentioned above) is c three to five years. PE fund investments may be sold in the secondary market, which has become much deeper over the last 20 years with the global traditional LP deal volume (ie excluding GP-led transactions) at US$72bn in 2021 vs US$25bn in 2011, according to GreenHill & Co (LP-led secondaries reached c US$56bn in 2022, according to Jefferies). However, we note that most of the time, PE secondaries can only be sold at a discount to last carrying value. Finally, while prospects for private assets tokenisation are very promising (as illustrated by a recent report from the Boston Consulting Group and ADDX or KKR’s recent move to offer tokenised exposure to one of its funds), it is at an early development stage.
[1] LPs commit a certain amount of capital that they will invest in a given PE fund. Subsequently, they receive capital calls from the fund to deploy the committed capital into PE investments.
Enter listed PE
Fortunately, a range of listed PE companies are available on the London Stock Exchange (LSE), as well as exchanges across continental Europe, which provide investors with a convenient route to gain exposure to PE investments across the US, the UK and continental Europe managed by top global GPs (moreover, some of the major PE asset managers are listed in the US and Europe). As their shares can be bought in much the same way as any other listed equity (though in some cases subject to an investor having access to the LSE’s Specialist Fund Segment), they represent a liquid investment with a low minimum ticket size. These listed PE companies are evergreen vehicles without a specified maturity (though they may be subject to continuation votes) and thus provide investors with flexibility in terms of the holding period. They are normally closed-end investment funds or public limited companies (rather than open-end funds), that is structures that are aligned with the illiquid nature of PE. They constitute a sizeable investment universe, with companies included in The Association of Investment Companies (AIC) specialist PE sector having a combined market capitalisation of £26.3bn (at 6 February 2023, or £10.3bn excluding 3i).
Exhibit 3: Market cap in £m (LHS) and discount to last reported NAV (RHS)
Source: Refinitiv, company data, Edison Investment Research at 10 January 2023 to 6 February 2023. Note: *Not a member of the AIC PE sector.
Exhibit 4: Reasons to invest in PE by Paul Daggett, Neuberger Berman
Source: Edison Investment Research
‘Private’ offers competitive returns to ‘public’
PE constitutes a compelling addition to a listed equities exposure as it broadens the investable equities universe in terms of attractive subsectors and companies. While PE’s long-term outperformance of public markets has been the subject of fierce debate for many years (especially for post-2005 vintages in the US),[2] some most recent studies suggest that PE returns may indeed have been ahead of public equities. US PE (as measured by the Cambridge Associates’ US Private Equity Index, covering buyout and growth equity funds) delivered a 10- and 20-year horizon pooled return (net to LPs) to end-2021 of c 18.5% and c 14.7% pa respectively, which is ahead of the returns of the modified public market equivalent (mPME) indices calculated by Cambridge Associates based on listed US small caps (c 14.3% and c 9.9% respectively), as well as the mPME index based on the MSCI All Country World Index (c 13.0% and 8.7% gross return respectively). Similarly, Cliffwater (an independent investment adviser and asset manager) recently estimated that PE allocations of US state pensions delivered an 11.0% return pa (net of fees) over the 21 years to end-June 2021 compared to 6.9% pa for public stocks (defined as 70% US equities, including both large and small caps, and 30% non-US equities represented by the MSCI ACWI ex US Index).
The LSE-listed PE companies universe performed broadly in line with the MSCI World Small Cap Index over the 10 years to end-2021, with the weighted average NAV total return (TR) at an attractive 14.3% pa, similar to an average share price TR of 14.3% for the public index (see Exhibit 5). At the same time, the NAV TR of the listed PE sector significantly outperformed the UK All-Share Index TR of 7.7% pa. Listed PE companies have considerably outperformed both public indices over a five-year period based on their NAV TR. We examine the performance to the end of 2021 rather than the latest 2022 figures to avoid any distortion stemming from a PE valuation approach. We also note that this performance comparison does not cover the 2007–09 global financial crisis (GFC), when a few listed PE companies suffered from excessive leverage at holding level and/or elevated overcommitment ratio. Having said that, we do include companies that were winding down during the period. Finally, we excluded 3i from our calculations given its much larger NAV compared to other listed PE companies, quite concentrated portfolio and the fact that it is both a PE investor and asset manager (NAV TR including 3i was higher across all horizons).
Exhibit 5: TR NAV performance of UK-listed PE companies versus public equity indices to end-2021 in sterling terms
Source: Refinitiv, Morningstar, company data, Edison Investment Research. Note: Three-, five- and 10-year returns annualised. Calculated as average annual returns weighted with prior-year end net asset value for the following companies: abrdn Private Equity Opportunities, Apax Global Alpha, Candover Investments, CT Private Equity Trust, Dunedin Enterprise, Electra Private Equity (currently Unbound Group), HarbourVest Global Private Equity, HgCapital Trust, ICG Enterprise Trust, JPEL Private Equity, LMS Capital, NB Private Equity Partners, Northern Investors Company, Oakley Capital Investments, Pantheon International, Princess Private Equity, SVG Capital and Symphony International Holdings.
We acknowledge that the above relative performance summary is subject to certain differences in risk profiles. Therefore, according to Cliffwater, most US state pension systems have a PE objective to outperform public equity by a given percentage point amount, most frequently set at 300bp net of fees. PE outperformance is at least in part driven by higher leverage applied to underlying private companies versus the average indebtedness ratios of public companies. This is particularly important in the current rising rate environment, though we think that this does not necessarily translate into higher risk in a linear way (for a discussion around the risks of high interest rates and increased leverage, see section ‘High leverage remains inherent to PE’ for details). We also note that at least some part of the excess return may be considered a reward for lower investment liquidity (ie an ‘illiquidity premium’), though this does not apply to investors in listed PE companies.
Still, we consider the historically achieved PE returns attractive. Going forward, heightened competition across the maturing PE space may compress industry wide average returns. As a result, it is becoming more important to prudently select top-performing GPs with a competitive edge, such as sector expertise (with trade buyer-like competencies), focus on a narrow set of themes, a well-defined playbook or ability to leverage the scale of operations (as outlined by Bain & Co in its 2020 Global Private Equity report). PE funds with a clear focus on the somewhat less crowded mid-market could also be an interesting choice.
At the same time, it is worth keeping in mind that the performance of the broad US public equity market has, in recent years (until end 2021), been ahead of the long-term average, particularly driven by a narrow set of large tech stocks and partly associated with a global flight away from Europe given a number of headwinds (Brexit, concerns over potential sovereign defaults in southern Europe, recession fears in Germany before COVID-19, etc). Therefore, the stellar performance of US public stocks until end 2021 may be difficult to sustain over the long term, as illustrated by the sharp de-rating of some of the US ‘big tech’ stocks during the bear market in 2022. We believe that this makes PE a compelling option to diversify an investment portfolio beyond listed large-cap equities.
For individual PE investments, GPs normally target a gross multiple of invested capital (MOIC) of at least 2.0x (corresponding to a gross internal rate of return (IRR) of c 20%), with the median multiple for global buyouts fully realised in 2009–2021 with more than US$50m of invested capital at 2.2x, according to Bain & Co. Some UK-listed PE companies were able to beat this rate of return. For instance, HGT reported a 2.6x average MOIC and 26% gross IRR on realisations over the 10 years to Q322.
In the current tough environment, it is worth noting that ‘crisis vintages’ historically outperformed other PE vintages (eg the median global buyout IRR for the 2009 vintage was 24% vs 9% for both 2007 and 2008 vintages, according to DealEdge). Moreover, US buyout and growth vintages from the 1989–1991 period (when inflation was elevated) performed better than the 1986–88 vintages (posting a median deal IRR of 21%, 29% and 46% vs 22%, 13% and 12% respectively, according to DealEdge). While this may be somewhat less relevant for listed PE companies (whose portfolios represent a blend of different vintages), it clearly illustrates that those who have a good level of dry powder can seize attractive investment opportunities during tougher economic periods. Even fully invested PE companies can benefit from softer valuations if their portfolio companies can seize the opportunities to perform many bolt-on acquisitions at attractive prices. This does not mean that the short-term performance of PE will be entirely immune to higher discount rates, higher debt funding costs and lower public market valuations (see sections ‘PEs tend to value their portfolios conservatively, but markdowns are possible in the near term’ and ‘High leverage remains inherent to PE’ for details).
Value creation through an active ownership model
The PE industry has matured over the last 30–40 years with more emphasis on operational improvements to drive returns. In The Advantage of Persistence, published in February 2008, the Boston Consulting Group and IESE Business School outlined four eras of PE development:
Leverage (1980s) – when leverage accounted for roughly half of the value realised by PE companies followed by c 31% from multiples arbitrage and only 22% from operational improvement.
Multiple expansion (1990s) – when multiple arbitrage accounted for 46% of value versus 32% leverage and 22% operational improvement.
Earnings growth (2000s) – when operational improvement became more important as a source of realised returns (36%), with multiples arbitrage at 39% and leverage at 25%.
Operational improvement (which started in 2010s) – when improvements to a company’s underlying operations took over as the major source of value uplift.
PE funds normally acquire controlling or at least ‘influential’ minority stakes in private companies, which allows them to foster positive strategic and operational changes of its portfolio holdings. While it is difficult to precisely estimate what part of the generated returns are attributable to PE’s active ownership model, we consider it a distinct advantage of PE investment companies over most public equity funds (as well as passive minority investments in private companies). This applies especially to PE companies with internal value creation teams, which prove useful during both economic expansion and downturn. The latter is illustrated by a McKinsey study, according to which PE funds with value creation teams generated an IRR of 23% for the ‘recession-era’ vintages of 2009–2013 compared to just 18% reported by funds with no value creation teams. We also note that a focus on a narrow set of well-known subsectors is becoming ever-more important, especially as valuations of leading high-quality private companies tend to be elevated and more resilient to market downturns (requiring additional value creation efforts to realise the targeted return).
Value creation team: An ‘in-house consulting agency’
PE value creation teams are diverse groups of experts, including senior investment professionals, buy-side research analysts and data scientists, who act as a kind of ‘in-house consulting agency’, but with a better alignment of interests than external consultants given PE’s vested interest as a major shareholder. Value creation teams are often organised as teams of functional experts, each focused on a certain area of operational improvement (eg digitalisation, supply chain management, working capital management). They frequently also include dedicated ESG analysts responsible, among others, for (1) deal screening (based on the GP’s exclusion list), (2) ESG due diligence, (3) ESG on-boarding management, (4) setting sustainability targets for portfolio companies, (5) monitoring progress in implementing ESG principles through a set of key performance indicators (KPIs, see for instance the ESG dashboard of Partners Group), and (6) participating in the realisation committee and vendor due diligence process upon exit.
A good example is Hg (the investment manager of HGT), which has a value creation team specialising in software and tech-enabled businesses, consisting of over 50 senior operational specialists (each supported by a network of trusted third-party associates and partners) working with Hg’s portfolio management teams to execute value creation projects. The team’s core focus areas include growth, data analytics, mergers and acquisitions (M&A), responsibility, talent and technology.
Support from Hg’s value creation team may take different forms, including (1) co-owning and directly driving specific initiatives in the portfolio company, (2) mentoring senior executives, 3) leading the recruitment of senior executives (with 66 C-suite and board placements led by Hg’s talent team over the last three years), or (3) fostering collaboration between management teams across portfolio companies.
The team continuously converts its project experience (gathered based on more than 5,000 man hours per annum) into ‘playbooks’ of value enhancement best practices, which are increasingly being embedded in Hg’s proprietary software tools and services, allowing for a swift implementation in newly acquired portfolio companies.
‘We conduct value creation diagnostics upfront, benchmarking a company’s operational maturity against our database of KPIs and best practices, to identify the highest potential projects to pursue. We then support the company in building a value creation plan to help achieve those enhancements. As part of this planning we identify where our IP and experts can help the company sharpen and accelerate their improvements.’ Christopher Kindt, Head of Value Creation, Hg
Multi-faceted activities to drive value
PE managers tackle a wide range of value creation areas (with some of them illustrated in Exhibit 6), covering both organic improvements and acquisitions.
Exhibit 6: Selected value creation areas of PE managers
Source: Edison Investment Research
With respect to M&A, a particularly popular PE approach is the so-called ‘buy-and-build’ strategy, which involves the execution of several smaller, bolt-on acquisitions to an existing ‘platform’ investment. This is either aimed at consolidating a fragmented market or acquiring/expanding key capabilities of the ‘platform’ company. Importantly, it allows the PE investor to ‘blend down’ the acquisition multiple of the platform investment (as bolt-on acquisitions are often performed at lower valuation multiples than the platform company). This means that a PE fund can accept a higher price for the platform (in anticipation of add-on acquisitions) while still achieving its target returns. The platform company in turn benefits from the PE investor’s expertise in terms of deal sourcing, due diligence, deal structuring, integration of acquired businesses etc. PE’s increasing interest in the ‘buy-and-build’ strategy is illustrated by the rise in the share of add-ons in the total US buyout deal count to 72.4% in 2021 from 50.7% in 2007 (with a total of 5,362 add-ons completed in 2021, according to PitchBook).
Case study – Princess Private Equity Holding’s investment in GlobalLogic
In August 2018, Princess Private Equity Holding (PEY) invested (alongside other funds managed by Partners Group, which acted on behalf of its clients) in GlobalLogic, a US software development company providing experience design and digital engineering services. Key investment criteria identified by Partners Group at the time of acquisition included: (1) strong industry tailwinds in the form of corporate investments in digital transformation and IT services, (2) durable financials with high revenue visibility (top- and bottom-line growth of c 20% at a margin of c 20%, key accounts providing 88% visibility of 2019 budget, a 110%+ net dollar retention rate) and (3) solid organic growth with c 88 accounts added annually coupled with the strengthening of relationships within existing accounts.
Partners Group embarked on several operational improvement initiatives, outlined in Exhibit 7. These included, among others, the diversification of the customer base, scaling the company’s operations, expanding its software as a service (SaaS) capabilities and pipeline, hiring key management personnel and completing four add-on acquisitions, of which three were in Europe. These measures helped the company grow its EBITDA from US$105m in FY18 to US$219m in the 12 months to end-March 2021 (a CAGR of 28%). PEY agreed the sale of its stake in GlobalLogic in March 2021 to Hitachi, generating an impressive MOIC of 5.3x and IRR of 76% on its investment. See here for a summary from Partners Group.
Exhibit 7: Value creation case study from Partners Group – GlobalLogic
Source: Princess Private Equity
Case study – Georgia Capital’s investment in Georgia Global Utilities
In 2014, Georgia Capital (CGEO) invested in a 25% stake in Georgia Global Utilities (GGU), which owns water utility operations covering a regulated monopoly in Tbilisi and the surrounding area, providing water and wastewater services to 1.4 million residents (more than one-third of Georgia’s population) and c 38,000 legal entities. Additionally, GGU operates hydro-power plants with an aggregate capacity of 149MW. CGEO acquired the remaining 75% stake in 2016.
Over 2017 to 2019 (under CGEO’s ownership), GGU embarked on an extensive capital expenditure agenda to develop new, and upgrade existing, water and wastewater utility infrastructure. This allowed the company to realise significant operating efficiencies, including a reduction in the consumption of self-produced electricity by c 45% or c 135GWh from 2015 to 2021, freeing capacity for market sales (GGU’s energy revenue grew at a 17.9% CAGR over 2014–2021). These investments also translated into an increase in the regulatory asset base, which enhanced the earnings potential of the business amid the new 2021–23 water tariffs that the local regulator approved in December 2020. The new tariffs assumed a return on investment of 14.98% (with reference to GGU’s regulatory asset base), in line with the business’s mid-term target return on invested capital of 13–15%.
Capital expenditures in the water utility business declined to more normalised levels in 2019, contributing to positive free cash flow generation. GGU also successfully issued a US$250m five-year green bond with a 7.75% coupon in July 2020 (of which US$155m was allocated to the water utility operations), despite the turmoil caused by the pandemic. These bonds were subsequently redeemed in 2022. From the acquisition of the initial 25% stake in GGU in 2014 to 2021, the business posted revenue and EBITDA CAGRs of 7.4% and 12.8% respectively. At the same time, the EBITDA margin improved from 44.8% in 2014 to 62.9% in 2021 (see Exhibit 8).
On 31 December 2021, CGEO announced it had agreed to sell an 80% stake in its water utility business to FCC Aqualia for a US$180m cash consideration, achieving a solid MOIC of 2.7x (of which 2.2x realised) and a c 20% IRR in US dollar terms (3.6x and 27% in GEL terms, respectively). This includes GEL97m dividends collected by CGEO throughout the investment period.
Exhibit 8: Water utility business’s revenue and EBITDA margin
Source: Company data, Edison Investment Research; Note: *If the new water tariffs were applied retrospectively, the water utility business’s total revenue and EBITDA margin in 2020 would be GEL174m and 56.6%, respectively.
Exhibit 9: Valuation of CGEO’s water utility business throughout the investment cycle
Source: Company data. Note: *The equity value reflects the combined cost of the 25% stake acquired in 2014 and the 75% stake acquired in 2016. The EV/EBITDA multiple represents the multiple implied by the acquisition price of the 75% stake in 2016
More flexible approach to sector allocation
We believe that PE investment companies are a good portfolio diversifier in terms of sectors for two reasons. Firstly, they provide access to a different investment universe within a given sector. A good example is HGT, which is focused on investing in businesses offering SME software solutions with a high share of SaaS-based recurring revenues, whose defensive growth profiles make HGT an interesting alternative (or complement) to the listed ‘big tech’ exposure. Secondly, PE managers are not bound by any pre-defined sector allocation, hence they consider public equity indices as a reference point to a limited extent – and do not treat them as a strict benchmark for capital allocation purposes. This allows them to focus on the most promising (sub)sectors, including those with exposure to transformative, secular trends such as digitalisation and automation (eg mission-critical B2B IT software and services), changing consumer preferences with respect to nutrition, ageing society, leisure and learning, sustainability and energy efficiency and so on (see for example NB Private Equity’s (NBPE’s) focus on two core themes shown in Exhibit 10).
Exhibit 10: NBPE’s approach to its two core themes
Source: NBPE
The above is well illustrated by the fact that UK-listed PE companies are on average overweight technology companies (several of them even since before the pandemic) compared to, for example, the S&P Small Cap 600 Index, the combined IT and communication services weight of which has remained at 15–17% since 2015. Some listed PE companies are specifically focused on tech and tech-driven sectors such as HGT (tech and tech-enabled services), OCI (tech, consumer and education) and APAX (tech, services, healthcare and consumer). PIP and HVPE have a fair share of VC/growth equity investments in their portfolios (which are often skewed towards tech companies) and historically had a technology, media, and telecommunications (TMT) exposure well above 20% (currently even in excess of 30%). NBPE’s TMT exposure has been above 20% for many years now as well. APEO increased its tech allocation from c 10% in FY16 to 14% in FY19 and is 20% currently. ICGT’s TMT exposure increased from 6% in FY16 to 12% in FY19 and is 23% currently. This reflects a broader trend in the PE space (eg the share of IT in US PE deal values stood at 15–30% in each of the respective years between 2016 and 2021, according to PitchBook).
Similarly, several UK-listed PE companies are overweight healthcare versus the S&P Small Cap 600 Index (for which the weight has been c 11–12% in recent years). For instance, PEY has 22% of its current portfolio in healthcare (predominantly healthcare services companies: eyecare services, veterinary practices, outpatient physical therapy, dermatology practices etc), which provides a favourable combination of secular growth and ‘buy-and-build’ opportunities. Some other players with high healthcare exposure include PIP (18%), APEO (22%) and APAX (20%).
Listed PE companies have the flexibility to change their sector exposure over time as they deem fit. However, we note that the speed of adjustment differs by PE strategy, with direct PE companies and those focused on co-investments (eg NBPE) able to do it faster, while changes in PE fund-of-fund portfolios are much more gradual.
Buyouts complemented by other private asset classes
The core strategy pursued by listed PE companies are buyouts (ie acquisitions of majority (or sometimes ‘influential’ minority stakes) in more mature, usually profitable private companies which overall perform well but where the PE manager identified scope for value creation). However, portfolios of listed PE companies also include a varying degree of exposure to other strategies involving investments in private companies:
VC –minority investments in earlier-stage businesses (especially tech companies), many of which are yet to break even or are even proof-of-concept (ie pre-commercial) stage.
Growth equity (sometimes called expansion capital) – sits somewhere between VC and buyouts and involves providing capital to accelerate the growth of a company whose products/services have already established themselves in the market (ie are commercially viable). Like VC, it usually involves the acquisition of a minority stake, which however is often larger and alongside fewer other private investors compared to VC.
Special situations/turnaround – involves investments in troubled companies requiring an operational turnaround.
Private debt – some listed PE companies also provide debt to private companies as part of their investment mandates.
Interestingly, buyouts slightly outperformed venture capital and growth equity investments over the last 10 years to end-June 2022, based on Preqin data (see Exhibit 11).
Exhibit 11: Pooled horizon IRR by strategy
Source: Preqin Ltd. Note: As at end-June 2022.
Three of the UK-listed PE companies have a meaningful exposure to VC and growth investments: HVPE (36% at end-December 2022, see Exhibit 12), PIP (21% in growth capital and 3% in VC at end-December 2022) and Literacy Capital (BOOK) (c 5% of direct portfolio in growth investments at end-December 2022). Several companies also have notable allocations to complementary strategies, such as private debt or infrastructure investments (APAX, 3i Group (III), HVPE, NBPE, OCI). Special situations are rarely a significant part of portfolios, with PIP at 7% and PEY at 6%. Outside the UK, there are also turnaround specialists, such as the Frankfurt-listed Mutares.
Exhibit 12: Portfolio breakdown of UK-listed PE companies into buyout, VC/growth, special situations, private debt and other
Source: Company data, Edison Investment Research; Note: based on the latest reported data. The chart presents all companies from the AIC PE sector except for companies in realisation phase (Dunedin Enterprise and JPEL Private Equity), companies in the process of portfolio transition (LMS Capital) and for which data are not available (CPTE, Symphony International Holdings). We have also included Georgia Capital given its focus on PE opportunities in Georgia. *‘Private debt and other’ for 3i Group includes exclusively infrastructure investments. Please note that some of the companies for which no private debt exposure is shown in the above exhibit may still have some minor exposure to the strategy through loans provided to companies in which they hold an equity stake.
We believe that an important advantage of several listed PE companies is their high exposure to small/mid-market buyouts. These often involve companies that were not owned by PE before and therefore represent low-hanging fruit in terms of value creation (frequently at a lower entry multiple than large/mega buyouts). Moreover, these investments are less dependent on IPOs as an exit route compared to large/mega buyouts and can be sold to a strategic investor or in a sponsor-to-sponsor deal more easily (especially given that large/mega funds have accumulated more dry powder in recent years than mid-market funds). Finally, we note that PE investors sometimes apply a lower leverage level to these investments, as illustrated by PIP’s portfolio exhibiting average debt to EBITDA of 4.4x for small and mid-sized management buyouts (MBOs) versus 5.3x for large/mega MBOs (as per PIP’s annual report 2022).
Exhibit 13: Investing in the PE mid-market by Alan Gauld, investment manager of APEO
Source: Edison Investment Research
Different strategies for listed PEs to gain exposure to private companies
Listed PE companies can choose from a range of PE strategies, which differ in terms of type of exposure (direct/indirect), degree of portfolio diversification, flexibility in capital deployment and fee structure (see Exhibit 14).
Exhibit 14: Comparison of listed PE strategies
Direct
Fund-of-funds
Co-investments
Portfolio concentration
90%+ of NAV normally covered by up to 50 companies; top10 representing 30–50% of NAV or more
500+ underlying investments; top10 holdings make up c 10% of NAV
Each co-investment normally represents 1–5% of NAV; a pure co-investment portfolio may have c 100 holdings with the top10 making up c 30% (see eg NBPE)
Investment manager(s)
Self-managed or one manager
Multiple managers; 50+ for more diversified strategies, fewer for high-conviction strategies (eg APEO’s 12 core GPs represent c 59% of NAV)
Each co-investment can be sourced from a different manager (eg NBPE’s co-investment portfolio covers 56 GPs)
Outstanding commitments to NAV
Low to medium
High (often in excess of NAV)
Low
Control over capital deployment
High
Medium
High
Control over exits
High
Low
Low
Fees
Single-layer, usually include a management fee of 1.0–1.5% pa and a performance fee of 15–20%
Two-layer: c 0.8–1.5% management fee (and in some cases also a performance fee) on top of fees charged by underlying GPs
Single-layer (co-investments alongside third-party GPs) or no fees (co-investments alongside own GP for some funds, eg HGT)
Source: Edison Investment Research
Direct PE investments
Direct investments in a private company can be made with the listed PE company’s investment manager acting as lead sponsor or co-leading the acquisition. The listed PE company may either invest as an LP in a private fund managed by its investment manager (eg HGT, PEY, OCI, APAX), usually covering c 10–30% of the total commitments of the fund, or directly from its balance sheet (eg CGEO, PEY). A direct PE strategy translates into a more concentrated portfolio (see Exhibit 14), often focused on the areas of the investment manager’s core competencies. It provides high control over capital deployment and realisations, requires a low to medium level of investment commitments as a percentage of NAV and is subject to a one-layer fee structure.
PE fund-of-funds
Fund investmentsinvolve positions as LPs in PE funds managed by third-party GPs. These may be obtained either through primary commitments (ie commitments to new PE funds during their fund-raising) or secondary investments (ie acquiring a position in an existing PE fund from another LP). PE fund-of-funds rely on the deal sourcing expertise, due diligence, value creation capabilities and the exit decisions of third-party GPs, which they carefully select and often establish long-term relationships with.
Fund-of-fund strategies normally translate into more diversified portfolios, which often can be considered a ‘one-stop-shop’ exposure to the PE universe, with individual private portfolio companies having only limited impact on the overall NAV TR. Fund-of-fund investments are subject to a two-layer fee structure (one layer at the listed PE company level, the second one at the underlying GP level), though some fund-of-funds do not charge any performance fee at their level (eg APEO).
A primary strategy requires a relatively high level of overcommitment for the company to stay fully invested given that the fund-raising and capital deployment process takes several years to complete. A secondary strategy on the other hand provides greater control over capital allocation to private companies (even if still lower than direct investments and co-investments) and helps mitigate the J-curve effect (as it mostly involves buying LP positions in funds that have at least partially deployed their dry powder). In some periods, it also provides an opportunity to invest in PE portfolios at discounted prices from distressed/forced sellers, though we note that good-quality assets are rarely available at wide discounts to carrying value. In H122 for instance, the average LP secondary buyout portfolio was priced at a 12% discount to carrying values, according to GreenHill’s recent global secondary market review. A specific subsegment of the PE secondary market are manager-led secondaries, which involve the acquisition of selected PE-backed businesses through a fund structure. These are normally high-quality businesses which the managers know well and believe have good potential to grow in value beyond the life of their fund (see below for details).
Direct PE co-investments
Direct co-investments involve a minority direct investment made alongside the lead sponsor (ie outside of a fund managed by the lead sponsor). This strategy has become more popular in recent years as GPs pursue larger acquisition targets while at the same time seeking to stay within their single-asset exposure limits. Moreover, they often consider co-investments as a means to deepen the relationships with key institutional LPs. For listed PE fund-of-funds, this supplementary strategy has become more prevalent, with the average share of co-investments in the portfolio value of the five UK-listed PE companies that continue to have a high share of fund investments (PIP, HVPE, APEO, ICGT, CTPE) increasing from 0–15% in 2012 to 15–45% currently. Moreover, one UK-listed PE company (NBPE) moved entirely away from PE fund investments to focus on co-investments (which now account for 92% of the company’s portfolio value).
In a co-investment strategy, a PE investor still relies on the capabilities of the GPs it invests alongside but has greater flexibility in terms of capital deployment (as co-investments are done on a case-by-case basis and capital is deployed faster), also leading to low commitments (and in turn higher capital efficiency and easier balance sheet management). Moreover, unlike for LP positions, GPs normally do not charge fees on co-investments, translating into a one-layer fee structure (for PE companies investing alongside third-party GPs) or no fees (if investing alongside its own investment manager). It is worth noting however that for all the above-mentioned PE strategies, the investment manager often charges monitoring and transaction fees to underlying companies. PE investors also consider co-investments as a means to exchange knowledge and learn from top GPs.
Co-investment portfolios are often more diversified than direct PE portfolios but more concentrated than fund-of-fund portfolios, with single co-investments normally representing c 1–5% of NAV. This is well illustrated by NBPE’s portfolio, which consists of 94 private companies, with the top 10 holdings making up 33% of portfolio value. A co-investment may take the form of a traditional ‘plain vanilla’ deal as part of a syndication process conducted by the lead sponsor after signing a deal, or more complex transactions such as co-underwriting a transaction (working with the lead sponsor ahead of signing a PE deal) or mid-life deals, that is investments in an existing portfolio company of a GP to provide additional capital for growth/add-on acquisitions, recapitalisations or partial exits of existing shareholders.
In Exhibit 15, we present the current portfolio breakdown of individual listed PE companies by strategy.
Exhibit 15: Portfolio breakdown of UK-listed PE companies by strategy
Source: Company data, Edison Investment Research. Note: Based on the latest reported data. The chart presents all companies from the AIC PE sector except for companies in realisation phase (Dunedin Enterprise and JPEL Private Equity), companies in the process of portfolio transition (LMS Capital) and for which data are not available (Symphony International Holdings). We have also included Georgia Capital given its focus on PE opportunities in Georgia.
Managing third-party assets
Some of the self-managed listed direct PE companies not only invest their own funds, but also have sizeable AUM and therefore generate recurring fee income from managing buyout funds. Notable examples include Paris-listed Eurazeo, UK-listed 3i Group and Frankfurt-listed DBAG:
According to Tom Alzin, one of DBAG’s board members: ‘With respect to the business models in private equity, there are different approaches in the market, ranging from asset managers to direct investors. DBAG shares allow investors to participate in a unique integrated business model: they are given access to continuous earnings contributions from advisory services provided to private equity funds and, at the same time, the opportunity to participate in the performance of a portfolio of top-performing mid-sized companies that are not themselves listed.’
PEs tend to value their portfolios conservatively, but markdowns are possible in the near term
PE portfolio valuations less volatile than public equities
Historical NAV data of listed PE companies suggest that PE valuations (and in turn NAV TRs reported by listed PE companies) tend to be less volatile than valuations in public equity markets, which may be counterintuitive for some investors given that private markets provide a less liquid exposure to equities. Consequently, we have recently seen a divergence between the harsh sell-off in public markets and the relatively resilient NAVs of listed PE companies. This partly comes from portfolio composition in terms of sectors, and possibly also value-add provided by GPs (as discussed above), translating into higher earnings growth across PE portfolios and in turn greater value resilience. For example, Partners Group estimated that the public market performance in the first nine months of 2022 (9M22; as measured by the MSCI World Index) would have been -13.3% for a sector composition aligned with the Partners Group-managed direct PE portfolio compared to the MSCI World’s actual return of -25.4%. Furthermore, strong EBITDA growth across the portfolio meant that the portfolio return (excluding assets with extraordinary exit and EBITDA growth events) was -4.9% (see Exhibit 16).
Exhibit 16: Comparison of Partners Group-managed portfolio versus public market in 9M22
Source: Princess Private Equity
Having said that, the comparatively greater resilience also arises from the choice of methods applied to value private companies. However, it does not mean that PE valuations are set in an arbitrary way. They are normally performed in accordance with fair value principles such as IFRS 13 and US GAAP Topic 820, and are aligned with the International Private Equity and Venture Capital Valuation (IPEV) guidelines.
PE-backed companies most often valued-based on LTM earnings/revenues
IPEV guidelines cover several valuation methods (which are to be selected in a way that maximises the use of relevant observable inputs), with the most common being (in line with public equities) the peer multiples and discounted cash flow valuations. The former method is by far the most widely used approach in the PE sector and is usually based on the last 12 months (LTM) revenues or earnings (though there are some exceptions, eg DBAG uses forward multiples and CGEO’s valuations are prepared by a third party valuation specialist (Kroll) based on a blend of LTM multiples and DCF).
PE managers do not simply apply the average multiple of listed peers to the private company’s earnings. Firstly, they account for the difference between the multiple implied by the acquisition price and public multiples at the time of the investment (which is due to factors such as the illiquidity discount). Importantly, PE managers often value their investments in line with the acquisition price for the first 12 months after a deal completes. Secondly, on an ongoing basis, they use a blend of current multiples derived from the public market and from recent private M&A deals as a reference point to value the holding. The latter smooth out PE valuation changes as the pricing of private M&A transactions is not affected by the same short-term swings in investor sentiment (both to the upside and downside). Furthermore, PE portfolio valuations also capture the multiples arbitrage stemming from ongoing ‘buy-and-build’ strategies (ie add-ons being acquired at a lower multiple than the platform is valued). There is also a certain stickiness in sellers’ price expectations (especially on the downside), which means that changes in public equities’ valuations take some time to feed into private markets (ie for sellers’ and buyers’ expectations to converge).
The above does not mean that private valuations cannot fall significantly amid a severe economic downturn. Neuberger Berman (NBPE’s investment manager) estimated that the peak to trough decline in US buyout portfolio valuations during the burst of the dot-com bubble (Q101 to Q402) and the GFC (Q307 to Q109) stood at -27% and -28% respectively (still below the peak to trough falls in the S&P 500 Index of 47% and 36% respectively).
Exhibit 17: Average current EV/LTM EBITDA multiple across listed PE portfolios
Source: Company data, Edison Investment Research. Note: Based on the latest reported data. For some companies the ratios are provided for only a sample of the total portfolio (see company filings for details).
Listed PE realised sizeable uplifts upon exits historically
In the long run, more relevant than the short-term volatility of portfolio values is, in our opinion, the ability of PE companies to realise their investments at or above the carrying value at which they recognised them in their accounts before the realisation was agreed (which would validate their portfolio valuations). Listed PE has a strong, long-term track record in this respect, suggesting a conservative approach to valuations. Several listed PE companies report the valuation uplifts they achieve upon exits (full realisations, partial exits and IPOs) compared to either (1) the last ‘unaffected’ carrying value (ie before a deal/public listing announcement), (2) the carrying value as at the end of the prior financial year, or (3) the carrying value at a defined number of quarters prior to the exit (up to four quarters). Listed PE companies with a significant part of their portfolio in a fund-of-funds strategy, and which regularly report the figures for a given financial year (PIP, HVPE, ICGT) achieved considerable average uplifts to previous carrying values of 20–50% in each of the last 10 financial years (with HVPE’s 123% average uplift on buyouts in FY21 being a noticeable outlier). Similarly, several listed companies focusing on direct PE investments or direct co-investments have reported significant uplifts in the past:
HGT’s average uplift to carrying value was 25% at the end of the prior financial year over the 10 years to Q322 covering 62 realisations (with 40% and 50% on average in FY21 and FY20 respectively).
NBPE’s average uplift was 44.2% on its exits (including several IPOs) over the five years to FY21.
APAX reported a five-year average uplift of 33% to end-March 2022 and average uplifts across Apax’s buyout funds VII, VIII and IX of 23.5%, 26.5% and 41.3% respectively (Apax X had a 49.7% uplift on one exit completed so far), as disclosed in the Q322 presentation.
OCI’s average uplift is 52% since inception (though on a more limited number of exits compared to other listed PE peers).
Several research studies also point to conservative portfolio valuations of top PE GPs. For example, Brown, Gredil and Kaplan concluded in one of their studies that top-performing funds appear to understate valuations. Moreover, a recent analysis by Burgiss suggests that even so-called ‘zombie’ assets (ie assets held in a fund whose NAV after year 10 still represents at least 10% of the original commitments) are eventually liquidated at prices in line with GP valuations.
Listed PE now traded at above-average discounts to NAV
Meanwhile, volatility in the share prices of listed PE companies is more in line with the broader equities market, which makes discounts/premiums to NAV cyclical (ie discounts widen during bear markets and narrow (or even turn into premiums to NAV in selected cases) during bull markets, see Exhibit 18). We estimate that the current average discount to last reported NAV of c 30% is the widest since 2011/12 (excluding the brief dip at the onset of the COVID-19 pandemic). It remains to be seen to what extent the gap will be reduced due to near-term NAV declines versus a rebound in share prices. During the last three major instances of widening discounts (2011/12, 2015/16 and H120), they subsequently narrowed primarily on the back of share price appreciation (which would suggest that now may be a good time to buy listed PEs), while during the GFC the discount narrowing came from a combination of downward portfolio value adjustments and share price increases.
Exhibit 18: Average discount/premium to the last reported NAVs of listed PE companies (excluding those which completed or are currently in the process of winding down) over time
Source: Refinitiv, company data, Edison Investment Research. Note: Weighted by prior year-end NAV. Includes the following companies: HgCapital Trust, ICG Enterprise Trust, Pantheon International, CT Private Equity Trust, Princess Private Equity (since January 2007), NB Private Equity (July 2007), Oakley Capital Investments (December 2007), HarbourVest Global Private Equity (January 2008), abrdn Private Equity Opportunities (September 2008), Apax Global Alpha (June 2015).
Other factors adding to the swings in the discounts or premiums to NAV are the timing and lag in portfolio valuations, which vary among the listed PE companies. PE valuations are normally updated on a quarterly basis, though there are exceptions (eg PEY re-values its portfolio every month). Direct PE companies have immediate access to updated carrying values, though they are releasing their results within timelines similar to other listed companies (ie about one to two months after period-end). PE fund-of-funds and co-investors on the other hand receive the valuations from GPs/lead sponsors with a certain lag (normally c 45–75 days after quarter-end). Consequently, even though many of them publish monthly NAV statements, these are normally based on valuations from two to four months prior.
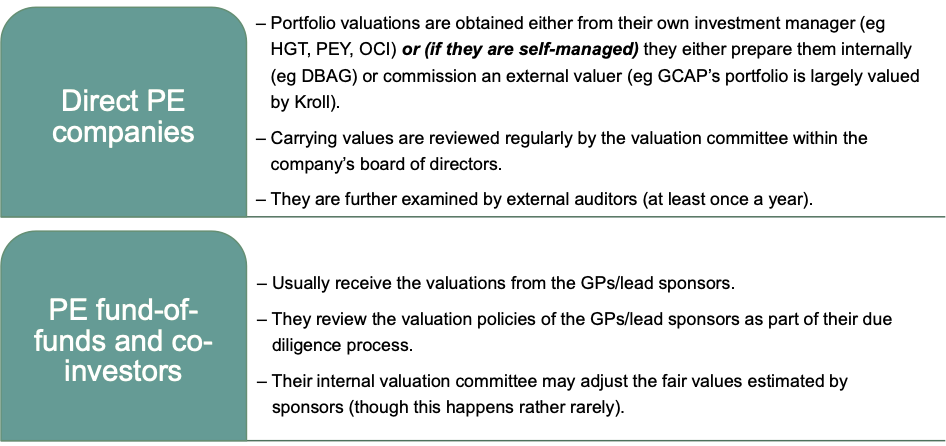
Exhibit 19: Who values PE portfolios?
Source: Edison Investment Research
The average discount or premium to NAV at which individual listed PE companies trade is further influenced by, among others, PE strategy, fee structure, portfolio exposures (by region, sector etc), high single-asset exposures and structural leverage. For instance, PE fund-of-funds normally trade at wider discounts to NAV, which may be due to the two-layer fee structure (see above) and higher overcommitment risk, among others.
High leverage remains inherent to PE
PE leverage ahead of listed equities on average…
It is undisputable that PE-backed portfolio companies are characterised by a relatively high leverage level in terms of net debt to EBITDA compared to listed companies. The global PE entry debt to EBITDA ratio stood at 5.9x in 9M22 (according to PitchBook citing Leveraged & Commentary Data (LCD) and Morningstar data) versus net debt to LTM EBITDA for the S&P Small Cap 600 Index and the MSCI ACWI Index at c 2.4x and 1.3x at end-September 2022, respectively, according to Bloomberg data. Even among the speculative-grade companies, PE-backed companies recently displayed higher average leverage in the new-issue leveraged loan market with debt to EBITDA at c 6.0x (excluding refinancings) compared to 4.4x for non-sponsored companies in 2022 and 2021, according to LCD data. This is also true for the portfolios of listed PE companies (see Exhibit 20). Higher leverage becomes particularly important in the context of the current sharp spike in interest rates, given that a significant part of the debt of PE-backed companies is floating rate. The higher corporate borrowing costs are for instance illustrated by the considerable increase in the effective yield of the ICE BofA US High Yield Index from 4.35% at end-2021 to 7.73% as at 3 February 2023. PitchBook estimates that at a leverage ratio of 6.0x, a company’s EBITDA interest coverage ratio will decline to just 1.4x in a scenario where benchmark rates are around 4.0% (vs 3.5x for short-term rates at zero). Rising interest rates could have an even more pronounced impact on collateralised fund obligations issued by some GPs, which are designed in a similar way to collateralised debt obligations but hold a diversified pool of LP positions in PE funds as assets (rather than a debt portfolio).
Exhibit 20: Net debt to LTM EBITDA across listed PE portfolios
Source: Company data, Edison Investment Research. Note: Based on the latest reported data. For some companies the ratios are provided only for a sample of total portfolio (see company filings for details).
…but its translation into higher risk is not straightforward
We note that PE-backed companies tend to perform better in terms of defaults during times of stress than non-sponsored peers, as illustrated by the lower annualised default rate of PE-backed companies in 2008–09 (during the GFC) at 2.8% versus 6.2% for speculative-grade companies, according to Bain & Co’s Global Private Equity Report 2011. Moreover, since 2011, the average default rate of PE-backed leveraged loans tracked by LCD of 1.50% is broadly in line with that of leveraged loans of non-sponsored companies of 1.57% (though the former does not include distressed exchanges).
Higher indebtedness is in many cases warranted by the private company’s high degree of recurring revenue, strong cash flow generation and high earnings growth. Secondly, part of the leverage is normally attributable to debt-financed strategic M&A (to pursue a ‘buy-and-build’ strategy, see above) aimed at realising synergies that are not immediately reflected in a company’s accounts. Thirdly, PE investment companies are often willing to provide additional funding to support a portfolio company during times of stress (acting as ‘deep-pocket’ investors), potentially warranting the use of more leverage by PE-backed companies. Finally, part of the leverage of PE-backed companies is quite frequently attributable to shareholder loans provided by the PE owner itself.
Covenant-lite structures and the rise in private debt may provide a certain cushion…
GPs now put emphasis on the higher flexibility of debt structures; for instance, NBPE recently reported that 70% of debt across its portfolio is covenant-lite (and a further 3% has no debt). Covenant-lite debt is beneficial for equity investors in that it limits the risk of a sudden widespread credit crunch during an economic downturn and provides more room for restructuring efforts if necessary (though it may encourage excessive leverage and also translate into lower debt recovery rates in case of default). Many GPs have in-house debt specialists as they also run private debt strategies, giving them better capabilities to properly manage the debt funding and credit risk of portfolio companies. Moreover, availability of debt for refinancing may be better during the current downturn compared to the GFC, especially given the growing importance of global private debt markets. The latter have grown to total AUM of US$1,241.3bn (of which US$425.1bn dry powder) at end-2021 versus just US$257.2bn (US$137.9bn) in 2007.
…still, debt for buyouts has become less available recently
The significant interest rate hikes and declining risk appetite of lenders have already affected the overall availability of buyout debt funding and PE deal activity in 2022. This is seen across broad M&A markets,[3] with US$719bn in transactions being closed in Q422 (according to Bloomberg Law) compared to close to US$1.5tn in Q421. Notably, Q422 was the first Q4 since 2017 where there has been a quarter-on-quarter decline in deal value and count (Q4 usually sees increases due to companies seeking to close transactions before the end of the year). GPs are now forced to use a greater proportion of equity (50% or more) in new leveraged buyouts (also to keep interest expense at reasonable levels), which we believe could have an impact on prospective returns. Most notably, the willingness of banks to provide syndicated loans used to fund large/mega buyouts has deteriorated markedly. Banks recently faced challenges with offloading previously syndicated loans, as illustrated for instance by the US$700m loss large investment banks had to accept in the sale of debt they provided to fund the leveraged buyout of Citrix earlier this year. The US leveraged loan market saw institutional new-issue loan volumes at a mere US$35.7bn in Q422, the second-weakest quarterly level in the past decade, according to Partners Group citing LCD. Similarly, European leveraged loan issue volumes were at a mere €4.5bn in Q422 (further down from €7.2bn in Q322) versus €24.8bn in Q321 and €41.3bn in Q221. Collateralised loan obligation issuance also slowed down in the second half of 2022, while high-yield bond markets have experienced a significant slump in new issuances, hitting a 14-year low in Q322, according to PitchBook citing LCD data.
Private debt funds being direct lenders have generally stepped in to at least partly fill the gap created by low leveraged loan and high-yield bond volumes and have been gaining market share recently. For instance, their share in the US sponsored mid-market increased to 80% in Q322 versus 65% in Q222 and 50% in Q221, according to the CEO of Antares Capital. We believe that PE small/mid-market companies may find it easier to secure debt financing than mega buyouts, given that many private debt funds reduced their appetite for large deals in 2022.
Finally, the debt maturity profile also needs to be considered. Some GPs have used the high availability of credit (boosted by monetary stimulus) at the onset of the COVID-19 pandemic to refinance debt across portfolio companies. As at end-September 2022, only 9% of the outstanding loans of PE-backed companies included in the LSTA US Leveraged Loan Index were due before end-2024, according to LCD. An example from the listed PE space is NBPE’s portfolio, across which 65% of debt matures later than 2026.
[3] Covering a wide variety of transaction types including minority stake transactions and VC financing rounds.
Liquidity management at holding level key for listed PE
We understand that the current wide discount to NAV of listed PE companies may reflect, among other things, investor anxiety related to their balance sheet management. This particularly applies to the overcommitment strategy of PE fund-of-funds in the context of a potential mismatch between capital calls and distributions similar to the previous two major market downturns (2000–03 and the GFC) when capital calls remained stable (or even increased) while distributions fell significantly. As discussed above, PE fund-of-funds tend to pursue an overcommitment strategy to stay close to fully invested (given the usual long time it takes to convert a commitment into an actual investment in an underlying private company) and therefore fund part of the new capital calls with distributions from existing investments. However, in the years leading to the GFC, some PE LPs (including some PE fund-of-funds) were too aggressive in their commitment strategies. During the market downturn, they were forced to embark on measures aimed at improving their liquidity to cover capital calls and/or improve their loan-to-value (LTV) ratios to meet debt covenants amid falling portfolio valuations. These included, among others: (1) the sale of some of their LP positions at a wide discount to last carrying value, (2) negotiating a cap on their commitments in exchange for giving up part of the future realisation proceeds and the ability to participate in new investments of the funds they invested in, (3) renegotiating their debt covenants and/or issuing new debt, and (4) issuing new shares at a discount to NAV. Some of the affected PE companies are no longer listed.
No significant spike in net capital calls visible (yet)
While a decline in PE exit activity has started to materialise in recent months, we believe that a potential spike in net capital calls could be less pronounced than during the GFC given better availability of debt funding to private companies (especially small/mid-market buyouts, see data from Antares Capital above) and the higher share of covenant-lite debt limiting the immediate debt restructuring needs (see for example NBPE data above). For now, there is no evidence of a significant mismatch between capital calls and distributions when examining the data of listed PE companies with a fund-of-funds strategy that provide data on a monthly basis. Having said that, we note that the level of distributions was close to the capital calls in recent months, indicating a tougher exit environment (see Exhibit 21).
Exhibit 21: Aggregate distributions and capital calls for selected listed PE companies with a fund-of-funds strategy (PIP, HVPE, APEO).
Source: Company data, Edison Investment Research
We would also highlight that the PE secondary market is much more liquid and over five times bigger (in terms of annual deal value, according to GreenHill) versus at the time of the GFC. This may give PE trusts greater scope to sell fund positions in the market to generate cash and release outstanding commitments, possibly without having to accept discounts to NAV in excess of 10–20%. Average secondary buyout pricing in H122 was 88% of NAV, according to GreenHill’s global secondary market review.
Lower overcommitment ratio of listed PEs now versus GFC
Finally, the currently listed PE companies pursuing primary/secondary fund investments now keep a lower level of outstanding commitments in excess of available resources as a percentage of NAV compared to the GFC. The current weighted average overcommitment ratio for the five actively investing PE funds with a meaningful share of primary and/or secondary fund-of-funds investments (PIP, HVPE, ICGT, APEO and CTPE) stands at c 33% compared to c 50% in 2007 (see Exhibit 22). At the same time, these funds keep a percentage coverage of their outstanding commitments at c 41%, broadly in line with the pre-GFC level. Others have changed their investment strategy away from fund-of-funds to direct investments (eg PEY) or direct co-investments (NBPE), which are characterised by a lower level of commitments to NAV (see above). The lower overcommitment ratio for companies with a fund-of-funds strategy is also likely partly due to the growing share of direct co-investments in their portfolios.
Exhibit 22: Historical evolution of the average overcommitment ratio of PE fund-of-funds
Source: Company data, Edison Investment Research.
Note: *Current figures based on last reported data for each of the funds. Includes PIP, HVPE, ICGT, APEO and CTPE, weighted by their respective net asset values (overcommitment ratio) or outstanding commitments (coverage ratio) . The overcommitment ratio is calculated as outstanding commitments in excess of liquid resources as a percentage of NAV; the coverage ratio is calculated as available resources as a percentage of outstanding commitments.
Apart from capital calls, listed PE companies need to factor in other triggers of potential cash outflows in their balance sheet management, such as (1) funding of direct PE investments agreed but not yet closed, (2) follow-on funding provided to portfolio companies in distress or with a rich pipeline of add-on acquisitions that requires external funding, (3) ongoing charges, and (4) foreign exchange hedging arrangements (eg see our podcast on PEY’s interim dividend suspension).
In the context of investment commitments and other expected cash outflows at the holding level, it is also worth examining to what extent these are covered by available liquid resources (ie cash and cash equivalents versus undrawn credit facilities). Several listed PE funds tend to keep a very small cash balance (to optimise their investment level), while relying mostly on the credit lines to bridge any temporary timing gap between distributions and capital calls. Here, it is worth examining (1) the LTV ratio implied by the total size of a given PE company’s credit facility (after accounting for any structural debt) and its portfolio value, and (2) any debt covenants such as maximum LTV or borrowing base clauses (limiting the amount the company can draw), which may be triggered in the case of a significant decline in portfolio value. In Exhibit 23, we summarise the current credit lines of listed PE companies as a percentage of portfolio value. Most of the companies have sizeable undrawn credit, providing a liquidity cushion but also capital to seize market opportunities as they arise. This is in contrast to some listed PE companies, which at the onset of the GFC used structural leverage at the holding level.
Exhibit 23: Available credit lines as a percentage of total portfolio value* of PE companies
Source: Company data, Edison Investment Research. Note: *Based on latest available data (end-December 2022 for HVPE, NBPE, PIP, APEO, PEY, III; end-October 2022 for ICGT; end-September 2022 for APAX, CTPE, HGT, BOOK, CGEO; end-June 2022 for OCI). **The companies use long-term debt as well: NBPE has issued zero-dividend preferred shares equalling 5% of its portfolio value, CGEO has issued Eurobonds equalling 36% of its portfolio value, III’s net gearing stood at 3% at end-December 2022.
Is PE increasingly selling to itself?
While PE has a good track record of achieving solid returns and high uplifts to previous carrying values upon exits (see above), some investors are concerned about the role of transactions in which ‘PE is selling to itself’ (ie transactions in which one PE fund sells a holding to another PE fund) in generating these results. These include sponsor-to-sponsor deals between funds managed by different GPs, but also so-called manager-led secondaries, which most often involve the sale of one or multiple assets from one PE fund to a continuation fund (ie an SPV set up specifically to buy the assets) or another active PE fund controlled by the same GP. A scenario in which these deals play a dominant role in portfolio exits, and therefore valuations of PE-backed companies are rarely validated by a trade buyer or public markets (upon IPOs), would create the risk of artificial inflation of these valuations and detachment from broader financial markets.
Sponsor-to-sponsor deal volume meaningful, but not dominant
Data published by PitchBook suggest that transactions between PE companies are not the dominant contributors to the overall exit volumes, even if they make up a significant part of the latter. In 2021, sponsor-to-sponsor deals represented 35% and 41% of total US and European PE exit values respectively, with corporate acquisitions from a trade buyer making up 30% and 36% respectively and the remaining 34% and 23% attributable to public listings, respectively (see Exhibits 24 and 25). While the share of sponsor-to-sponsor deals has been broadly stable since 2017, it has increased over the longer term as the PE industry has matured and its AUM increased. Amid the IPO/SPAC (special purpose acquisition company) standstill in 2022, US sponsor-to-sponsor and corporate deals made up 45% and 52% respectively. In Europe, the 2022 data implied 40% for corporate acquisitions, 54% for sponsor-to-sponsor deals and 6% public listings.
Exhibit 24: Share of US PE exit value by type
Source: PitchBook’s 2022 Annual US PE breakdown
Exhibit 25: Share of European PE exit value by type
Source: PitchBook’s 2022 and Q322 European PE breakdown
GP-led secondaries are often a way to run winners for longer
With respect to manager-led secondaries, their share in the global PE secondary market has increased significantly from 24% in 2017 to 52% in 2021 (42% in H122), according to Global Secondary Market Review by Jefferies. This represents a rise in absolute terms from US$14bn in 2017 to US$68bn in 2021 (US$24bn in H122). While meaningful, the 2021 figure remains relatively modest compared to the overall PE exit activity in the United States (US$848bn) and Europe (€410bn) for the same year.
Still, we acknowledge that some market participants are anxious about the nature and certain characteristics of continuation funds, as these deals obviously entail a conflict of interest for the GP. Investor concerns often relate to the process of setting the transaction price, which is normally not validated through a competitive bid for the asset from investors outside of GPs’ funds. Some critics indicate that this makes the valuation of the assets detached from the broader markets during downturns such as the current one. However, investors may take some comfort in the fact that the deals often involve the onboarding of new non-PE investors (eg sovereign wealth funds and pension funds) as a minority investor (somewhat validating the valuation set in the deal). Moreover, LPs in the selling fund have the opportunity to cash out rather than being forced to roll over their position into the buying fund.
Another concern raised by market participants is that GP-led secondaries often involve significant benefits to the GP in terms of fees. The transaction releases the carried interest accrued in the previous fund, the GP can again charge fees on the assets in the new fund based on capital committed rather than invested, and in many cases the GP sets a higher carried interest rate (performance-based compensation collected by the GP upon investment realisation), for example at 25% or even 30%. GPs may mitigate the fee disadvantage to LPs (eg by reinvesting a large part of the fees released from the selling fund), as well as keeping a more moderate carried interest rate in the new fund.
It is worth highlighting that a large part of the GP-led secondary transactions is being done to extend the holding period of high-quality asset(s) beyond the life of the existing fund to allow LPs to continue participating in the further growth potential of the asset(s). Interestingly, PIP considers this a compelling way to capitalise on new attractive investment opportunities (with pricing for secondaries more attractive amid an IPO standstill), as illustrated by its recent new investment commitments.
Company profiles (*Edison clients)
Below we present brief profiles of UK-listed PE companies excluding those in the process of winding down. We also provide a profile of Frankfurt-listed Deutsche Beteiligungs, as well as a profile of a German-listed turnaround specialist (Mutares), representing an interesting PE niche.
3i Group (III)
Investor and manager in PE and infrastructure Market cap: £15,928m Discount to last reported NAV (December 2022): 0.8%
III is an investment company with two complementary businesses: PE and infrastructure. Within PE, III backs entrepreneurs and management teams of mid-market businesses (with an enterprise value up to €500m) in Europe and North America wanting to grow internationally. Beside own investments, III currently manages third-party capital through three PE funds: the 3i Eurofund V (€5.0bn), the 3i Growth Capital Fund (€1.2bn) and the 3i 2020 Co-investment Programme (€2.5bn), the latter being a single-asset continuation vehicle.
Within infrastructure, III manages and holds a 30% equity interest in the UK-listed 3i Infrastructure, which invests in mid-market economic infrastructure in developed markets (with a focus on the UK and Europe). Moreover, III manages two funds focused on operational public-private partnership (PPP) projects: (1) BIIF, a 2008 vintage £680m yield-based infrastructure fund co-managed with Barclays Infrastructure Funds Management, now fully invested, and (2) 3i European Operational Projects Fund (EOPF), which is yield-based, launched in 2017 with a size of €456m (with a €40m commitment from III) and is still in investment phase. Together with other funds and managed accounts, III’s total infrastructure AUM stood at £5.9bn at end-September 2022.
Focus on ‘high-conviction’ PE GPs Market cap: £760m Discount to last reported NAV (December 2022): 33.4%
APEO invests in a diversified portfolio of leading PE buyout funds (or alongside them through co-investments), focused mainly on the European mid-market, defined as funds with a size typically between €1.0bn and €5.0bn. It also invests in selective adjacent and complementary PE strategies in Europe and North America, most notably the lower mid-market (between €150m and €1.0bn), large/mega funds (over €5bn, focused primarily on mid-market core managers who ‘graduated’ to the large market), as well as mid-sized growth equity.
APEO has built a well-diversified portfolio of 75 separate fund investments (acquired both through primary commitments and secondary fund investments) and 22 co-investments at end-September 2022, which in total provide exposure to 655 underlying private companies. In 2019, the company expanded its mandate to include direct co-investments alongside top-performing PE managers with which it has already established long and successful relationships. As the Standard Life brand was sold to Phoenix Group in May 2021, the company’s name was changed to abrdn Private Equity Opportunities Trust (previously Standard Life Private Equity Opportunities Trust).
Apax Global Alpha (APAX)
Focus on tech, services, healthcare and internet/consumer Market cap: £886m Discount to last reported NAV (September 2022): 28.1%
APAX aims to build and maintain a high-quality, global portfolio of investments across four core sectors: tech, services, healthcare and internet/consumer. It targets an NAV TR across economic cycles of 12–15% (net of fees and expenses), as well as a dividend yield of 5% of NAV per annum. The company’s portfolio is a combination of direct PE investments (c 70% at end-September 2022) and so-called ‘derived investments’ (resulting from APAX’s direct PE investments), including 28% in derived debt and 2% in derived equity. The latter are made to provide liquidity and flexibility for the portfolio while generating enhanced risk-adjusted returns.
CT Private Equity Trust (CTPE)
High exposure to UK and continental Europe through primaries and co-investments Market cap: £346m Discount to last reported NAV (September 2022): 33.3%
CTPE (formerly BMO Private Equity Trust) provides exposure to a diverse spread of PE investments, principally through specialist PE funds and direct co-investments. With respect to the latter, CTPE puts emphasis on lower mid-market buyouts or growth equity investments in companies with strong management experiencing secular growth often in niche sectors. The company may also purchase secondary PE fund interests. CTPE aims to provide shareholders with a predictable and above-average dividend (targeting an annual yield of not less than 4% of NAV per share), funded from a combination of revenue and realised capital profits.
A German PE investor and manager focused on the mid-market Market cap: £494m Discount to last reported NAV (September 2022): 4.3%
Deutsche Beteiligungs invests in mid-sized companies in German-speaking countries (the DACH region) and selected other European regions (eg Northern Italy), focusing on growth-driven profitable businesses valued at €50–250m. DBAG also initiates and manages closed-end PE funds (generating stable recurring fee income) with current third-party capital under management of €1.9bn. The DBAG funds carry out MBO transactions to acquire a majority equity stake for €40–220m, with DBAG acting as a co-investor. DBAG also makes long-term investments funded exclusively from its own balance sheet where the company normally targets a ticket size of €15–35m with a holding period of seven years and longer (compared to up to five years in MBOs). Here, DBAG focuses either on providing growth financing to family-owned businesses in exchange for a minority stake or on acquiring majority stakes in companies with performance-driven equity requirements, including corporate spin-offs. DBAG also manages funds focused on growth financing (expansion capital funds, ECFs).
The company has been a ‘partner of choice’ for a number of German private businesses, in particular those owned by founders and their family members, as illustrated by the share of businesses sold by this group to DBAG and included in its total MBO volume in 2012–21 at 57% compared to 46% for the broader German mid-market MBOs segment.
A portfolio of market leaders in Georgia Market cap: £339m Discount to last reported NAV (September 2022): 57.6%
CGEO primarily focuses on equity investments in Georgia in sectors that are expected to benefit from the growth and diversification of the local economy. The company was established in 2018, when the UK-based holding company BGEO was split into Bank of Georgia (a leading Georgian universal bank) and CGEO. Since then, CGEO has been listed on the LSE and it has a wide shareholder structure, including 8% employee ownership (as at end-September 2022).
CGEO is self-managed (ie it has no external investment manager) and has an experienced management team (with senior team members coming primarily from the former BGEO Group). The team is led by Irakli Gilauri as chairman and CEO, who was with Bank of Georgia from 2004 and subsequently CEO of BGEO Group from 2011. He has around 20 years’ experience in banking, investments and finance. According to the company, his strategic involvement and extensive relationship network has been instrumental over the last 10 years in creating major players in a number of Georgian industries, such as banking, healthcare, utilities and energy, real estate, insurance and wine businesses, many of which are currently CGEO’s portfolio holdings. As a result of the de-merger, CGEO owns a 19.9% equity stake in Bank of Georgia.
HarbourVest Global Private Equity (HVPE)
Diversified portfolio consisting primarily of buyouts and VC/growth equity investments Market cap: £1,792m Discount to last reported NAV (December 2022): 42.9%
HVPE provides easy access to a diversified global portfolio of private companies by investing in HarbourVest-managed funds, which hold primary and secondary fund investments, as well as direct co-investments (HVPE targets a 50%/30%/20% portfolio split in this respect). HVPE’s underlying investments cover buyouts (target at 60% of the portfolio), VC and growth equity investments (30%), as well as mezzanine and infrastructure assets (10%). It aims to hold a portfolio with a high weighting towards North America (60% target), followed by Europe and Asia-Pacific (20% each). HVPE is broadly diversified across sectors, though with a relatively high weighting to tech and software (32% at end-December 2022).
A specialist tech investor in the European buyout market Market cap: £1,726m Discount to last reported NAV (September 2022): 16.4%
HGT’s portfolio offers a blend of leading profitable unquoted European mid-market businesses, with an international footprint, offering SME software solutions with a high share of SaaS-based recurring revenues and high customer retention. These businesses often focus on products or services that are business critical, but typically low spend. The area of expertise of Hg (HGT’s manager) is buyouts of defensive tech growth companies operating in one of eight core end markets: tax and accounting; ERP and payroll; legal and compliance; automation and engineering; insurance; SME tech services; capital markets and wealth management IT; and healthcare IT.
HGT focuses on direct PE investments in companies across Europe that offer software and services with enterprise values ranging from £100m to more than £10bn. Its investment strategy also involves co-investments, which allow the company to manage its balance sheet more effectively and reduce the total fee load. According to the recently agreed new co-investment framework, Hg aims to allocate 10–15% of HGT’s balance sheet to co-investments (vs c 6% at end-FY21).
ICG Enterprise Trust (ICGT)
Aiming for the right balance between concentration and diversification, risk and reward Market cap: £820m Discount to last reported NAV (October 2022): 37.4%
ICGT follows a flexible mandate and highly selective approach to portfolio construction. It combines a more concentrated exposure to high-conviction (preferably defensive growth) picks through direct investments, co-investments and secondary fund investments with more diversified exposures through third-party PE funds. ICGT focuses on mid-market and larger buyouts of profitable, cash-generative private companies, mostly in Europe and the United States. ICGT targets businesses benefiting from long-term structural trends and aims to build a portfolio that will be more resilient in an economic downturn compared to the broader market.
Literacy Capital (BOOK)
UK-focused PE with a charitable mission Market cap: £230m Discount to last reported NAV (December 2022): 7.8%
BOOK invests in lower mid-market, UK-based private businesses (normally family owned and founder-led), preferably with healthy margins and high cash conversion of profits. It considers both the purchase of minority and majority stakes, as well as MBOs and management buy-ins (MBIs). It aims to use a modest level of leverage (1.0–1.5x EBITDA on average). BOOK was created with a charitable objective of giving away 0.9% pa of NAV to literacy and education charities. The majority of BOOK is owned by its directors, team and their family members.
LMS Capital (LMS)
Seeking new opportunities to deploy its dry powder Market cap: £22m Discount to last reported NAV (September 2022): 52.1%
LMS invests in real estate, energy and late-stage PE (ideally with a crossover with energy or real estate in the latter case), targeting a return of 12–15% pa (net of costs). The company is in the process of building a network of co-investing partners who will invest alongside LMS. It held a significant cash balance of £18.4m at end-September 2022 (c 38% of NAV). It held a further £17.5m in unquoted direct investments (mostly four holdings managed by San Francisco Equity Partners) and £15.2m in fund investments, some of which are mature investments made prior to 2012.
Mutares (MUX)
Special situations specialist Market cap: £288m
Mutares acquires special situation companies that are underperforming and can be turned around through financial and operational restructuring. It follows a ‘buy-and-build’ strategy, where it acquires a ‘platform’ company and increases its scale through ‘add-on acquisitions’. As at end-September 2022 its portfolio consisted of 32 platform companies in various stages of its restructuring process (from still lossmaking, to fully restructured) with annualised revenues of c €5bn. Mutares specialises in companies operating in the engineering and technology (12 companies) and automotive and mobility (nine companies) sectors, supplemented by companies from the broader goods and services segment (11 companies).
Focus on long-term secular growth and low expected cyclicality Market cap: £685m Discount to last reported NAV (November 2022): 32.8%
NBPE makes direct co-investments alongside market-leading PE firms, the vast majority of which are made with no management fee or carried interest to third-party GPs. NBPE seeks capital appreciation through growth in NAV while paying a biannual dividend. The portfolio is allocated mostly to North America (73% of portfolio value as at end-November 2022).
NBPE focuses on two main themes: long-term secular growth and lower expected cyclicality. It invests in companies that may benefit from structural changes in customer demand and are not confined to any one type of business or sector. Having said that, investments are normally made alongside GPs in their core sectors of expertise. The main secular tailwinds recognised by NBPE’s investment manager are tech-enabled services, automation, e-commerce and ageing demographics. NBPE also looks for companies with low expected cyclicality that provide essential services, including quasi-infrastructure businesses.
Oakley Capital Investments (OCI)
Investing in digitally oriented businesses Market cap: £806m Discount to last reported NAV (December 2022): 31.0%
OCI invests in digitally focused mid-market and lower mid-market businesses across Western Europe in three distinct sectors: technology, education and consumer. Its technology portfolio companies offer web hosting and cloud-based SaaS solutions. Its consumer businesses are focused on direct-to-consumer (D2C) channels and growing digital marketplaces. Finally, its education companies offer primary, secondary, tertiary and professional learning platforms. By focusing on the above sectors, OCI aims to leverage three megatrends: (1) business migration to the cloud to deliver efficiency and productivity gains, (2) consumer shift to online, and (3) growing global demand for high-quality accessible learning, with online platforms and market consolidation driving provision at scale.
Pantheon International (PIP)
Boasting a more than 35-year track record Market cap: £1,445m Discount to last reported NAV (December 2022): 41.7%
PIP is one of the longest-standing UK-listed PE companies (it was launched in September 1987). It invests in a diversified universe of PE assets managed by third-party managers globally. This includes primarily buyouts (c 69% of portfolio value at end-December 2022, skewed towards small/mid-market buyouts – 43% of total portfolio), as well as growth equity investments (21%). It has a balanced portfolio in terms of strategy, with primary fund investments making up 33% of the portfolio at end-December 2022, followed by co-investments (34%) and secondary fund investments (33%). Direct co-investments, together with a meaningful share of single-asset, manager-led secondaries in the portfolio, allow PIP to gain greater exposure to high-conviction investments compared to a traditional PE fund-of-funds strategy. PIP is well diversified by sector, but with a higher weighting towards IT and healthcare (33% and 18% of portfolio value at end-December 2022, respectively).
Actively driving portfolio resilience Market cap: £579m Discount to last reported NAV (December 2022): 35.7%
PEY’s objective is to provide both long-term capital appreciation and income, as it targets a recurring dividend yield of 5% of NAV based on semi-annual payments. PEY changed its focus from third-party funds in 2011 (which remain its legacy portfolio, making up 2% of the total at end-December 2022) and now focuses on direct PE transactions, both through Partners Group’s flagship limited partnership funds and as a co-investor alongside other Partners Group-managed funds or other PE managers.
It invests mainly in mid-cap buyouts with an enterprise value of c €500m to €2bn targeting a relatively diversified portfolio of c 50–80 holdings. Partners Group is a relative value investor that seeks to make direct investments in highly cash-generative companies that offer meaningful top-line growth potential and fit into one or more of the following categories:
Well-managed platform companies that can be expanded via bolt-on acquisitions.
Category winners with a strong competitive position in a growing market segment.
Cash-generative and defensive leadersin sectors with high barriers to entry.
Symphony International Holdings (SIHL)
A play on PE and real estate development in Asia Market cap: £177m Discount to last reported NAV (September 2022): 49.2%
SIHL seeks to provide investors with opportunities in Asia, investing in particular in companies from high-growth sectors, such as primary healthcare, hospitality, lifestyle branded real estate and new economy ventures. SIHL believes that these sectors should benefit from the rising disposable income of Asia’s increasing (and increasingly aspirational) population. SIHL typically makes deals that involve growth capital for later-stage development and expansion, management MBOs/MBIs, restructurings and special situations. Where SIHL sees a special opportunity, it may also invest a smaller portion of its investment capital in earlier-stage businesses. Moreover, SIHL invests in real estate development.
General disclaimer and copyright
This report has been prepared and issued by Edison. Edison Investment Research standard fees are £60,000 pa for the production and broad dissemination of a detailed note (Outlook) following by regular (typically quarterly) update notes. Fees are paid upfront in cash without recourse. Edison may seek additional fees for the provision of roadshows and related IR services for the client but does not get remunerated for any investment banking services. We never take payment in stock, options or warrants for any of our services.Accuracy of content: All information used in the publication of this report has been compiled from publicly available sources that are believed to be reliable, however we do not guarantee the accuracy or completeness of this report and have not sought for this information to be independently verified. Opinions contained in this report represent those of the research department of Edison at the time of publication. Forward-looking information or statements in this report contain information that is based on assumptions, forecasts of future results, estimates of amounts not yet determinable, and therefore involve known and unknown risks, uncertainties and other factors which may cause the actual results, performance or achievements of their subject matter to be materially different from current expectations. Exclusion of Liability: To the fullest extent allowed by law, Edison shall not be liable for any direct, indirect or consequential losses, loss of profits, damages, costs or expenses incurred or suffered by you arising out or in connection with the access to, use of or reliance on any information contained on this note.No personalised advice: The information that we provide should not be construed in any manner whatsoever as, personalised advice. Also, the information provided by us should not be construed by any subscriber or prospective subscriber as Edison’s solicitation to effect, or attempt to effect, any transaction in a security. The securities described in the report may not be eligible for sale in all jurisdictions or to certain categories of investors.Investment in securities mentioned: Edison has a restrictive policy relating to personal dealing and conflicts of interest. Edison Group does not conduct any investment business and, accordingly, does not itself hold any positions in the securities mentioned in this report. However, the respective directors, officers, employees and contractors of Edison may have a position in any or related securities mentioned in this report, subject to Edison’s policies on personal dealing and conflicts of interest.Copyright: Copyright 2023 Edison Investment Research Limited (Edison).
Australia Edison Investment Research Pty Ltd (Edison AU) is the Australian subsidiary of Edison. Edison AU is a Corporate Authorised Representative (1252501) of Crown Wealth Group Pty Ltd who holds an Australian Financial Services Licence (Number: 494274). This research is issued in Australia by Edison AU and any access to it, is intended only for “wholesale clients” within the meaning of the Corporations Act 2001 of Australia. Any advice given by Edison AU is general advice only and does not take into account your personal circumstances, needs or objectives. You should, before acting on this advice, consider the appropriateness of the advice, having regard to your objectives, financial situation and needs. If our advice relates to the acquisition, or possible acquisition, of a particular financial product you should read any relevant Product Disclosure Statement or like instrument.
New Zealand The research in this document is intended for New Zealand resident professional financial advisers or brokers (for use in their roles as financial advisers or brokers) and habitual investors who are “wholesale clients” for the purpose of the Financial Advisers Act 2008 (FAA) (as described in sections 5(c) (1)(a), (b) and (c) of the FAA). This is not a solicitation or inducement to buy, sell, subscribe, or underwrite any securities mentioned or in the topic of this document. For the purpose of the FAA, the content of this report is of a general nature, is intended as a source of general information only and is not intended to constitute a recommendation or opinion in relation to acquiring or disposing (including refraining from acquiring or disposing) of securities. The distribution of this document is not a “personalised service” and, to the extent that it contains any financial advice, is intended only as a “class service” provided by Edison within the meaning of the FAA (i.e. without taking into account the particular financial situation or goals of any person). As such, it should not be relied upon in making an investment decision.
United Kingdom This document is prepared and provided by Edison for information purposes only and should not be construed as an offer or solicitation for investment in any securities mentioned or in the topic of this document. A marketing communication under FCA Rules, this document has not been prepared in accordance with the legal requirements designed to promote the independence of investment research and is not subject to any prohibition on dealing ahead of the dissemination of investment research. This Communication is being distributed in the United Kingdom and is directed only at (i) persons having professional experience in matters relating to investments, i.e. investment professionals within the meaning of Article 19(5) of the Financial Services and Markets Act 2000 (Financial Promotion) Order 2005, as amended (the “FPO”) (ii) high net-worth companies, unincorporated associations or other bodies within the meaning of Article 49 of the FPO and (iii) persons to whom it is otherwise lawful to distribute it. The investment or investment activity to which this document relates is available only to such persons. It is not intended that this document be distributed or passed on, directly or indirectly, to any other class of persons and in any event and under no circumstances should persons of any other description rely on or act upon the contents of this document. This Communication is being supplied to you solely for your information and may not be reproduced by, further distributed to or published in whole or in part by, any other person.
United States Edison relies upon the “publishers’ exclusion” from the definition of investment adviser under Section 202(a)(11) of the Investment Advisers Act of 1940 and corresponding state securities laws. This report is a bona fide publication of general and regular circulation offering impersonal investment-related advice, not tailored to a specific investment portfolio or the needs of current and/or prospective subscribers. As such, Edison does not offer or provide personal advice and the research provided is for informational purposes only. No mention of a particular security in this report constitutes a recommendation to buy, sell or hold that or any security, or that any particular security, portfolio of securities, transaction or investment strategy is suitable for any specific person.
This website uses cookies so that we can provide you with the best user experience possible. Cookie information is stored in your browser and performs functions such as recognising you when you return to our website and helping us understand which section of the website you find more interesting and useful. See our Cookie Policy for more information.
Strictly necessary and functional
These cookies are used to deliver our website and content. Strictly necessary cookies relate to our hosting environment, and functional cookies are used to facilitate social logins, social sharing and rich-media content embeds.
Advertising
Advertising Cookies collect information about your browsing habits such as the pages you visit and links you follow. These audience insights are used to make our website more relevant.
Please enable Strictly Necessary Cookies first so that we can save your preferences!
Performance
Performance Cookies collect anonymous information designed to help us improve the site and respond to the needs of our audiences. We use this information to make our site faster, more relevant and improve the navigation for all users.
Please enable Strictly Necessary Cookies first so that we can save your preferences!