


DACH Industrial & Logistic Property

Author: Anna Bossong
Companies Mentioned
Source: Refinitiv at 21 June 2019
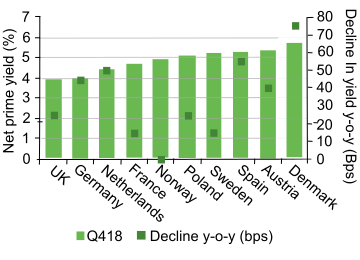
In 2018, after a second year of exceptionally strong portfolio investment and sustained industry demand for logistics properties, German net prime warehouse yields narrowed 45bp to 4.05% (see Exhibit 2). We also understand from Bulwiengesa that yields in sought-after smaller inner-city logistics properties contracted sharply, reflecting strong corporate demand. Austria saw lower, but also above-average for Europe, yield compression of 40bp to 5.40%, reflecting the trend for portfolio investors to seek yield.
Source: Refinitiv. Note: The above P/BV and P/E ratios are based on Refinitiv definitions of BV and EPS, which may not correspond with definitions used elsewhere in this report. Priced 20 June 2019.

Download PDF

Anna joined Edison in 2015, having previously been head of EMEA TMT research at UniCredit. She is a CFA charter holder with more than 10 years’ experience covering the TMT sector in the EMEA and MENA regions, as well as extensive experience in European, UK and Australian companies for ING, Daiwa and a predecessor of Merrill Lynch. Prior to this Anna qualified as an accountant in Australia.
Summary
German, Swiss and Austrian (DACH) industrial and logistics property markets look to be at a crossroads. Logistics properties, particularly in Germany, look set to remain an attractive investment area, helped by secular trends driving e-commerce demand and in-built supply constraints. In contrast, industrial properties face a number of headwinds in the short to medium term, principally from the threat of new trade tariffs and Brexit. Nevertheless, if a global downturn is avoided, we see pockets of the market having the potential to do well, particularly portfolios tenanted by consumer-oriented and non-auto related industries.E-commerce can still drive logistics market
E-commerce sales in the DACH region are forecast to grow 28% by 2023. Orders are becoming smaller and more frequent and consumers are set to buy more bulky grocery and fast-moving consumer goods (FMCG) products online. As a result, supply chains are expanding with the addition of new nodes, boosting demand for a range of new logistics sites.Logistics automation: Smaller, higher and faster
Developments in logistics technology related to the burgeoning e-commerce market point towards strong future demand for ‘last mile’ (potentially multi-floor) logistics sites in and near major urban centres, as well as fully automated sites at infrastructure nodes for logistics heavy lifting. At the same time, we foresee waning interest in smaller logistics sites away from major urban populations.Swiss underground system set to transform logistics
Swiss industry is backing a plan to construct an automated underground logistics system that is likely to revolutionise freight transport in Switzerland. The plan is to build out the system across the east-west transport corridor with green links into cities. We expect sites near the system’s hubs to become highly sought after. Likely winners- Well-connected urban sites to satisfy growing demand for last-mile logistics consolidation depots in and around major urban centres.
- Pan-European scale hub facilities in Germany as Brexit is likely to result in logistics firms moving more pan-European hubs from the UK to Germany.
- City-edge German industrial sites that can be used for residential builds.
- Property close to the hubs of the proposed Swiss underground logistics system where industry/logistics firms will want interfaces with the system.
- Road-based Swiss logistics properties, along the proposed Cargo Sous Terrain route, which are likely to see a drop in road-based freight transport.
- Industrial property, especially auto facing, if the global economy turns down.
- Logistics properties lacking automation potential or urban proximity.
| Mobimo | ||
| HIAG | ||
| Intershop | ||
| VIB Vermoegen | ||
| Deutsche Industrie REIT | ||
| Cargo Sous Terrain | ||
| Virgin Hyperloop One |
Executive summary
With global economic headwinds and trade conflicts likely to affect industry in DACH markets in the short to medium term, we see the potential for a divergence in the outlook for logistics and industrial (manufacturing) property. Growth in e-commerce as well as evolution in consumer buying habits and supply chains should continue to drive demand for well-positioned logistics space. In the industrial property sector, if realised, the threatened imposition of trade tariffs from the US and China as well as Brexit are likely to put pressure on Mittelstand industrial tenants, particularly those supplying auto industries. Assuming current trade conflicts do not precipitate a global downturn, we see the potential for some better-insulated industrial property portfolios to perform well in view of the acute shortage of well-located industrial property in Germany. We would focus on portfolios with tenants oriented to domestic markets (eg consumer goods, government) and limited exposure to auto production. DACH property investment companies discussed in this report include: Deutsche Industrie REIT (DIR), Mobimo, VIB Vermoegen, HIAG and Intershop. Shortage of supply driving property values: vacancy rates in DACH logistics properties have fallen to historical lows, reflecting strong underlying industry and investor demand for prime sites, high construction costs and onerous requirements on developers. Similarly, low rental prospects (relative to residential and office markets), strict zoning regulations, rising construction prices and construction capacity shortages have choked the supply of new industrial properties in recent years. Location and quality of site becoming more important: under intense pressure to cut delivery times and cater for more automated and complex supply chains, logistics firms face an increasing range of site requirements, differing by distance to populations, stores and transport nodes. In addition to mega-distribution centres, these include last-mile facilities, urban consolidation centres and third-party locker stores. Industrial tenants are also more demanding, requiring efficient workspaces with access to skilled workforces and transport infrastructure. With yield compression slowing, rental growth has returned to logistics:in 2018 the scenario of strong demand and constricted supply resulted in average rent increases of 5% in the European logistics sector, up from the normal 2–3% of the previous two years. Germany was at the forefront of the trend with rental growth at five of its seven logistics hubs exceeding 5%. We expect this rental growth to be sustained in the areas of tightest supply but for rents on secondary properties to be constrained by the low margins of the logistics industry. Switzerland and China have big plans: China’s Belt and Road Initiative is already a reality in Germany, which possesses the principal European rail depot for scheduled freight trains making regular trips to and from China. Equally, an ambitious Swiss automated underground logistics system looks set to transform Swiss logistics and may well become a model for other countries. Key sensitivities: increased warehouse automation and expansion of multi-story developments could weaken demand for logistics properties chosen primarily for employee access. Trade disruption and rising tariff barriers pose challenges to industrial property returns in the export-oriented DACH sector. An Amazon move into Switzerland would likely result in a surge in demand for logistics properties, with a positive impact on Intershop and HIAG. Slowing/negative yield compression or rising interest rates could affect property values, especially if rental growth stalls.Industrial/logistics property market
In 2018 both industrial and logistics property experienced continued strong demand from investors. Interest in the logistics sector continued to be fed by the boom in online shopping and evolving consumer habits (eg more frequent, smaller orders). This fuelled surging demand for warehouse space in major hubs and near urban centres. In the face of this strong demand, land supply shortages and high construction costs, particularly in Germany, rents moved upwards in response to slowing yield compression. At the same time, Colliers also reported that investor interest in purely industrial space was at an all-time high in Germany in 2018, reflecting the broader risk diversification and higher rental yields available in the sector when compared with logistics property.Yields and yield premiums at historically low levels
Apart from during the global financial crisis, the global yield on industrial property has declined steadily over the last 20 or so years to 4.6% in 2018, less than half of its peak of close to 10% in 1992 (see Exhibit 1). This can be attributed to sharp falls in global interest rates as well as a dramatic narrowing in yield premiums on industrial property versus the office and residential markets. We see this as primarily reflecting yield seeking by investors in response to low interest rates and the improving fundamentals of the logistics sector. In 2018, in a continuation of this trend, the yield premium to global office property declined further to a 30-year low of 40bp.Exhibit 1: Global yield comparison by property type
Source: CBRE, 2019 Global Industrial and Logistics Prime Yields
 Source: CBRE, 2019 Global Industrial and Logistics Prime Yields
Exhibit 2: Net prime yields warehouses >5,000 sqm
Source: BNP Paribas Real Estate, European Logistics Market – February 2019
 Source: BNP Paribas Real Estate, European Logistics Market – February 2019
Rental growth increased in 2018 as yield compression slowed
In 2018 European industrial property landlords pushed through rent increases averaging 5%, up from the 2–3% normal over the previous two years. This reflected the impact of slowing rates of yield compression and strong underlying industry demand in the sector. In Germany, the particularly strong position of landlords was amply demonstrated with five of the seven major logistic hubs experiencing rental growth rates in excess of 5% despite landlords benefiting from above-average yield contraction of 45bp. The increase was not uniform across the market, however, with Bulwiengesa data showing that the bulk of yield compression occurred in the sub-prime sector during 2018, versus a flat trend in prime warehouse/logistics yields. We see this as reflecting a switch in portfolio investment from prime to secondary properties during the year as occurred in the UK after e-commerce penetration rose to over 11%. In the Viennese logistics hub, rents grew a more moderate 2.5–5.0%, although landlords were rewarded with above-average yield contraction of 40bp to 5.40% (see Exhibit 2).Prospects of diverging trends between logistics and industrial property
Fuelled by the developments in e-commerce and with greater independence from the business cycle, we expect logistics property to remain attractive to investors relative to other property classes over the next one to two years. With an expected continuation of supply shortages in Germany, we also see the potential for further yield compression, assuming no upturn in interest rates.Exhibit 3: German gross initial yields by property type
Source: Bulwiengesa/Initiative Unternehmensimmobilien, H218
Exhibit 4: German rents by property class and type
Source: Bulwiengesa/Initiative Unternehmensimmobilien, H218
Industrial property more exposed to trade conflicts
As with the logistics sector, we note that supply of new industrial properties in Germany is very limited. Based on Bulwiengesa property pipeline data for 2019, the supply of both industrial and logistics properties looks set to be limited to only c 0.2% of the underlying stock value in each segment this year. Nevertheless, with regards to industrial property, we see a strong likelihood that China-US-EU tariff issues/currency wars, the fallout from Brexit and the problems of the auto industry will affect underlying demand for industrial property. We also see portfolio investors potentially re-risking DACH industrial property for these reasons. For the longer term much depends on whether the next year or two brings a resolution of the current trade conflicts between the US, EU and China as well as the outcome of Brexit. By 2020, we note, however, that there are prospects of the German auto industry successfully overcoming some of the current headwinds arising from new auto-emission rules, which have been partly to blame for poor auto sales data from the region. In the event of a sustained global cyclical downturn, we would expect a negative overall trend in auto and capital goods sales, especially if prompted by escalation of these trade disputes. Given this, we see industrial property oriented to domestic and non-commercial sectors (eg consumer goods production, government) as offering lower risk exposure to the sector. With regard to the outlooks of individual portfolios it is worth noting that owners of light industrial estates such as Deutsche Industrie REIT (DIR), with rentable space at only 53% of total land holdings and diversified portfolios with less than 3% exposure to the auto industry are quite well situated. Owners of portfolios such as these have the potential to increase rental income/development earnings by increased use of multi-storey buildings and the construction of office/residential space on sites in the proximity of urban areas. We also note the importance of tenant selection and lease terms in sustaining rental income and property values.Exhibit 5: Prime rents Q418, warehouses >5k square meters (sqm)
Source: BNP Paribas Real Estate, Property Report, European Logistics Market, February 2019. Note: Pink ≥90; light green: 70–89; mid-green: 50–69; dark green ≤50.
 Source: BNP Paribas Real Estate, Property Report, European Logistics Market, February 2019. Note: Pink ≥90; light green: 70–89; mid-green: 50–69; dark green ≤50.
Exhibit 6: Net prime yields Q418, warehouses >5k sqm
Source: BNP Paribas Real Estate, Property Report, European Logistics Market, February 2019. Note: Pink ≤ 5; light green: 6–7%; mid-green: 7–8%; dark green ≥8%.
 Source: BNP Paribas Real Estate, Property Report, European Logistics Market, February 2019. Note: Pink ≤ 5; light green: 6–7%; mid-green: 7–8%; dark green ≥8%.
Why invest in industrial property?
Financial investors overcame industry players to become the largest investors in logistics properties in Germany in 2017. Although low interest rates, inflation concerns and diversification are key incentives to undertake portfolio investment in property, investment in industrials and logistics brings additional benefits:-
- Portfolio diversification and exposure to fast-growing industries that are hard to invest in: investment in logistics property gives exposure to the e-commerce boom as well as the EU transport sector, which generates 9% of gross value added in the EU economy. Investment in industrial property also provides exposure to the largely unlisted Mittelstand companies sector.
- Above-average property yields versus other property categories.
- Minimal state involvement in terms of regulation and rent controls.
- Attractive lease contracts: logistics and industrial property leases often contain indexed rent clauses that protect the investor from inflation and triple-net clauses, where the tenant is solely responsible for the costs of the leased asset.
- Low refurbishment costs: Savills Investment Management puts the refurbishment cost for industrial property at typically less than €100 per sqm for logistics properties vs €300–500 per sqm for office property.
Exhibit 7: Map of key logistics sites in Germany
Source: BNP Paribas Real Estate
Exhibit 8: Manufacturing as % of total value added by country (2018)
Source: OECD National Accounts Statistics https://data.oecd.org
Geography matters
Germany: Well-connected logistics network at the heart of Europe Germany has a particular prominence in the logistic industry within the DACH region and in Europe. Its position at the heart of the Europe as well as its efficient road and rail links and sea ports means it is a top choice internationally for Europe-wide and local German distribution. Its position as a major export-oriented manufacturing nation added to its wealthy and decentralised multi-urban population has also contributed to the development of multiple major logistics hubs in Munich, Hamburg, Berlin, Leipzig, Dusseldorf, Cologne and Frankfurt. In terms of prime logistic rents, in Q418 Berlin and Munich were at the upper end of both German and Continental European ranges for warehouses over 5,000 sqm, at €86 and €84psm/year, respectively. Hamburg suffers most from lack of space but with lower regional importance, its prime rents were lower at €72psm/year (see Exhibit 6). Brexit may also bring some good news for owners in the German logistics space. At present a number of shippers and third-party logistics suppliers are reported to be looking to move their pan-European hubs from the UK to Continental Europe after Brexit, with Germany one of three top choices. With the centre of the EU also moving further east, Germany may also win further market share from the Benelux countries. Firms such as VIB Vermoegen with 65% exposure to logistics properties in Germany look well positioned in this regard.Industrial property: Long-term solid fundamentals vs cyclical economic factors
It is a mark of the strength and adaptability of industries in the DACH region that manufacturing value added has continued to be maintained at a significantly higher proportion of GDP than in the US, France, the UK and the EU as a whole (see Exhibit 8). Helped by strong capital goods exports around the world, but particularly to Asia, Germany has seen an increase in the relative size of its manufacturing sector over the last five years to 23% of total value added. Switzerland and Austria both stand at 19% versus a 16% average for the EU and 12% for the US. For the longer term, the ability of industry in the region to adjust to a high wage environment and increasing competition from Asian producers as well as to make high ongoing investments in technology should continue to serve the region well. At this point of an extremely long cyclical upswing, however, it must be said that the region’s significant exposure to the highly cyclical capital goods exports and rising levels of protectionism are significant risk factors for the future. In Germany, the current shortage of industrial land arising from high construction prices, shortages of construction capacity and stiff competition from the booming residential and office development markets have given landlords significant power to put through rent increases. Prime light manufacturing rents grew at a high c 12% CAGR between 2014 and 2018 to €104psm/year . Nevertheless, with the continuation of the current challenging conditions for industry, particularly the auto sector, we see the potential for vacancies to rise and rental growth to slow in the medium term despite the minimal amount of new supply (0.2% of value) in the 2019 construction pipeline. If this is accompanied by a decompression in yields caused by a re-risking of the sector by investors, then it may result in a downturn or a flattening in property prices. In the more optimistic scenario of the threatened tariff impositions from US and China not materialising and conditions in the auto industry improving, as the industry recovers from issues related to the introduction of new emissions standards, we see it as likely that ongoing rental growth would resume, underpinning property values.The rise of long distant rail: China’s Belt and Road Initiative
Exhibit 9: China Europe Rail Route and Frequency (2018) Source:Center for Strategic and International Studies,The Rise of China-Europe Railways Jonathan E Hillman, March 2018 China’s $900bn Belt and Road Initiative, which was launched in 2013, is already starting to have an impact on the logistics industry in Europe and the DACH region. The ‘China-Europe Railway’ initiative has been a prime mover in creating 65 regular freight train routes from 35 cities in China to 44 European destinations. At present, assisted by Chinese subsidies, these rail routes have significant cost advantages over air travel and speed advantage over sea travel. Helped by this, the number of freight trains journeys between China and Europe grew 73% to 6,363 in 2018. As part of the project, the German former rust-belt city of Duisberg, just north of Dusseldorf, was selected to be the principle European terminus for these freight services, becoming the world’s largest inland port. This has led to the number of Chinese businesses operating in the city increasing from 40 in 2014 to more than 100 in 2018 and created 6,000 logistics jobs. A study commissioned by the International Union of Railways estimates that Asia-Europe rail services will grow at a CAGR of 14.7% over the next decade, which could lead to a significant increase in demand for Germany’s onward logistics facilities. We have some concerns about the plans of the Chinese government to scale back subsidies, which may slow the growth in freight traffic. Nevertheless, the closer links between the two countries should result in increased Chinese investment in Germany and its infrastructure, which is likely to be positive for logistics and industrial property values.Switzerland: Potentially major changes in the works
Switzerland’s high land costs as well as heavily congested transport infrastructure and difficult terrain have made it unattractive as an international logistics hub. Nevertheless, transport is still an important industry supported by strong export industries and large-scale cross-border trade with the EU. Currently, close to 60% of logistics revenues are generated from bulk items where the whole load is transported directly to the end-user without the use of intermediary warehouses while Swiss Post still plays a major part in the courier, parcel and letter services business. The bulk of the country’s logistics services are located across the country’s east-west infrastructure and transport corridor between St. Gallen and Geneva. Unfortunately, the small size of the rental market for logistics facilities means that there is little public data on average rents. Credit Suisse Asset Management estimated rents at a high CHF70–103 (€63–93)psm in a 2018 report on the sector. We see two significant possible events as having the potential to transform the Swiss logistics industry in coming years. The first is the possibility that Amazon will establish operations in Switzerland in response to the Swiss government requirement from 1 January this year that e-commerce suppliers from outside the country pay VAT on shipments to Swiss consumers. The second is the potential fruition of plans by the Swiss company Cargo Sous Terrain (CST) (which includes Virgin Hyperloop One as a shareholder) to build a revolutionary fully automated underground freight transportation system spanning from Geneva to St. Gallen near the eastern border of the country, that would completely transform the industry.Amazon to enter the Swiss market?
Within the DACH region, Austria and Switzerland lag Germany in terms of e-commerce. In 2018 only 60% of individuals in Austria and 71% in Switzerland purchased goods or services online, versus 77% in Germany. It is also worth noting that although Swiss consumers buy significant quantities of goods online, the lack of a local Amazon platform means the purchases are made on foreign platforms and much of the fulfilment work is done abroad. As discussed above, new laws were introduced at the beginning of this year requiring larger foreign e-commerce providers to charge VAT on sales in Switzerland. We see this as providing an incentive for e-tailers such as Amazon to establish logistics facilities in Switzerland to reduce cross-border friction. If it happens it would be easy to understate the potential impact of this on the market – in 2017 Savills reported that Amazon was absorbing 25% of big-shed take-up in the French market as part of its rollout in France. As such, this could present significant opportunities to owners of existing Swiss logistics facilities such as HIAG and Intershop Holdings, as well as potentially result in potential new logistics development projects for major Swiss land-owner HIAG.Cargo Sous Terrain: Working to create a visionary Swiss logistics system
CST and its large group of stakeholders, including many of Switzerland’s largest transport, logistics and infrastructure providers, propose to build the network under the existing logistics road corridor between St. Gallen and Geneva. The above-ground route is already heavily congested. As a result, forecasts of a 37% increase in the volume of goods to be transported in Switzerland between 2010 and 2040 have led for calls for an environmentally friendly solution. The system will work by loading cargo into small, automatic, driverless containers that travel on wheels utilising an electric drive with induction rails. These will operate in three-track tunnels and travel at a constant speed of around 30km per hour. An overhead track attached to the ceiling of the tunnel will also transport smaller parcels at higher speeds. By enabling a continuous flow of containers the system should make it economic to ship as little as two pallets rather than whole truckloads as now. Operated entirely with renewable energy, the system is expected to also have significant environmental advantages over road transport, emitting 80% less CO2 per tonne of goods transported. CST estimates that the implementation of the system should result in the removal of 40% of heavy good vehicles from Swiss roads and reduce city logistics delivery traffic by 30%. According to the company, reduced noise emissions and land usage will also make the system greener than all other transport scenarios, even after the introduction of electrically drive HGV’s. The Swiss Federal Council has been evaluating the project since January 2018 as a precursor to presenting an enabling legislation proposal to the Swiss Parliament. The partners, which include several major Swiss banks, have pledged CHF100m (€90.3m) towards the project. They are expected to undertake further rounds of fund raising and loan issuance in order to enable construction of the first 70km segment between a logistics hub at Harkingen Niederbipp (see Exhibit 10) and Zurich, which is expected to take place between 2025 and 2030 at a cost of CHF10bn (€9.0bn). The full network is scheduled for completion by 2045 at an additional total cost CHF30bn (€27.1bn), which the partners intend to fund without public subsidies. Once complete it is expected to have more than 500km of tunnels served by 80+ hubs, mostly at the sites of existing logistics hubs. CST also plans to create one million sqm of underground space and numerous city logistics systems to minimise emissions.We anticipate that project approval will result in increased in interest in logistics property located around the system’s planned hubs. This assumes logistics firms will see significant cost and speed benefits from using the system and will therefore wish to build partly or fully automated warehouses at the hubs that are directly integrated into the CST system. Considering CST’s ambitions for the system to encourage small automated shipments, we envisage some industries wanting to locate and integrate production into the CST hubs. For example, fresh-food suppliers and 3D printers could choose to convey their goods direct from the production line to urban destinations and other transport nodes around the country using just-in-time principles. With road freight volumes expected to decline, we also expect a reduction in demand for more marginal logistics properties without significant infrastructure or urban access advantages. Additionally, CST expects the system to enable users to reduce their temporary storage space requirements by virtue of the continuous flow system. CST also plans to build large underground storage areas, such that we expect there to be a reduction in overall demand for above-ground warehouse space. Helped by this, we expect to see greater demand for smaller warehouses at the CST hubs as well as smaller urban and urban-edge last-mile sites near CST-linked infrastructure. The likelihood of premium rents being charged at the system’s hubs and the advantages of direct, automated connection with the CST system should also motivate logistics companies to adopt higher levels of automation and to adapt to the use of multi-storey warehouse properties.Exhibit 10: Proposed Swiss Cargo Sous Terrain automated logistics tunnel plan
Source: Cargo Sous Terrain Exhibit 11: Proposed Swiss Cargo Sous Terrain planned integrated logistics systemSource: Cargo Sous Terrain Austria: Regional hub and city focus
Austria’s largest logistics hub – the only one with 5,000+ sqm warehouses – is situated just outside its capital city, Vienna. In addition, the country has numerous smaller logistics centres on its major east-west transport corridor and in the southern city of Graz. A key focus of logistics in Austria is its international transit functions, reflecting its geographic position and its direct rail and road links to seven countries on its borders. The Vienna hub faces competition for its regional distribution functions from nearby lower-cost hubs in the Slovakian capital Bratislava and the Hungarian capital Budapest, where rentals are 57% and 66% of Vienna’s 2018 average of €82psm (see Exhibit 5). Nevertheless, its position as a major regional hub is strongly supported by its highly efficient transport and logistics infrastructure, as attested by its fourth position in the UN rankings for world logistics performance in 2018.Market drivers
The e-commerce revolution: Driving demand for logistics space The boom in e-commerce is driving demand for logistics space across Europe and the DACH region. JLL reported recently that demand for European e-fulfilment space increased 68% in H118. Statista forecasts European and DACH e-commerce sales revenues to grow by a total of 33% and 28% between 2019 and 2023.Exhibit 12: E-commerce revenues
Source: StatistaUS$bn 2017 2018e 2019e CAGR 2018–23e Austria 7.7 8.1 8.8 7.2 Germany 66.7 70.3 75.4 6.5 Switzerland 7.6 8.0 8.6 6.8 DACH 82.0 86.4 92.8 6.6 Change (%) – 5.4 7.4 – Volumes of goods in supply chains set to outstrip growth in e-commerce
A number of factors indicate that supply chains in the DACH region will have to grow more rapidly than the rates solely dictated by the growth in e-commerce revenues. These include:- expectations of a take-off in sales of bulky grocery and FMCG items in keeping with UK and US trends;
- the trend for consumers to purchase smaller items more often as delivery speeds improve;
- growing urbanisation, which is increasing the addressable market for e-commerce;
- growing competition among e-tailers in the areas of product choice, speed of delivery and stock availability, requiring innovative solutions and additional nodes in logistics chains;
- high levels of returns volumes versus store sales; and
- The trend for manufacturers and retailers to outsource production steps to logistics firms.
Online logistics require triple the logistics space of physical stores
Reflecting these circumstances, Prologis estimates online commerce outlets now require an average of three times more logistics space than physical stores. Taking into account that online stores are estimated to have taken only a 12% share of total retail trade in Germany as of 2018 (source: Bevh), with similar amounts in Switzerland and Austria, there appears little reason to expect a slackening in demand for logistics space oriented to e-commerce deliveries in coming years.Exhibit 13: Proportion of individuals who used the internet and bought goods online in 2018 Source: Eurostat, International Telecommunications union, GlobalwebIndex (Switzerland, for Q2 and Q3 2018)Exhibit 14: Proportion of internet users who bought/ordered goods or services for private use Source: EurostatAutomation and digitalisation: Smaller, higher and faster
Automation and digitalisation are revolutionising the logistics industry and having major influence on the types of logistics properties that will be in most demand in future years. Robotised automated storage and retrieval systems (RASRs) have become increasingly common in mega-distribution centres across Europe. These enable the industry to add scale and increase efficiency while reducing staff requirements, which can often dictate the location of traditional warehouses. Their key advances lie in:- Eliminating the need for staff to store and retrieve stock from the warehouse’s shelves.
- Increasing warehouse capacity by reducing aisle sizes and enabling higher shelving systems.
- Enabling employees to place stock randomly on shelves (after scanning the product and shelf’s bar code), thereby increasing stock density, employee efficiency and ease of access to single items (important in e-commerce).
- Having the RASR deliver whole shelves to employees to pick and restock at the same time, further reduces labour inputs.
- Multi-party open collaboration platforms to bundle and optimise last-mile deliveries.
- Urban consolidation centres to streamline the flow of deliveries into cities.
- high levels of returns volumes versus store sales; and
- The application of mix-move-match concept, whereby orders are assembled close to customer delivery locations. Collaborative routing further reduces overall van numbers and traffic levels.
- Third-party parcel lockers to streamline deliveries from multiple sellers to multiple buyers.
- Multi-storey logistics buildings for plot efficiency. These are well established in Asia, with Hong Kong warehouses, for example, averaging 12 stories. Adoption in Europe has been slow as it requires heavy investment in small trucks fleets capable of using ramps, but in coming years we see strong prospects for them being adopted in crowded hubs and urban sites in Europe as e-commerce volumes grow.
- Predictive analytics to enable more targeted and therefore lower overall stock levels.
- The ‘physical internet’ whereby items are sent individually and automatically through the supply chain, being routed at each node (eg port, rail terminal), depending on factors such as time, cost, utilisation etc before being assembled close to or at the final destination. The aims are cost reductions and reliability but the demands on industry players to collaborate may make it unworkable.
- Fully automated and integrated underground logistics systems as proposed in Switzerland.
- Drones and driverless vehicles for use in last-mile logistics.


The next trend is smaller urban logistics centres
We expect many of these developments will lead to a greater variety of smaller logistics spaces in the future, especially within and around urban centres. With increased collaboration and automation, they should also slow the required expansion in total logistics space and employee numbers relative to growth in e-commerce goods volumes. With the expected growth in high volume online grocery and FMCG sales, mega-sized automated facilities at infrastructure nodes should be able to undertake most of the heavy lifting. The greatest uplift in site value is likely to take place in the smaller last-mile outlets in and around urban centres. We believe smaller sites located near large pools of employees (a must-have for manually operated logistics centres) but with poor proximity to urban markets are likely to do less well.DACH likely to continue to lead in automation and innovation
The results of the 2018 UN survey into logistics shows how seriously the DACH countries take the quality of their logistics infrastructure and timeliness of delivery. As shown in Exhibit 15, in terms of speed of delivery all three countries in the region rate ahead of the US, France and Spain and in line or ahead of the Netherlands and Sweden. Considering this attention to delivery speed and the low unemployment/high wage levels in the region, we expect the DACH countries to maintain their position at the forefront of future logistics technology. Exhibit 15: UN ratings of global logistics performance: DACH world-leading region Source: United Nations: Logistics Performance Indicators, 2018What sort of companies are likely to do well?
We believe investors should look for investment vehicles with the following features:-
-
-
- A strong tenant mix.
- Good infrastructure connections.
- Positioned for secular drivers or the potential for properties to fulfil future tenant needs.
- Exposure to forward-oriented logistics properties, eg last mile, high automation.
- Invested in industrial properties on key transport corridors with strong international connections.
- Strong property pipelines with the potential to add value within the existing portfolio.
- Strong technical specialisation, eg Mobimo in conversions of industrial property.
- Ability and strategy to enhance value of existing properties, eg boosting lettable space.
- Vacancy rates: structural problem or growth opportunity?
- Balance sheet risk supported by revenue flows.
- Development potential of land bank: ability to increase valuation with infill and going vertical.
- Diversified rental client base, with larger and smaller firms.
- Regionally ‘relevant’ firms that have above-average prospects to attract municipal/government aid in difficult times.
-
-
What sort of companies will struggle?
We highlight the following areas of potential concern:-
-
-
- High exposure to highly cyclical sectors given the late stage of the current business cycle.
- Balance sheet risk not supported by revenue flows.
- Exposure to property classes likely to fall out of favour.
- High exposure to weaker regions.
-
-
Key trends to invest for
-
-
-
- Growth in demand for last-mile logistics consolidation depots in and around major urban centres.
- Brexit resulting in the migration of a number of pan-European hubs from the UK to Germany according to industry feedback. Moving the centre of the EU further east is likely to result in more pan-EU hubs being migrated from the Benelux countries to Germany.
- Values of industrial property around German city centres rising due to strong demand for residential land as well as competition for available space from logistics and office developers.
- Increased demand for Swiss logistics property at the planned hubs of the Cargo Sous Terrain automated underground system.
-
-
| Price (lc) | Market cap (€m) | Free float (%) | ||
| Mobimo | 1,533 | 99.6 | ||
| Deutsche Industrie REIT | ||||
| VIB Vermoegen | 677 | 94.2 | ||
| Intershop | ||||
| HIAG | ||||
| Average | 871 |
| Price/BV (x) | P/E (x) | |||||
| 2019 | 2020 | 2018 | 2019 | 2020 | ||
| Mobimo | 1.1 | |||||
| Deutsche Industrie REIT | 2.0 | 16.5 | ||||
| VIB Vermoegen | ||||||
| Intershop | 942.8 | 8.3 | ||||
| HIAG | ||||||
| Average | 189.6 | |||||
| Dividend yield (%) | |||
| 2019 | 2020 | ||
| Mobimo | 4.0 | ||
| Deutsche Industrie REIT | 1.7 | ||
| VIB Vermoegen | |||
| Intershop | 4.4 | ||
| HIAG | |||
| Average | 3.3 | ||
Company Summaries
Deutsche Industrie REIT
Corporate overview
DIR invests principally in sustainable light-industrial real estate in Germany, including property for the storage and distribution of goods, administration and production. Founded in 2014, at 31 March 2019 the portfolio consisted of 49 properties with 1.08m m2 of rentable space on 2.05m m2 of land. At that point the group had a pro-forma weighted average lease term of 5.2 years and a loan to value ratio of 58.3%. Property holdings consist principally of medium to large industrial and commercial estates diversified over nine major industries. DIR’s strategy is to acquire established properties with strong infrastructure links and regionally important tenants, then develop the properties to increase the proportion of rentable space and the overall rental yields of the properties.
Portfolio rental income breakdown (31 March 2019)
Bear
- Some production tenants are likely to be affected in the event of a no-deal Brexit and increasing protectionism in foreign markets.
- In the event of a recession, access to credit may be constrained.
- Relatively high average borrowing costs of 3.3%.
- Significant exposure to secondary industrial properties that are likely to become less liquid in a credit crunch.
- Recent refinancing increased the LTV from 57.1% to 58.3% in the six months to 31 March 2019 vs DIR’s c 60% credit pipeline.
Bull
- Portfolio of well-established properties with good infrastructure connections that are managed proactively to increase value.
- Potential to expand rental income via development and more intensive utilisation of existing rented properties. The ratio of rentable space to total land totalled only 53% at 31 March 2019.
- A highly diversified portfolio, with a good mix of use classes, industries and geographies.
- Lean management structure with clear development strategy.
- High 29% portfolio weighting towards attractive logistics segment.
- 44.4% of total rent is derived from the top 10 clients who are solvent. Top 10 pharma, online/mail order, defence, logistics, government, consumer goods and cosmetics total 30%.
- Added security from strategy of focusing on firms with high regional importance to local governments (eg major employers).
- DIR provides access to investments in property classes between those bought by institutional and private investment classes.
- Low (< 3% exposure) to the embattled German auto industry.
- Following recent acquisitions DIR forecasts a rental yield of 9.6% on its pro-forma portfolio of 15.05.19 up from 8.9% at 31.03.19. This represents a 6.7% rental yield at a share price of €13.0.
Financials (€m)
Total assets*: 241.5
Net debt*: 107.7
Revenues: 11.6
PBT: 12.45
LTV*: 40.2%
FFO ps: €0.37
EPRA EPS: N/A
EPRA NAV ps*: €5.46
(2018) Note: *31.03.19
Valuation
Price: €15.7 (20/06/19)
P/EPRA NAV: 2.9x
P/FFO 2018: 42.4x
Dividend yield: 0.6%
Regional Focus
Country: Germany
Code: JB7.DE
HIAG
Corporate overview
HIAG is Swiss property investor with a 137-year history, an extensive Swiss industrial property land bank and an investment timeline of 50–100 years. At YE18 HIAG owned 114 properties with a surface area of 2.7m m², of which 0.9m m² over 45 sites was earmarked for site redevelopment. A 1.8bn property pipeline to 2026 is planned to increase leasable space by 639,000m² from the 575,000m² of YE18. The portfolio is focused on major cities, industrial areas and transport axes, particularly Zurich (57%), north-west Switzerland and Geneva (13%). Ex-redevelopment properties the EPRA vacancy rate was 12.1% in 2018. The group’s LTV ratio was 43.4% at end-2018, with a target to keep it below 50%, and an equity ratio of 49.1%.
Portfolio rental income breakdown (31.12.18)
Bear
- High vacancy rate in yielding properties of 12.1%.
- Forecast population declines in low-immigration Switzerland could impact residential property demand longer term.
Bull
- 0.9m m2 development land bank in country with a shortage of buildable land.
- Major CHF 1.8bn project pipeline to 2026: 50 projects, 639k m2 using existing property assets.
- Targeted portfolio segmentation strategy with core (c 40%) aimed at cash flow generation, opportunistic (c 20%), and manage-to-core (c 40%) for long-term gains.
- Strict zoning regulations in Switzerland are likely to lead to strong appreciation of logistics and distribution assets.
- Diversified tenant base: 31% of revenue came from 10 major clients in 2018 with residential revenues totalling 16%. Average lease term was 9.7 years at YE18.
- The Swiss market offers high tech related growth opportunities, economic and political stability.
- Financially secure: average loan duration three years with potential to raise capital secured to assets (100% unsecured).
- Team is small (c 60) and focused on property management and development management, so there is no pressure to have a continuous stream of building projects.
- Dividend clarity via minimum 60% of FFO I profits distribution policy.
- Management targets reducing vacancy rates on yielding properties from 12.1% to 10% through further development.
Financials (CHFm)
Total assets: 1,599
Net debt: 667.4
Revenues (incl. revaluations): 142.7
PBT: 70.3
LTV: 43.5%
FFO ps: N/A
EPRA EPS: CHF4.2
EPRA NAV ps: CHF 108.5
DPS: CHF3.9
(2018)
Valuation
Price: CHF 123.5 (20/06/19)
Price/BV 2018: 1.1x
P/EPRA EPS: 29.1x
Dividend yield: 3.2%
Regional Focus
Country: Switzerland
Code: HIAG.DE
Intershop Holding
Corporate overview
Intershop Holding (IHAG) is a Swiss property developer/investor with an end-2018 diversified portfolio of 54 properties (11 for development) with a leasable area of 578,127 m2. At end 2018, 60% of the portfolio was located in Zurich and 23% in Geneva, with the remainder along major Swiss traffic arteries. IHAG’s strategy is to acquire well-located properties with potential for value uplift via development, prioritising rental security over growth. To optimise returns, IHAG targets an LTV of c 67% on new purchases and plans to buy small and medium-sized properties. In 2018 the portfolio generated a net return of 5.4% and had a vacancy rate of 9.8%. A recent debt repayment and share buy-back reduced the LTV to a pro-forma c 40% (2018: 45.2%).
Portfolio breakdown by value (31.12.18)
Bull
- Following recent property sales, a share buy-back and debt repayments the balance sheet is well positioned for growth with an LTV of c 40% vs a target LTV of c 67%.
- Management forecasts an unchanged ROE for 2019 of 8%.
- Low average borrowing rate of 2.0%, with average 5.3-year remaining loan terms.
- As a matter of policy property rents are linked to inflation or interest rates (the latter for residential property).
- IHAG has a low-risk investment strategy, which puts focus on revenue security over growth.
- Company achieved a 12.3% increase in NAV ps in 2018 helped by revaluations and asset disposals.
- NAV ps has grown at a CAGR of 6.4% over the last four years.
- Property sales in 2018 and vacancies arising from new development projects have led management to forecast a c 10% fall in rental income and unchanged vacancy rates of 9.8% in 2019.
- A strategic focus on the lower and mid-level price segment of the rental market should reduce rent volatility but may also increase exposure to the economic cycle.
- Including gains from property sales and revaluations, IHAG reported a 106% increase in PBT in 2018 to CHF154m. Nevertheless, after adjustments, including extraordinary profits of CHF120m, cash flow from operations totalled CHF23.1m, down from CHF50.1m in 2017.
Financials (CHFm)
Total assets: 1,454
Net debt: 455.2
Revenues: 174.5
PBT: 154.4
LTV: 45.2%
FFO ps: N/A
EPS: 53.6
NAV ps*: CHF 347.7
DPS: CHF 22
(2018)
Note:* Book value excluding revaluation gains. EPRA NAV data is not published.
Valuation
Price: €497 (20/06/19)
Price/BV 2018:1.4x
P/EPS 2018:32.0x
Dividend yield: 4.4%
Regional Focus
Country: Switzerland
Code: ISN.S
Mobimo
Corporate overview
Mobimo is a diversified property investment and development company with exposure to residential, office, retail, hotel/catering and industrial property. The group’s portfolio at end 2018 consisted of 137 properties divided by value into 75% investment and 25% development, in keeping with the group’s strategic target. Mobimo looks to generate stable and predictable income streams from its portfolio. In its in-house development operations, it is able to claim particular expertise in innovative development of highly complex properties and mixed-use plots. Recent developments have included conversion of large industrial sites to multi-use spaces including retail, co-working, events and industry.
Portfolio rental income breakdown (31.12.18)
Bear
- Residential market values affected by Swiss National Bank fiscal tightening and strong CHF.
- Outlook for declining Swiss population likely to impact residential property demand.
- Lacking in exposure to fast-growing logistics market.
Bull
- Diversified portfolio promotes earnings and valuation stability.
- Management forecasts successful execution and rental of Mobimo’s current construction pipeline of CHF410m to result in a 9.2% CAGR in rental income to CHF136m by 2020.
- Portfolio vacancy rate brought down from 4.9% to 2.9% in 2018 through increased marketing.
- Swiss residential property laws are expected to remain more landlord friendly than is the case in Germany.
- Mixed-use development specialisation enables valuation uplift on industrial sites.
- Attractively low net debt to assets of 41% brings financial security and ability to expand with increased leverage.
- Current planning pipeline up CHF100m to CHF470m over last year. Potential target rental of CHF23m from full realisation.
- Stability of Swiss economy attracts strong foreign investment property demand.
- Current planning pipeline up CHF100m to CHF470m over last year. Potential target rental of CHF23m from full realisation.
- Stability of Swiss economy attracts strong foreign investment property demand.
- Strong dividend payer, with decade of continuous dividend payment.
Financials (CHFm)
Total assets: 3,365.2
Net debt: 1387.1
Revenues: 180.5
PBT: 109.7
LTV: 45.1%
FFO ps: N/A
EPRA EPS: CHF 7.78
EPRA NAV ps: CHF 228.5
DPS: CHF 10.0
(2018)
Valuation
Price: CHF257.5 (20/06/19)
Price/EPRA NAV 2018: 1.0x
P/EPRA EPS 2018: 33.1x
Yield: 3.9%
Regional Focus
Country: Switzerland
Code: MOBN.S
VIB Vemoegen
Corporate overview
VIB Vermoegen invests primarily in logistics, light industrial and out-of-town retail properties in southern Germany. The company seeks to generate a high, stable earnings stream from a long-term investment horizon supported by property purchases and active in-house portfolio development and management. At end 2018 the company had a total of 108 properties with rentable area of 1.2m m2 and vacancy rates of c 0.8%. The group has a conservative loan to value ratio of 51.0% and intends to expand its investment in logistics facilities in view of the lack of suitable green-field opportunities.
Portfolio rental income breakdown (2018)
Bull
- High-quality portfolio with very low vacancy rates of 0.8%.
- The group’s highly successful out-of-town retail parks and garden centres provide diversification from the industrial oriented property core.
- Helped by long-term financing, the average interest rate on debt was low, at 2.33% in 2018.
- The group’s target LTV of 50–55% vs the end-2018 51% gives it the potential to strongly increase investment before it will need to raise new equity funds.
- The group benefits from low financing costs with average interest rates on its credit portfolio of 2.3% in 2018.
- Strong track record of increasing DPS.
- Dividend distribution is a relatively low 40% of FFO (funds flows from operations).
- Relatively low level of portfolio diversification due to strong focus on logistics properties and Southern German region.
Financials (€m)
Total assets: 1,235.0
Net debt: 610.1
Revenues: 86.8
PBT: 71.2
LTV: 51.0%
FFO ps: €1.64
EPRA EPS: €1.51
EPRA NAV ps: €20.3
DPS: €0.65
(2018)
Valuation
Price: €24.7 (20/06/19)
Price/bv 2018:1.2x
P/FFO 2018: 15.1x
Dividend yield: 2.6%
Regional Focus
Country: Switzerland
Code: ISN
| Frankfurt +49 (0)69 78 8076 960 Schumannstrasse 34b 60325 Frankfurt Germany | London +44 (0)20 3077 5700 280 High Holborn London, WC1V 7EE United Kingdom | New York +1 646 653 7026 1,185 Avenue of the Americas 3rd Floor, New York, NY 10036 United States of America | Sydney +61 (0)2 8249 8342 Level 4, Office 1205 95 Pitt Street, Sydney NSW 2000, Australia |