Last close As at 05/08/2026
GBP2.91
▲ 1.00 (0.34%)
Market capitalisation
GBP504m
Research: Investment Companies
Utilico Emerging Markets
Utilico Emerging Markets |
Focused emerging market investment |
Investment trusts |
7 July 2016 |
Share price/discount performance
Three-year cumulative perf. graph
Gearing
Analysts
|
|||||||||||||||||||||||||||||||||||||||||||||||||||||||||||||||||||||||||||||||||||||
Utilico Emerging Markets (UEM) aims to generate long-term total return from investing in emerging market equities, primarily in infrastructure and utility companies considered to have above-average growth prospects with a relatively low risk profile. More than 95% of the portfolio is invested in quoted companies, with the majority paying a dividend, which is reflected in the current fund yield of 3.3%. UEM’s NAV total return has consistently outperformed the MSCI Emerging Markets index and is ahead of the global emerging market peer group average over one, three, five and 10 years; since inception in 2005, the annualised NAV total return is 11.4%.
12 months ending |
Total share price return (%) |
Total NAV |
MSCI Emerging Markets (%) |
MSCI EM |
Performance fee benchmark (%) |
30/06/12 |
1.3 |
(1.9) |
(13.7) |
(3.0) |
7.9 |
30/06/13 |
11.3 |
14.6 |
6.8 |
7.2 |
6.1 |
30/06/14 |
9.4 |
6.5 |
1.7 |
1.9 |
7.0 |
30/06/15 |
6.8 |
5.1 |
3.5 |
0.4 |
8.0 |
30/06/16 |
5.1 |
8.2 |
3.9 |
9.9 |
8.0 |
Note: Twelve-month rolling discrete £-adjusted total return performance. Performance fee benchmark subject to an 8% minimum from April 2014.
Investment strategy: Infrastructure/utility investment
Manager Charles Jillings adopts a disciplined bottom-up stock selection process, investing primarily in established, cash-generative infrastructure and utility companies with strong franchises in emerging markets. The fund aims to generate long-term total return. Jillings and his team have built up a bespoke database of c 900 potential investee companies and stocks are selected following thorough fundamental research and a valuation assessment. The team also regard meeting company managements as an integral part of their investment process. The resulting portfolio of c 60-90 high-conviction stocks is held for the long term; the manager does not follow short-term moves in the stock markets.
Market outlook: Higher growth and lower valuation
Despite periods of volatility in share price indices, emerging markets have outperformed developed markets (measured by the FTSE All-Share index) over the last 10 years. Emerging markets continue to offer the potential for higher economic growth versus developed economies, helped by rising infrastructure spending and expanding middle classes. Relative valuation measures also favour emerging markets; P/E and price-to-book multiples are lower than for the World index and the dividend yield is higher.
Valuation: Discount wider than historical averages
UEM’s share price discount to cum-income NAV of 11.3% is wider than the 12-month average of 10.4% (range of 3.9% to 16.3%), and wider than the averages of the last three, five and 10 years of 8.2%, 7.9% and 8.3% respectively. UEM has a history of stable or rising dividends, compounding at an annual rate of 4.24% over the last five years. UEM’s current dividend yield of 3.3% compares favourably to the peer group average of 2.9%.
Exhibit 1: Trust at a glance
Investment objective and fund background |
Recent developments |
||||||||||||||||||||||||||||||||||||||||||||||||||||||||||||||||||||||
Utilico Emerging Markets’ investment objective is to provide long-term total return by investing predominantly in infrastructure, utility and related sectors mainly in emerging markets. |
■ 21 June 2016: Annual results for 12 months ended 31 March. Diluted NAV TR -0.5% versus benchmark TR -8.8% (sterling adjusted). ■ 21 June 2016: Chairman Alexander Zagoreos to stand down at September 2016 AGM; he will be replaced by John Rennocks. ■ 4 May 2016: Fourth quarterly dividend of 1.625p declared. |
||||||||||||||||||||||||||||||||||||||||||||||||||||||||||||||||||||||
Forthcoming |
Capital structure |
Fund details |
|||||||||||||||||||||||||||||||||||||||||||||||||||||||||||||||||||||
AGM |
September 2016 |
Ongoing charges |
1.1% |
Group |
ICM |
||||||||||||||||||||||||||||||||||||||||||||||||||||||||||||||||||
Interim results |
November 2016 |
Gearing |
2.7% |
Managers |
Charles Jillings |
||||||||||||||||||||||||||||||||||||||||||||||||||||||||||||||||||
Year end |
31 March |
Annual mgmt fee |
0.65% |
Address |
UK office: PO Box 208, |
||||||||||||||||||||||||||||||||||||||||||||||||||||||||||||||||||
Dividend paid |
Sep, Dec, Mar, Jun |
Performance fee |
15% of outperformance (cap: 1.85% of average net assets) |
||||||||||||||||||||||||||||||||||||||||||||||||||||||||||||||||||||
Launch date |
20 July 2005 |
Trust life |
Indefinite (continuation vote) |
Phone |
+44 (0)1372 271486 |
||||||||||||||||||||||||||||||||||||||||||||||||||||||||||||||||||
Continuation vote |
AGM 2016 and 5-yearly |
Loan facilities |
£50m facility |
Website |
|||||||||||||||||||||||||||||||||||||||||||||||||||||||||||||||||||
Dividend policy and history |
Share buyback policy and history |
||||||||||||||||||||||||||||||||||||||||||||||||||||||||||||||||||||||
The fund is managed for total return, but the board broadly seeks flat or rising dividends. |
Subject to annual renewal, UEM has authority to repurchase up to 14.99% and to allot shares of up to 10% of the issued share capital. Financial years shown. |
||||||||||||||||||||||||||||||||||||||||||||||||||||||||||||||||||||||
|
|
||||||||||||||||||||||||||||||||||||||||||||||||||||||||||||||||||||||
Shareholder base (as at 16 June 2016) |
Portfolio exposure by sector (as at 31 May 2016) |
||||||||||||||||||||||||||||||||||||||||||||||||||||||||||||||||||||||
|
|
||||||||||||||||||||||||||||||||||||||||||||||||||||||||||||||||||||||
Top 10 holdings (as at 31 May 2016) |
|||||||||||||||||||||||||||||||||||||||||||||||||||||||||||||||||||||||
|
|||||||||||||||||||||||||||||||||||||||||||||||||||||||||||||||||||||||
Source: Utilico Emerging Markets, Edison Investment Research, Bloomberg, Morningstar, Thomson. Note: *N/A where not in May 2015 top 10.
Market outlook: Favourable outlook for investment
Following the 2008 financial crisis, emerging markets initially followed a strong uptrend, but performance has been relatively flat in sterling terms over the last five years, albeit with periods of significant volatility. Despite more recent weakness, emerging markets have outperformed developed markets, represented by the FTSE All-Share index (Exhibit 2, left-hand side) over the last 10 years. Within this environment, infrastructure stocks have performed better than the wider emerging markets. Stock price volatility in recent years has resulted from, among other things, slowing growth expectations, weak commodity prices and sharp currency moves. However, according to the International Monetary Fund’s April 2016 World Economic Outlook, growth expectations for emerging markets remain ahead of those for developed markets; the reasons for this include rising infrastructure spending, demand for financial services and higher consumption as a result of rising middle classes.
|
Exhibit 2: Market performance and valuation |
|
MSCI EM, MSCI EM Infrastructure and FTSE All-Share indices’ £-adjusted total return performance rebased to 1 June 2006 |
MSCI Emerging Markets and MSCI World indices’ valuation metrics at 31 May 2016 |
|
|
|
Source: Thomson Datastream, Edison Investment Research |
|
As shown in Exhibit 2 (right-hand side), the valuation of emerging markets versus the World index is lower in terms of both P/E and price-to-book and they also offer a more attractive dividend yield. For investors wishing to have exposure to emerging markets, a fund focusing on the relatively stable, cash generative infrastructure and utilities sectors may hold appeal.
Fund profile: Infrastructure and utility investment
UEM was launched in July 2005. It is a Bermuda-registered investment company listed on the premium segment of the London Stock Exchange. Its objective is to achieve long-term capital return via investment in emerging market infrastructure, utility and related sectors. The fund is run on a bottom-up basis, without regard to index weightings, but the MSCI Emerging Markets index is used as a comparison. There is flexibility to invest in other asset classes as well as equities; up to 5% of the portfolio can be in unquoted securities. Other internal investment parameters are in place: no single investment should exceed 10%; top 10 investments should not exceed 60%; a single country has a maximum exposure of 30%; single sector exposure should not exceed 25%; and investments outside the core infrastructure and utility sectors should not exceed 20%. Gearing of up to 25% is permitted. The benchmark for the performance fee is the FTSE UK Gilt five- to 10-year index post-tax yield, plus RPIX inflation, plus 2%, subject to an 8% minimum hurdle rate and is capped at 1.85% of average net assets. Since launch, UEM has been managed by Charles Jillings, who works for Bermuda-based ICM. From inception to the end of FY16, UEM’s NAV has compounded at an annual rate of 11.4%.
The fund manager: Charles Jillings
The manager’s view: Investment opportunities abound
The manager approaches the market as an owner of assets, without reference to the composition of the MSCI Emerging market index. For example, the portfolio has no exposure to Russia or South Africa, which are sizeable weightings within the index. He highlights two countries where portfolio exposure has been increased: Romania and Mexico.
Romania – the country has a population of 20 million, with GDP per capita of $22,000. It has benefited significantly since the IMF bailout in 2009; there is now more monetary and fiscal prudence at the government level and there is a more conservative approach to investment at the corporate level. Romania is one of the fastest growing economies in Europe; the IMF forecasts GDP growth of 4.2% in 2016 and 3.6% in 2017 vs 2.0% and 2.1% respectively for Europe as a whole. There is strong domestic consumer demand and wages are growing; core inflation is positive and rising. UEM’s investments in the country are primarily in electricity, gas and oil transmission; these are natural monopolies with clear regulation. Historically state-run and inefficient, there is potential for significant cost cutting at these companies. Balance sheets are solid and free cash flow generation strong, with a large percentage returned to shareholders as dividends. Although one-third of the increased exposure during FY16 was a result of share price performance, the manager still believes that valuations of Romanian companies remain attractive.
Mexico – the country has a population of 136 million, with GDP per capita of $10,765. The manager considers the economic background stable, with GDP and inflation running around 2.5%. He highlights airports as attractive investments, with passenger numbers rising by more than 8% pa in recent years. Flight penetration is low and demand is increasing, led in part by the rising middle classes. There is a change in mind-set as passengers increasingly switch from buses to airplanes for domestic travel; in 2006 buses had a 93% market share, which declined to 91% in 2015, with air transportation increasing.
The manager highlights the consistency of the investment strategy; he has no shortage of potential investment ideas; targeting 15% total return pa. He says that the biggest challenge over the last 12 months has been exchange rates such as the Brazilian real, which has been very volatile. From mid-June to late-September 2015 the real fell by more than 35% and between late-January to the end of June 2016 it rallied by more than 20%. The portfolio is not hedged due to the expense involved and the manager sees diversification as the best way to address currency volatility, rather than trying to predict forex movements.
Asset allocation
Investment process: Disciplined emerging market investment
UEM is jointly managed by ICM Limited and ICM Investment Management. Portfolio manager Charles Jillings works in a dedicated team that has deep experience of investing in the emerging markets infrastructure and utilities sectors. The focus on these areas means that performance of the portfolio is somewhat protected in periods of economic weakness. The manager adopts a bottom-up stock selection process seeking to identify companies whose current share price does not fully capture the value of the underlying businesses. The team has built up a bespoke database covering c 900 potential investee companies by conducting in-depth fundamental and building in-house financial models. An important part of the investment process is to meet with the management teams of portfolio and potential investee companies.
The manager is a long-term investor who avoids short-term ‘noise’ in stock markets. He emphasises the consistency of the investment process, highlighting that more than 95% of the portfolio is invested in established businesses, with more than 75% invested in companies that pay a dividend. The fact that holdings in the portfolio are backed by real assets reduces investment risk. Risk is further mitigated through diversification by industry and geography. Favoured countries for portfolio investment are growing, politically stable, have an acceptable legal framework and are receptive to foreign investment. When valuing a business, the team focuses on EV/EBITDA, to address the difference in funding structures between companies.
Current portfolio positioning
The portfolio typically holds c 60-90 names. At the end of May 2016, the top 10 positions accounted for 44.3%; this was a decrease in concentration from 52.8% at the end of May 2015 (see Exhibit 1). Reflecting the long-term nature of investments, nine companies are common to both periods. The new name in the top 10 list is Transgaz, a Romanian gas transmission company in its third regulatory cycle with a regulated rate of return of 7.7% until September 2017. There is a long tail of investments in the portfolio as initial position sizes are often small, either for liquidity reasons or to allow the manager to build confidence in the management of investee companies.
Formerly the largest position in the portfolio, Malaysian IT services company MyEG is now the sixth largest holding, with the manager selling down as the shares are considered to be fully valued. The position in Malaysia Airport Holdings is now the largest single exposure. The manager expects good passenger growth at both its Malaysia-based airports and its now wholly owned investment in Sabiha Gökçen International Airport in Istanbul, Turkey.
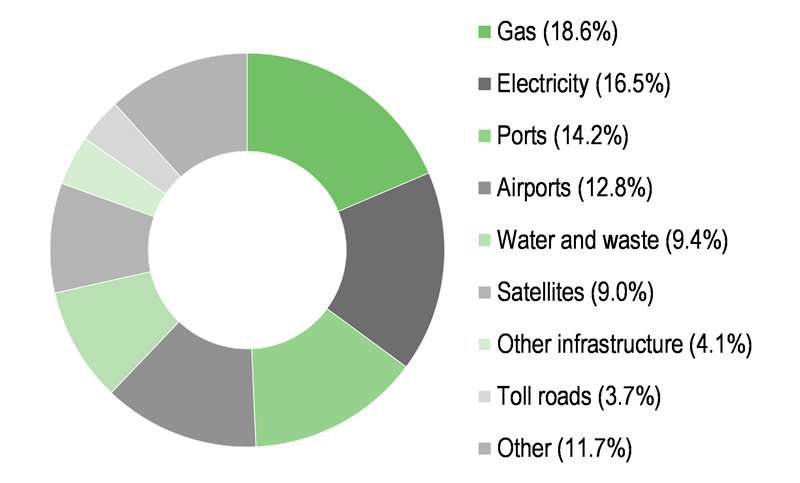
The fund typically invests/disinvests c £100m per annum. In FY16 £96.1m was invested and £130.5m realised as profits were taken on a number of Chinese H-share positions in the April 2015 market rally, although China remains the largest country exposure. Looking at sector exposure, over the last 12 months the largest increases have been in electricity (3.6pp), gas (2.8pp) and airports (2.3pp), while the largest decreases have been in satellites (3.3pp), other infrastructure (2.9pp) and toll roads (2.1pp).
|
Exhibit 3: Sector exposure at 31 May 2016 |
Exhibit 4: Geographic exposure at 31 May 2016 |
|
|
|
Source: Utilico Emerging Markets, Edison Investment Research |
|
Exhibit 3: Sector exposure at 31 May 2016 |
|
|
Source: Utilico Emerging Markets, Edison Investment Research |
|
Exhibit 4: Geographic exposure at 31 May 2016 |
|
|
Source: Utilico Emerging Markets, Edison Investment Research |
Performance: Long-term outperformance vs indices
As shown in Exhibit 5, over five years, UEM’s NAV and share price have appreciated by more than 6% pa. Over 10 years, the NAV has risen by 10.8% per year, modestly ahead of the 9.8% share price annualised return.
UEM has delivered strong performance compared with the MSCI Emerging Markets index; its NAV and share price total return have outperformed over one, three and five years and since the fund was launched in July 2005. Its NAV and share price have also outperformed the MSCI EM Infrastructure index over three and five years and since launch. Over 10 years, UEM has outperformed its performance fee benchmark in both NAV and share price terms.
|
Exhibit 5: Investment trust performance to 30 June 2016 |
||||||||
Price, NAV and index total return performance, one-year rebased |
Price, NAV and index total return performance (%) |
|||||||
|
|
|||||||
|
Source: Thomson Datastream, Edison Investment Research. Note: Three-, five- and 10-year performance figures annualised. |
||||||||
|
Exhibit 6: Share price and NAV total return performance, relative to indices (%) |
||||||||
|
One month |
Three months |
Six months |
One year |
Three years |
Five years |
10 Years |
|
Price relative to MSCI Emerging Markets |
(0.7) |
0.2 |
0.2 |
1.2 |
12.2 |
37.4 |
25.8 |
|
NAV relative to MSCI Emerging Markets |
(2.2) |
(2.4) |
(2.2) |
4.1 |
10.7 |
35.0 |
37.9 |
|
Price relative to MSCI EM Infrastructure |
(1.8) |
(0.6) |
(4.2) |
(4.4) |
9.2 |
18.4 |
7.3 |
|
NAV relative to MSCI EM Infrastructure |
(3.2) |
(3.2) |
(6.4) |
(1.5) |
7.7 |
16.4 |
17.6 |
|
Price relative to FTSE All-Share |
9.4 |
3.7 |
12.9 |
2.8 |
3.5 |
2.2 |
50.8 |
|
NAV relative to FTSE All-Share |
7.8 |
1.0 |
10.3 |
5.8 |
2.1 |
0.4 |
65.3 |
|
Price relative to performance fee benchmark |
11.8 |
6.5 |
13.3 |
(2.7) |
(1.6) |
(3.1) |
18.5 |
|
NAV relative to performance fee benchmark |
10.1 |
3.8 |
10.6 |
0.1 |
(3.0) |
(4.8) |
29.9 |
|
|
Source: Thomson Datastream, Edison Investment Research. Note: Data to end-June 2016. Geometric calculation. Benchmark for performance fee is UK Gilt five- to 10-year post-tax yield, plus RPIX, plus 2%, subject to an 8% minimum from 1 April 2014. |
||||||||
|
Exhibit 7: NAV performance relative to MSCI EM index over five years |
||||||||
|
||||||||
|
Source: Thomson Datastream, Edison Investment Research |
||||||||
Capital structure and fees
UEM has 211.5m ordinary shares in issue with the authority, renewed annually, to repurchase 14.99% and allot up to 10% of its issued share capital. At the end of FY16, bank debt had declined by 41.4% over the year to £18.7m. UEM has recently renegotiated its bank debt facility of £50m with Scotiabank Europe for another two years, expiring on 30 April 2018.
Following approval of a one-for-five bonus issue at a special general meeting in September 2015, UEM issued 42.6m subscription shares. They are exercisable on the last business day of August 2016, February and August 2017 and February 2018 at an exercise price of 183.0p. If the shares are exercised, UEM’s fixed costs will be spread over a wider base and liquidity in UEM shares is likely to increase.
The management fee paid to ICM is 0.65% of net assets. Subject to an 8% minimum hurdle, a 15% performance fee is payable on returns in excess of the FTSE UK Gilt five- to 10-year index post-tax yield, plus RPIX inflation, plus 2%. Performance fees are capped at 1.85% of average net assets in each financial year. For FY16, ongoing charges were 1.1%, which was in line with the previous year; no performance fee was payable.
Dividend policy and record
UEM pays dividends quarterly in September, December, March and June. Despite the focus on capital growth, the board aims for a flat or growing annual dividend; this has been achieved every year since fund inception in 2005. In FY16, the dividend of 6.4p was a 4.9% increase versus the prior year. Over the last five years, dividends have grown at a compound annual rate of 4.24%.
UEM is able to distribute from both income and capital when necessary, which allows a smooth progression of the dividend even though income levels may fluctuate significantly. For the 12 months to 31 March 2016, total income rose by 45.9% to £21.3m. This was a yield on gross assets of 4.8% versus 3.0% in the previous year. Most of the increase was as a result of the special dividend distributed by Asia Satellite Telecom in H116. Higher income, coupled with lower costs, led to a revenue return of £17.5m in FY16 versus £10.6m in FY15, meaning that dividend payments were more than fully covered.
Peer group comparison
Exhibit 9 shows a comparison of UEM with AIC Global Emerging Markets sector trusts that have market caps greater than £50m. Given its focus on specific areas of the market, UEM cannot be compared directly with the peer group; however, its emerging market exposure provides some relevance to the comparison. UEM has outperformed the peer group average over one, three, five and 10 years, ranking second over three and five years and first over 10 years. In terms of risk-adjusted returns as measured by the Sharpe ratio, UEM is in line with the peer group average over one year and higher over three years. Its discount is narrower than average and it has one of the lowest ongoing charges, although a performance fee is payable. UEM’s 3.3% dividend yield ranks it third out of the five peers that pay a dividend.
Exhibit 9: Selected peer group at 30 June 2016
% unless stated |
Market cap £m |
NAV TR 1 Year |
NAV TR 3 Year |
NAV TR 5 Year |
NAV TR 10 Year |
Sharpe 1y (NAV) |
Sharpe 3y (NAV) |
Discount (ex-par) |
Ongoing charge |
Perf. fee |
Net gearing |
Dividend yield (%) |
Utilico Emerging Markets |
406.0 |
7.9 |
20.8 |
35.8 |
172.1 |
(0.6) |
0.2 |
(8.2) |
1.1 |
Yes |
103 |
3.3 |
Aberdeen Emerging Markets |
232.0 |
5.9 |
8.5 |
(3.7) |
64.5 |
(0.8) |
(0.1) |
(14.3) |
1.1 |
Yes |
100 |
N/A |
Aberdeen Frontier Markets |
96.2 |
2.1 |
6.5 |
18.8 |
|
(0.7) |
(0.1) |
(8.2) |
1.6 |
Yes |
100 |
N/A |
BlackRock Frontiers |
191.4 |
12.3 |
27.9 |
59.4 |
|
(0.5) |
0.5 |
(2.8) |
1.5 |
Yes |
109 |
3.5 |
Fundsmith Emerging Equities |
209.0 |
7.1 |
|
|
|
(0.9) |
(1.1) |
(2.5) |
1.7 |
No |
100 |
N/A |
Genesis Emerging Markets Fund |
728.8 |
8.1 |
10.2 |
7.9 |
139.2 |
(0.6) |
(0.0) |
(12.6) |
1.6 |
No |
100 |
N/A |
JPMorgan Emerging Markets |
801.2 |
12.2 |
16.6 |
16.6 |
139.9 |
(0.3) |
0.1 |
(13.1) |
1.2 |
No |
97 |
0.9 |
JPMorgan Global Emerg Mkts Inc |
294.1 |
4.9 |
3.3 |
18.8 |
|
(0.6) |
(0.2) |
(7.5) |
1.2 |
No |
106 |
4.9 |
Templeton Emerging Mkts |
1,478.3 |
3.2 |
(0.4) |
(10.6) |
125.0 |
(0.7) |
(0.3) |
(13.6) |
1.2 |
No |
100 |
1.6 |
Average |
493.0 |
7.1 |
11.7 |
17.9 |
128.1 |
(0.6) |
(0.1) |
(9.2) |
1.4 |
102 |
2.9 |
Source: Morningstar, Edison Investment Research. Note: TR=total return. Sharpe ratio is a measure of risk-adjusted return. The ratios shown are calculated by Morningstar for the past 12- and 36-month periods by dividing a fund’s annualised excess returns over the risk-free rate by its annualised standard deviation. Net gearing is total assets less cash and equivalents as a percentage of net assets.
The board
There are currently six non-executive directors at UEM; five are independent of the manager. Chairman Alexander Zagoreos has been on the board since the trust’s inception in 2005; he has announced his intention to stand down at the September 2016 AGM and will be replaced by John Rennocks, the newest director, who was appointed in November 2015. The other board members (with date of appointment) are deputy chairman Garth Milne (November 2014 and previously a director of UEM from 2005 to 2010), Garry Madeiros (June 2007), Anthony Muh (October 2010) and Susan Hansen (September 2013), who is deemed not to be independent as she is a director of RESIMAC, which has the same majority shareholder as the investment manager.
|
Investment Companies