Jersey Electricity — Stable returns and improving cash flow

Jersey Electricity (LSE: JEL)

Last close As at 25/04/2024

GBP4.60

0.00 (0.00%)

Market capitalisation

GBP54m

More on this equity

Research: Industrials

Jersey Electricity — Stable returns and improving cash flow

Jersey Electricity (JEL) is delivering attractive and stable returns for its shareholders and secure, affordable, low-carbon electricity for its customers. We forecast a continuation of the favourable returns and an improving cash flow profile, which should underpin attractive dividend growth. At its current share price JEL is trading at a significant discount to both its sum-of-the-parts (SOTP) and peer group valuation multiples.

Analyst avatar placeholder

Written by

Industrials

Jersey Electricity

Stable returns and improving cash flow

Annual outlook

Utilities

3 March 2017

Price

435.00p

Market cap

£133m

Net debt* (£m) at 30 September 2016
*Company definition

29.0

Shares in issue
*”A” shares and ordinary shares

30.6m*

Free float

99.6%

Code

JEL

Primary exchange

LSE

Secondary exchange

N/A

Share price performance

%

1m

3m

12m

Abs

4.8

6.1

(7.5)

Rel (local)

1.4

(3.1)

(22.2)

52-week high/low

470.00p

407.50p

Business description

Jersey Electricity is the sole supplier of electricity to the island of Jersey. It also operates businesses in retail, property and business services on the island.

Next events

AGM

March 2017

Interim results

May 2017

Analysts

Graeme Moyse

+44 (0)20 3077 5700

Roger Johnston

+44 (0)20 3077 5722

Jersey Electricity is a research client of Edison Investment Research Limited

Jersey Electricity (JEL) is delivering attractive and stable returns for its shareholders and secure, affordable, low-carbon electricity for its customers. We forecast a continuation of the favourable returns and an improving cash flow profile, which should underpin attractive dividend growth. At its current share price JEL is trading at a significant discount to both its sum-of-the-parts (SOTP) and peer group valuation multiples.

Year
end

Revenue (£m)

PBT*
(£m)

EPS*
(p)

DPS
(p)

P/E
(x)

Yield
(%)

09/15

100.5

12.4

32.5

12.8

13.4

2.9

09/16

103.4

13.2

32.4

13.5

13.4

3.1

09/17e

104.5

13.4

34.3

14.2

12.7

3.3

09/18e

106.8

13.8

35.2

14.9

12.4

3.4

Note: *PBT and EPS are normalised, excluding amortisation of acquired intangibles, exceptional items and share-based payments. DPS shown is (net) Edison definition (interim and final). JEL defines DPS as the amount paid during the year.

Financial stability

FY16 results showed that JEL is earning a stable return, which remunerates it adequately for its investment (operating profits/regulatory asset base [RAB]). We believe the company will be able to sustain returns at a satisfactory level, but that after significant investment in the network in recent years, capex will fall to c £15m in FY17, with a consequent improvement in cash flow. The improved cash flow will reduce the already modest level of gearing and help underpin DPS growth. We forecast 5% pa growth in the DPS for FY17 and FY18, although JEL possesses the financial capability to exceed our forecasts.

Operational enhancements

Investment in interconnector capacity should allow JEL to deliver secure, affordable low-carbon electricity to its customer base. JEL’s share of interconnector capacity at 190MW stands comfortably above all-time peak demand (161MW) and the ability to import a mixture of low-carbon electricity should maintain CO2 emissions below the UK average. JEL has announced a tariff freeze until at least January 2018 and its prices remain competitive with other island jurisdictions and within its self-imposed target of +/-10% of the EU-15 average. While weaker sterling and sluggish demand growth pose longer-term threats to costs and revenues, the structure of the regulation, allowing for adequate returns and initiatives to promote electricity, should help offset some of these pressures.

Valuation: Upside potential from current levels

Our SOTP analysis indicates a valuation of 520p/share, while peer group analysis, using prospective multiples, produces a valuation of 605p/share. The average of the two approaches produces a value of 563p. The selected peer group currently trades at a 4.3% discount to consensus target prices. Placing JEL on a similar discount would produce a value of 538p/share.

Investment summary

Company description: Electricity supplier to Jersey

Jersey Electricity (JEL) is the sole supplier of electricity to the island of Jersey. The electricity business is responsible for generating around 80% of group revenues and operating profit. JEL also operates a range of other businesses including property rental, retailing and business services. The government of Jersey remains the largest shareholder at 62%, and over 80% of the voting rights.

Valuation: Undemanding rating

We use a SOTP and peer group multiples to provide indicative valuations. Our SOTP indicates a valuation of 520p/share. Peer group analysis, which does not reflect the value of advantageous tax treatment of the DPS that may be available to Channel Island-based shareholders, using prospective multiples, produces a valuation of 605p/share. The average of the two approaches produces a value of 563p. The selected peer group currently trades at a 4.3% discount to consensus target prices. Placing JEL on a similar discount would give a value of 538p/share.

Financials: Stable returns; improving cash flow and DPS

Returns: our forecasts assume that JEL is successful in achieving returns (operating profits/RAB) in line with its regulatory target of c 6-7% on a rolling five-year basis.

Balance sheet and capex: we expect capex to fall in FY17. In the absence of major interconnector-related investment, we forecast expenditure of £15m in 2017 (10-year average c £19m). We forecast that gearing will fall from 18% at the end of FY16, to 14% by FY18.

Dividends: we forecast increases of 5% in the DPS for FY17 and FY18.

Sensitivities: Security of supply

External supplies: in the event of disruption to supplies from France, JEL would be forced to rely on its more expensive on-island capacity. In 2013, when imports constituted 75% of supply energy business, operating profits totalled £3.2m vs £11.7m in 2015 when imports constituted c 92% of the total. The fall in profitability occurred because JEL decided not to raise tariffs (although it was entitled to do so) in the short term, but recover profits on a rolling basis.

Regulation: changes to the current self- regulatory model could constitute a risk to JEL’s profitability. Changes could take a variety of forms, but by way of illustration, with a regulatory asset base of c £175m, a 0.5% reduction in return would equate to a £0.9m reduction in the profitability of the energy business. However, we should stress, that we are unaware of any plans to modify the self-regulatory system.

FX: sterling weakness versus the euro would, if sustained, increase electricity purchase costs for JEL although, under the terms of its regulatory regime, JEL would be able to pass on the additional costs to customers via the tariff setting process.

Demand growth: if demand were to increase by 1% pa each year to 2030, rather than remain flat, this could be worth an extra £5m (c 16p/share) over the period in terms of NPV of revenue. Of course, as JEL targets a return on its assets, it could use the extra revenue from increased demand to reduce tariffs for customers.

Minority shareholding: the States of Jersey retains 86% of the voting rights. All other shareholders therefore bear the risk associated with a minority position.

Company description: Integrated across the electricity value chain

The electricity business remains the largest contributor to group profits. The business is self-regulated and integrated across the electricity supply value chain (generation, transmission, distribution and supply). JEL imports more than 90% of the electricity that it supplies from France, but operates two on-island power plants, Queens Road and La Collette, during “stress periods” and for training, network management and arbitrage purposes. The company also manages the island distribution network of c 1,500km (>90% underground). In 2016 JEL sold 625m kWh of electricity and at the end of 2016 it had 49,532 supply customers. It operates a number of other businesses, as shown below, the most significant of which are the property and retailing operations.

Exhibit 1: Jersey Electricity operating profit by division (£000s)

2007

2008

2009

2010

2011

2012

2013

2014

2015

2016

Energy

4,493

6,277

6,679

7,742

7,678

4,240

3,229

7,952

11,514

11,650

Building Services (JEBS)

305

274

176

240

220

300

104

(44)

(58)

134

Retail (Powerhouse)

479

450

292

465

476

64

188

(86)

334

452

Property

954

953

1,263

1,858

1,652

1,609

1,609

1,415

1,562

1,683

Other (Incl. Jendev & Jersey Energy Services)

437

540

404

1,539

840

708

623

659

592

695

Total

6,668

8,494

8,814

11,844

10,866

6,921

5,753

9,896

13,944

14,614

Source: Jersey Electricity, Edison Investment Research. Note: Operating profit is shown before exceptional items and profit from property revaluations

Supplying secure, affordable, low-carbon electricity

JEL’s overarching strategy is to provide secure, affordable, low-carbon electricity to its customers, while providing them with high levels of service and earning a reasonable return on its assets. In tandem, JEL seeks to grow unit sales to offset pressure from energy efficiency (mainly by switching customers from fossil fuel to electric heating systems), develop service and solutions capabilities and invest in smart infrastructure with a view to deepening its relationship with the customer. JEL has enjoyed significant success in meeting its key objectives. In FY16, the carbon intensity of the electricity distributed by JEL was significantly lower than the average UK level (around one-ninth), while security of supply remained high and prices remained stable. This success was achieved against a backdrop of significant investment in interconnectors to further improve the resilience of supply while sustaining returns at a level necessary to sufficiently remunerate that investment.

Management and shareholding structure

There were no significant changes to the executive team during the year. Chris Ambler remains CEO (since 2008) and Martin Magee continues as CFO (since 2002). Geoffrey Grime also remains chairman, but Wendy Dorman and Philip Austin were appointed as non-executive directors. Similarly, there were no changes to JEL’s shareholding structure, which comprises four classes of shares: 11.64m ordinary “A” shares, 19m ordinary shares and two tranches of preference shares. Each class of shares carries different voting rights, but by virtue of its holding of the entire class of ordinary shares, the States of Jersey retains 86% of the voting rights.


Financial and operational stability to facilitate DPS growth

JEL is delivering secure, affordable, low-carbon electricity to its customers while making significant investment in improving the resilience of supplies and generating stable profits at a level sufficient to earn an adequate return for its shareholders. JEL has committed to a tariff freeze until January 2018 and we envisage an accompanying period of stable profitability, but lower investment, leading to falling gearing. Accordingly, we believe that JEL is well placed to continue with its policy of sustainable dividend increases and could move to a more aggressive payout if it so chooses.

FY16: Operational highlights and financial results

JEL’s FY16 results exceeded our forecasts and demonstrated further year-on-year growth. The performance was achieved against a backdrop of heavy investment (the majority in the N1 interconnector with France, which went live in December 2016, ahead of schedule and below budget) and at a time when prices to customers were maintained and service levels remained high. Tariffs have not increased since April 2014 and JEL recently committed to maintain prices at existing levels until 1 January 2018. Prices compare favourably with other island jurisdictions and meet JEL’s self-imposed target of keeping prices within +/- 10% of EU-15 averages (currently JEL’s tariffs are at a small premium). During the year JEL increased the number of smart meters on the island to over 25,000 and launched a new tariff (E20+). Meanwhile, security of supply remained high (24 minutes lost) and the carbon intensity of the business, at 47g CO2e/kWh, is significantly below the fossil fuel heating alternatives on the island and also below the average of the UK electricity market as a whole (412g CO2e/kWh). JEL’s offering helped to ensure that electricity is the fuel of choice for new developments on the island (98%) and helped facilitate a doubling in the rate of fuel switch conversions.

At the level of group operating profits before exceptional items, JEL exceeded our forecasts with a profit of £14.3m (Edison FY16e £14.0m). Due to a better than expected performance at the net interest line (£1.13m vs Edison estimate of £1.94m), in part due to the capitalisation of interest (£0.37m, not included in our forecasts) and the benefit of an exceptional credit of £1.68m (a release of a rent accrual on JEL’s La Collette Power Station), PBT of £14.8m (normalised £13.2m) was significantly above our forecast of £12.1m. Higher profitability than anticipated and lower than forecast capex (£32.4m vs £35m) helped limit the rise in net debt, to a year-end figure of £29m (excluding preference shares) versus our expectation of c £37m. Despite the rise in net debt during the year gearing remains modest by utility standards. We expect a smaller capex programme in the next couple of years (c £15m) with an outlook for positive cash flow and falling gearing. As a result, JEL is therefore well placed to augment its dividend payments to shareholders, should it so choose.

On a divisional basis, the energy business achieved a small rise (£0.1m) in profitability (net profit of £11.65m in FY16 vs £11.51m in FY15) despite lower volume sales (625kWh in FY16 vs 627kWh in FY15) and static pricing, helped by some non-recurring work carried out for the States of Jersey. However, of the £0.7m improvement in operating profits before exceptional items, the non-energy businesses contributed to the majority of the increase (+£0.6m). Property profits rose from £1.56m in FY15 to £1.68m in FY16 (+£0.1m excluding the revaluation of properties) with lower costs and higher rental income post a rent review. Following its restructuring, the retailing business, Powerhouse, increased profits to £0.3m from a loss of £0.1m in FY15 (+£0.4m). JEBS, the contracting business, also turned in a profit of £0.1m versus a loss of a similar magnitude in FY15.

Exhibit 2: JEL key reported financial and operating statistics 2012-16

£000s

2012

2013

2014

2015

2016

Revenue

97,182

102,338

98,443

100,479

103,361

Operating Profit

5,459

5,308

6,493

14,688

15,940

EPS

16.4

15.3

27.7

32.5

32.2

DPS

11.0

11.6

12.2

12.8

13.5

Net debt/(cash)

(14,096)

5,437

20,459

17,732

29,253

Unit sales (GWh)

637

663

621

626.8

625

Source: Jersey Electricity

Networks, generation and capex

Underpinning JEL’s financial success and the delivery of its operational goals is the effective management of its network and generation assets. At the core of JEL’s strategy of providing affordable and secure supplies of electricity is the maintenance and expansion of the interconnector capacity with France. The 32km Normandie 3 (N3) interconnector (100MW), began importing power in September 2014, and in February 2015 JEL supported Guernsey Electricity in a pre-emptive repair to the Jersey-Guernsey link (GJI). In 2015, JEL signed a contract for a third power cable link (100MW) with France, known as Normandie 1 (N1) and this project has now been delivered ahead of schedule and below budget (December 2016). The completion of N1 brings JEL’s share of total importation capacity to 190MW, compared to all-time peak demand of 161MW recorded in 2012. With network constraints on the French side being reduced by reinforcement work (carried out by RTE), import capacity should further increase to over 200MW by the end of 2018.

Notwithstanding the improved resilience of the interconnectors, if EdF were to cease to export electricity due to domestic shortages, JEL would be forced to rely on domestic generation. The perception of the likelihood of such a scenario increased last October as France was forced to import electricity from Germany following the shutdown of several reactors due to safety concerns. Following the reactor shutdown, futures prices for French baseload power spiked significantly during the month (October 2016), reaching €50/MWh for FY17contract (indicative of a short-term problem).The movement in prices since October last year (FY18 now €36/MWh – FY17 contract expired) suggests fears of plant closures have receded. JEL has stated that it has “received a high degree of comfort from EdF that the supplies to the Channel Islands will not be impacted by what is viewed as a short-term issue”.

In FY16 it should be stressed there was no shortfall of available French electricity and as a result of its strategy JEL was able to import 92% of its required electricity, only slightly lower than the 94% figure achieved in FY15. The remainder of the electricity was sourced from the States of Jersey-owned EfW plant (5%) and JEL’s La Collette Power Station (c 3%). The figure for La Collette was slightly higher than usual due to increased output for training purposes, which also slightly increased the CO2 intensity of the electricity supplied. We expect this strategy of improving, expanding and diversifying its interconnector resilience and capacity to enable Jersey to import c 95% of its electricity in the future, with a continuing low-carbon mix (nuclear 65%, renewables 35%). Despite the importance of the links with France, JEL also continues to invest in local generation capacity and last year acquired a 5.5MW Sulzer engine with “black start” capability using compressed air. It is expected that the so-called Diesel 5 will enter operation early in 2017.

JEL’s on-island network (transmission (90kV) and distribution network (>33kV) of c 1,600km (90% underground)) is well maintained, enjoys high levels of availability and makes a significant contribution to the low levels of customer minutes lost (24 minutes in FY16, c 10x better than the UK average). JEL continues to invest in strengthening the resilience of the distribution network and in FY16 installed 28km of new cable and 10 new substations. However, JEL’s principal investment is a new primary substation at St Helier West (£17m), which is scheduled for completion by winter 2018.

Peak demand and volume growth

JEL has demonstrated significant success in restraining peak demand over the medium term. For the period 2000-16 the rate of growth in peak demand was 0.4% (CAGR). All-time peak demand of 161GW, which was recorded in 2012, has yet to be surpassed. Over the same timeframe (2000-16) overall volume growth for JEL registered 0.7% (CAGR). However, a trend of slowing growth is discernible and for the period 2010-16 JEL suffered from a decline in volumes sold of CAGR -0.5%, although volumes were broadly flat year-on-year 2016 versus 2015. However, data also show that customer numbers have continued to grow, indicating a trend of declining per capita consumption. Using figures produced by JEL, we calculate that the average customer in 2007 used 13,116kWh, while by 2015 demand had fallen to 12,709kWh, a CAGR of -0.4%. Part of JEL’s response to growing energy efficiency is to persuade customers to switch from alternative forms of energy to electricity. We examine the topic of fuel switching in more detail later in this report.

To provide some indication of the impact of demand fluctuations (assuming no tariff adjustments), we have run a demand model out to 2030. Assuming static pricing, constant margins and tax rates, and no additional capex, if demand were to increase by 1% pa each year for the period 2016-30, rather than remain flat, we calculate this could be worth an extra £5m in revenue over the period in NPV terms, equivalent to c 16p/ share. A reduction in demand of 1% pa would reduce the value of the business by 15p/share. Given the structure of the regulation (allowing for a specified rate of return), it would be possible to increase or reduce its tariffs to maintain returns at an appropriate level.

Growing electricity’s share of the energy market

JEL promotes energy efficiency, both in terms of customer end-use and also utilisation of the network. Customers are encouraged to use efficient off-peak heating, ensuring not only that electricity is used when imports are cheapest, but also that peak demand is flattened, thereby reducing infrastructure costs and, as a consequence, tariffs. In recent years JEL has also developed a SmartSwitch programme to install smart meters on the Island. In February 2015 JEL appointed a programme manager to oversee the SmartSwitch programme and during 2015 began to install a single-element meter on a pilot basis. In FY16 JEL moved to a full-scale roll-out of the smart meter, and by the year-end 25,296 meters had been installed. The project, which is estimated to cost £11m, is expected to conclude by the end of 2018, providing JEL with the opportunity to develop new products and services.

JEL strives to tackle the resultant pressure on unit sales from the growth in energy efficiency by promoting electricity as the fuel of choice for new builds, where it has achieved a 98% success rate, and by seeking fuel switching from fossil fuels from existing customers (especially for on-island heating and cooking).To assist with the implementation of its strategy JEL has formed an energy solutions team dedicated to encouraging new unit sales growth using new technologies in heating, cooling, cooking and transportation applications, across the commercial, residential and public sectors. The energy solutions team has implemented marketing campaigns, devised new tariffs (including the Economy 20 Plus (E20+) launched in 2016, which provides uninterrupted low-price heating tariffs) and developed financial packages to assist with customer conversion. JEL claims that this strategy has led to an almost 100% increase in the fuel switch conversion rate and in the last financial year 360 new customers signed up to discounted space and water heating tariffs, taking the total number of customers on such tariffs to around 16,000.

Rate of return regulation and price comparability

There has been no change to JEL’s regulatory framework during the last year and we are unaware of any proposals to change the regulatory regime. JEL continues to operate as a self-regulated business, aiming to earn a return of 6-7% (pre-tax) on its energy assets (net of customer contributions) on a rolling five-year basis (we calculate 5.9% 2012-16 due to low returns in 2012 and 2013). In addition to its rate of return target, JEL also aims to ensure that tariffs remain within ±10% of the EU-15 average (inclusive of all taxes). JEL’s policy of tariff restraint, with no tariff increases since April 2014, has been successful in ensuring that prices remain significantly below peer group comparisons (island jurisdictions) and only at a small premium to the average EU-15 standard domestic tariff.

Exhibit 3: JEL energy business – evolution of operating profit and return on assets

Source: Edison Investment Research, Jersey Electricity

Importing electricity from France, rather than producing using own generation, has contributed to stability of pricing and low CO2 emissions. However, JEL’s strategy means that the purchase of electricity is its biggest single cost. By the time JEL announces tariffs for the following year, however, it will have contracted for over 90% of its electricity needs reducing any potential mismatch between purchase costs and selling price. As JEL imports c 95% of its electricity from France (cost denominated in euros) it has adopted a policy of currency hedging for the majority of electricity purchase costs on a one- to two-year view. The benefit of this strategy was highlighted recently when JEL announced (November 2016) that it was freezing tariffs until at least January 2018, despite the fall in the value of sterling against the euro post the Brexit vote. As a result of the tariff freeze, JEL’s customers will enjoy stable electricity prices for a period of almost four years since the last tariff increase (1.5% average in April 2014). Importantly, the tariff freeze also enables JEL to comply with its self-imposed regulatory target of keeping its standard domestic tariffs within 10% of the EU average. However, the recent weakness of sterling could, if continued, have implications for tariffs in the longer term.

Foreign exchange and tariffs

Although JEL hedges its currency exposure on a one- to three-year view, permanently weaker sterling versus the euro would increase electricity purchase costs. By way of example, JEL’s standard domestic tariff is currently 14.5p/kWh. Assuming, in broad terms, that electricity purchase costs constitute c 60% (c 8.7p) of the total cost of the tariff, a 20% devaluation in £ versus the euro (1.38 to 1.10) would increase the electricity purchase element to c 10.5p and take the overall tariff, all other things being equal, from 14.5p/kWh to 16.3p/kWh, an increase of 12% (60% multiplied by 20%). Under the regulatory regime, JEL is of course able to pass on these additional costs to the customer, although raising prices tends to invite closer political scrutiny. Weaker sterling could also increase the cost of some of JEL’s capital projects and force up the cost of on-island generation (more expensive oil in £ terms). However, in a positive development, more expensive oil would also increase the cost of oil-based heating systems presenting JEL’s electricity-based systems with a competitive advantage.

Although weaker sterling would exert upward pressure on prices, weak sterling would help international comparisons (based in €). A tariff of 14.5p/kWh, at a €/£ exchange rate of 1.38, would translate to c €0.20/kWh, but only €0.16/kWh at an exchange rate of €/£1.10. Even taking into account the inflationary impact of sterling devaluation on electricity purchase costs (raising the tariff from 14.5p/kWh to 16.3p/kWh as shown above), there would be a decline in tariffs in euro terms (16.3p/kWh multiplied by 1.1) to €0.179/kWh from €0.20/kWh. Therefore, although weaker sterling might force price increases, the weakness would assist international comparison.

Low-carbon energy and renewables

As we have noted, the provision of low-carbon energy to its customer base forms an important part of JEL’s strategy. Thanks to its import contracts with EdF (65% nuclear, 35% renewables), JEL has largely decarbonised its energy supply system (and by implication, that of the island to a significant extent). In 2016 JEL achieved a carbon intensity of 47g CO2e/kWh, up slightly on the FY15 figure but considerably cleaner than the UK electricity system as a whole (412g CO2e/kWh) and below JEL’s four-year average of 105g CO2e/kWh.

Given the low-carbon intensity of the system, one of the prime motivations for investing in renewables, to reduce carbon emissions, is therefore less powerful in Jersey. As a result, despite the falling generation costs of most renewable technology and the abundance of renewable energy resources, in the absence of financial incentives, investment in renewable energy projects has been limited.

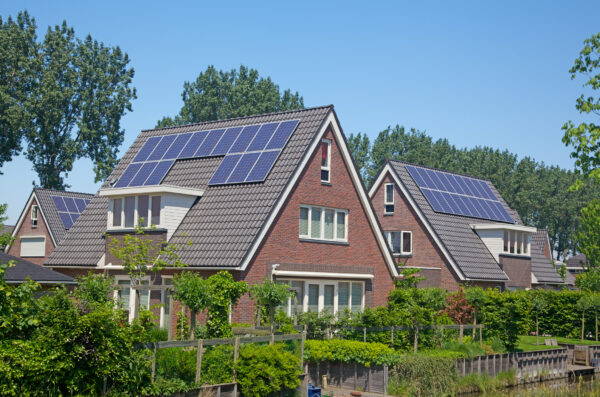
JEL expects that, over time, and with the right cost structure, opportunities to develop the indigenous supplies of solar, wind and tidal energy could emerge and provide income for the States of Jersey. To this end, JEL has continued to explore the potential of offshore wind (with JEL acting as a facilitator rather than a developer) and has provided briefings to key States members and civil servants: it has also presented a proposal for how it might work with the States of Jersey to develop this opportunity. JEL is waiting for a response to its proposal from government. The company is also developing a strategy for investing in solar based on its experience of installing and operating a commercial solar PV array on its Powerhouse building. We examine the implications for demand from residential adoption of rooftop solar in the Demand drivers section below.

Demand drivers

In this section we attempt to provide a guide to the potential magnitude of the impact on revenue of three key trends: energy switching, micro generation and vehicle fleet electrification. As the basis of our analysis we have constructed projections out to 2030 and discounted revenue back at a rate of 8% in an attempt to provide a broad quantification. On the basis of our analysis, by far the biggest impact on future profits would be on-island fuel switching. However, it is important to be aware that the analysis assumes no adjustments to tariffs, which under its “user pays” system of regulation JEL would be free to make in order to maintain its rate of return.

Exhibit 4: Scenarios for the evolution of revenue


Market penetration
2015 (%)

Market penetration by
2030 (%)

NPV of revenue
(£m)

NPV of revenue
p/share

Electric heating

53.0

65.0

12.9

42

Vehicle electrification

0.2

0.8

1.3

4

Micro Generation

0.1

2.9

(4.1)

(13.5)

Source: Edison Investment Research

Switch from gas to electricity

According to 2011 census data, there were c 41,595 occupied private households on the island of Jersey. Of these households c 20,000 are believed to use hydrocarbons for space and water heating (market penetration c 46%). While over 95% of new dwellings use electricity for heating, there are significant revenue gains for JEL, and wider environmental benefits via a reduction in greenhouse gas emissions (GHG) (JEL average C02 intensity 47g CO2e/kWh versus liquid petroleum gas (LPG) 241g CO2e/kWh and heating oil 298g CO2e/kWh) to be made from switching customers that currently use non-electric heating systems. JEL is seeking to exploit this opportunity and its energy solutions team has developed a range of tariffs and incentives such as five years’ interest-free credit and an uninterrupted low-price heating tariff (E20+), to those willing to switch supplies. In FY16 JEL doubled the fuel switching rate, converting c 360 customers to electric heating.

Conservatively, if we assume that only c 8,000kWh pa is used by domestic customers for space and water heating (Ofgem has estimated that a typical domestic energy customer uses c 16,500kWh pa for heating), then the additional load available to JEL could be significant. If JEL were able to convert c 250 customers a year to electric heating (with c 5% of the 250 installing a PV system and thereby slightly reducing the overall load benefit to JEL), we calculate that the net present value of the additional revenue over the period could be worth £12.9m, equivalent to 42p/share. Conversion of c 350 customers a year, in line with FY16 experience, would generate an NPV of revenue worth 59p/share. Fuel switching therefore clearly constitutes a significant potential opportunity for JEL.

Electrification of transport

Given that one of the principal barriers to the adoption of electrification of vehicles is “range anxiety” (currently most electric cars have a range of c 130m), the limited geographic dimensions (9 miles x 5 miles) of Jersey should provide an ideal location for electric transport. However, as at the end of September 2016, JEL estimated that there were only around 215 registered all-electric vehicles on the island (131 cars) and 424 hybrids.

JEL believes that the electrification of transport, which accounts for around one-third of total island carbon emissions, is the next big step in reducing Jersey’s CO2 emissions and is active in the promotion and facilitation (through its Evolve car club and the installation of public charging infrastructure in St Helier’s multistory car parks) of vehicle fleet electrification. JEL is also working with Jersey Post to electrify part of its (110 vehicle) fleet of delivery vans by installing dedicated electric supply and metering equipment at Jersey Post’s head office. Although the cost differential between electric and traditional vehicles has narrowed, JEL continues to believe incentives are required and has made representations to the States of Jersey, unsuccessfully so far, on this issue. In this context it is worth noting that many countries currently support the acquisition of electric vehicles (eg in the UK the maximum subsidy is currently £4,500), but some of these countries are proposing to end incentive programmes over the next five years (UK, China, Germany).

In an attempt to assess the potential impact of electric vehicle (EV) adoption, we assume the average privately owned vehicle covers c 3,400 miles per year, commercial vehicles clock c 13,200 miles pa and that the average electric vehicle uses 0.3 kWh/mile. We further assume that 0.8% of vehicles will be electrified by 2030 (overall vehicle fleet grows at 1.5% pa and EVs constitute, on average, c 3.7% of new registrations over the period – current UK figure >2%), leading to c 1,300 EVs on Jersey by 2020 versus the target of 5,579 ultra-low emissions vehicles in the Sustainable Transport Plan. Based on this scenario, the NPV of future revenue (assuming tariffs of14.5p/kWh) could amount to c £1.3m, equivalent to 4p/share. However, JEL recommends Economy 7 tariffs (night rate 7.63p/kWh for seven hours of discounted non-peak energy) to its EV users charging at home. Conducting the same analysis using Economy 7 tariffs reduces the potential revenue impact to 2p/share. Our analysis suggests that, unless EV adoption is markedly more aggressive than we have assumed, which we consider unlikely in the absence of incentives, the impact of EVs is likely to be small. The analysis does however ignore the potential additional benefit of membership fees for the Evolve car club, and does not include any additional capex required by JEL to reinforce the network or provide additional charging points.

Rooftop solar PV

While JEL is considering its position with regard to solar, it currently offers support for a range of renewable heating technologies, including a Buy Back Tariff. Given the successful adoption of solar PV in many countries (including the UK), and the attendant reduction in costs of this technology, we consider the potential implications for JEL of PV installation on the island in this section.

Since the launch of feed-in-tariffs (FiTs) in the UK (2010), installations of rooftop solar PV systems have grown rapidly. Installed capacity of systems below 4kW has increased at a CAGR of over 100% in the period 2010-15 as a whole. This period includes rapid growth in the early years subsequent to which subsidies were made less generous, but in the subsequent period installations have still been growing at 25-30% annually. The average size of a below 4kW system is c 2.9kW, with a load factor of c 10%, generating c 2,540kWh annually.

In Jersey, due to lack of incentivisation, there are only a small number of domestic PV installations (currently <50 and growing at c 10 systems pa), although we understand that the average size of a system is significantly larger than the rest of the UK, at 7.8kWp. Pathway 2050: An Energy Plan for Jersey (States of Jersey 2014) envisages that 9,527 properties could have installed micro renewables by 2050. However, for the purposes of our analysis, we assume a growth rate such that market penetration of solar PV reaches 2.9% by 2030 (equivalent to c 1,430 installations). In addition, assuming a 5.0kWp system operating at a load factor of 12% and consuming all electricity on site, we calculate the discounted value of revenue lost to JEL to be worth c 13.5p/share. This analysis, however, does not take into account the potential to levy a standby charge on PV installations. JEL charges commercial users 325p per kWp per month for installations up to 50kWp and is currently reviewing its charging policy for domestic customers. Even in the absence of a standby charge, we consider the potential medium term impact on JEL to be small.

Management and shareholding structure

There has been no change to the executive team at JEL over the last 12 months. Chris Ambler (appointed 2008) remains in post as CEO and Martin Magee continues as CFO (appointed 2002). Geoffrey Grime (appointed in 2008) also remains non-executive chairman. However, two new NEDs, Philip Austin and Wendy Dorman, joined the board during the year. Wendy Dorman is a qualified accountant and a tax specialist and until 2015 she led the Channel Islands tax practice of PwC. Philip Austin is a career banker, much of it spent with HSBC. Mr Austin subsequently joined Equity Trust as CEO of its Channel Islands business, a position which he held until 2009.

The shareholding structure remains unchanged, with the 11.6m “A” shares listed on the LSE (one vote per 100 shares) and a further 19m shares held by the States of Jersey (five votes per 100 shares). In addition, the 0.1m cumulative participating preference shares carry 20 votes per 100 shares, while the 3.5% (0.135m) cumulative non-participating preference shares carry 10 votes for every 100 shares held. In total, the States of Jersey continue to control 86% of the voting rights of JEL.

Sensitivities

Regulation: we are unaware of any proposed changes to JEL’s regulatory system. JEL remains well placed in terms of achieved return and comparative pricing with other island and EU peers. However, unexpected changes to the regulatory regime would constitute a risk to JEL’s profitability. With a regulatory asset base of c £175m, a 0.5% reduction in “allowed return” would equate to a £0.8m reduction in the profitability of the energy business

External supplies: in the event of interconnector failure with France or some other disruption to supplies, JEL would be forced to rely on its more expensive on-island, oil-fired capacity. The exact cost of indigenous generation will be determined by the level of oil prices, but in all except the most extreme circumstances domestically generated power would be more expensive than imports. By way of illustration, in 2013 when imports fell to 75% of the total, energy business operating profits totalled £3.2m, vs £11.7m in 2015 when imports constituted c 92% of the total electricity supplied.

FX: sterling weakness versus the euro would, if sustained beyond the timeframe of JEL’s hedging programme, increase electricity purchase costs for JEL. Under the terms of its regulatory regime JEL would be able to pass on the additional costs to customers via the tariff setting process. Although the weakness of sterling would render JEL’s tariffs more attractive in terms of international comparison, higher tariffs could attract attention from politicians.

Minority: the States of Jersey continues to own the majority of the shares and retains the majority of voting rights. Other shareholders bear the risk associated with the position of a minority shareholder.

Demand growth: electricity supply volumes have been falling in recent years (CAGR -0.5% 2010-16) as energy efficiency has curbed demand growth. To provide some indication of the impact of lower volumes, we have run a demand model out to 2020. Our model assumes static pricing, constant margins and tax rates, and no additional capex. We calculate that if demand were to increase by 1% pa each year to 2030 rather than remain flat, this could be worth an extra £5m PAT in NPV terms, equivalent to c 16p/share. A reduction in demand of 1% pa would reduce the NPV of the discounted PAT by 15p/share. Once again, it is worth stressing that given the structure of the regulation (allowing a specified rate of return) JEL would be able to increase its tariffs to ensure it is adequately remunerated for its investment.

Valuation

We continue to use a SOTP and comparative valuation metrics to provide indicative valuations. Our SOTP analysis, which does not reflect any liquidly/minority shareholder discount, indicates a valuation of 520p. Peer group analysis, using prospective multiples, which do not reflect the value of advantageous tax treatment of the DPS that may be available to Channel Island-based shareholders, produces a valuation of 605p. The average of the two approaches gives a value of 563p. The selected peer group currently trades at a 4.3% discount to consensus target prices. Placing JEL on a similar discount to the average valuation of 563p would imply a value of 538p/share.

Sum-of-the-parts

We value the electricity business with reference to its asset base and assume JEL’s cost of capital is equal to its return on its regulatory asset base. As previously, we include the property business at balance sheet value. The other businesses have been valued on a P/E basis, applying industry-specific or market multiples to determine a valuation. The result of this approach produces a SOTP valuation of 520p. If we were to value the electricity business on the basis that it was able to earn, on a permanent basis, 1% above its cost of capital, this would add c 50p/share to the valuation.

Exhibit 5: JEL SOTP

SOTP

£m

p/share

Comments

Total electricity valuation

176

574

Electricity business reg asset base

Total unregulated valuation

34

110

Property at b/s value other business on EPS multiples

Total asset value

210

684


Net (debt)/cash and investments

(27)

(89)


Other adjustments

(23)

(75)

Def tax liabilities, derivatives, preference shares

Total equity value

159

520


Source: Edison Investment Research

Comparable company valuation analysis

To conduct our comparable valuation analysis we have selected a group of European regulated utilities. Our analysis shows that this peer group trades on average P/E multiples of 17.1x (FY1e) and 16.4x (FY2e). The average EV/EBITDA multiples for the peer group are 12.1x (FY1e) and 11.8x (FY2e), while dividend yields are 4.8% (FY1e) and 4.9% (FY2e). Placing JEL on these multiples produces an average valuation of 605p. The comparable yield analysis takes no account of the additional DPS paying potential of JEL if it were to adopt a dividend cover more typically associated with regulated utilities. The yield analysis also takes no account of the additional yield that may be available to Jersey-domiciled shareholders arising from advantageous tax treatment.

Exhibit 6: Comparative valuations

Currency

Price

P/E (x)

EV/EBITDA (x)

Yield (%)

FY1

FY2

FY1

FY2

FY1

FY2

National Grid

P

974

15.5

15.0

11.5

11.8

4.6

4.7

Pennon

p

866

20.6

19.5

13.5

12.9

4.2

4.1

Severn Trent

p

2320

22.0

21.3

12.2

11.8

3.5

3.6

United Utilities

p

971

21.4

20.9

14.0

13.4

4.0

4.1

Terna

4.42

14.7

13.4

11.4

11.0

4.8

4.8

Snam Rete Gas

3.84

16.4

14.6

14.2

13.9

5.5

5.7

Enagas

23.2

12.5

12.9

10.0

10.2

6.3

6.6

Red Electrica

17.2

13.9

13.2

9.9

9.6

5.3

5.7

Average UK and European regulated utilities


17.1

16.4

12.1

11.8

4.8

4.9

Implied Value of Jersey Electricity

587

576

924

940

298

303

Source: Edison Investment Research, Bloomberg. Note: Prices as at 01 March 2017.

Financials

Returns: we base our forecasts on the assumption that JEL is successful in achieving returns in line with its target of c 6-7% (operating profits/regulatory assets on a rolling five-year basis).

Balance sheet and capex: despite ongoing capex relating to the SmartSwitch programme and the St Helier West substation, we expect capex to fall in FY17, following the completion of the N1 interconnector. We forecast expenditure of £15m in 2017 (10-year average c £19m) in the absence of major interconnector-related expenditure. We expect gearing to fall from 18% at the end of FY16, to 14% by FY18.

Tax: we assume a constant tax rate of 21% for FY17 and FY18.

Dividends: JEL’s dividend policy is for sustainable real growth in the medium term. In FY16 JEL increased the DPS by 5%. Cover remains high at c 2.5x (company definition). We forecast DPS increases of 5% for FY17 and FY18, although falling gearing allows JEL greater flexibility with regard to this issue. It is worth noting that last year dividends from JEL contributed £2.5m to the States of Jersey. JEL’s overall contribution to the States of Jersey, including goods and services tax, corporation tax and social security, totalled £7.9m (FY15 £7.3m).

All in all, we have slightly revised our 2017 estimates for JEL, resulting in 2.2% and 2.9% reduction in our EBITDA and EPS estimates respectively, as well as introduced our 2018 forecasts.

Exhibit 7: Changes to forecasts

EPS (p)

PBT (£m)

EBITDA (£m)

Old

New

% chg.

Old

New

% chg.

Old

New

% chg.

2017e

34.9

34.3

-1.7%

13.3

13.4

-

26.3

25.7

-2.2%

2018e

N/A

35.2

N/A

N/A

13.8

N/A

N/A

26.4

N/A

Source: Edison Investment research

Exhibit 7: Financial summary

2015

2016

2017e

2018e

Year end 30 September

IFRS

IFRS

IFRS

IFRS

PROFIT & LOSS


Revenue

100,479

103,361

104,504

106,840

Cost of Sales

(64,604)

(65,249)

(66,711)

(68,332)

Gross Profit

35,875

38,112

37,793

38,508

EBITDA

23,825

24,559

25,673

26,413

Operating Profit (before GW and except.)

13,914

14,333

14,788

15,274

Intangible Amortisation

(15)

(69)

(21)

(22)

Exceptionals

789

1,676

0

0

Other

0

0

0

0

Operating Profit

14,688

15,940

14,767

15,252

Net Interest

(1,519)

(1,132)

(1,364)

(1,486)

Profit Before Tax (norm)

12,395

13,201

13,424

13,788

Profit Before Tax (FRS 3)

13,169

14,808

13,403

13,767

Tax

(2,397)

(3,166)

(2,815)

(2,891)

Profit After Tax (norm)

9,998

10,035

10,609

10,898

Profit After Tax (FRS 3)

10,772

11,642

10,589

10,876

Average Number of Shares Outstanding (m)

30.6

30.6

30.6

30.6

EPS - normalised (p)

32.5

32.4

34.3

35.2

EPS - FRS 3 (p)

35.0

37.7

34.2

35.2

Dividend per share (p)

12.8

13.5

14.2

14.9

Gross Margin (%)

35.7

36.9

36.2

36.0

EBITDA Margin (%)

23.7

23.8

24.6

24.7

Operating Margin (before GW and except.) (%)

13.8

13.9

14.2

14.3

BALANCE SHEET

Fixed Assets

209,682

236,085

240,209

238,420

Intangible Assets

227

162

171

179

Tangible Assets

187,845

209,168

213,282

217,443

Investments

21,348

21,610

26,755

26,755

Current Assets

34,299

27,258

34,581

38,137

Stocks

6,239

5,962

6,077

6,224

Debtors

14,777

16,583

16,734

17,108

Cash

13,283

4,713

11,771

14,806

Current Liabilities

(21,893)

(17,447)

(16,813)

(17,212)

Creditors

(21,893)

(16,504)

(16,813)

(17,212)

Short term borrowings

0

(943)

0

0

Long Term Liabilities

(74,361)

(81,788)

(81,683)

(82,709)

Long term borrowings

(30,235)

(30,235)

(30,235)

(30,235)

Other long term liabilities

(44,126)

(51,553)

(51,448)

(52,474)

Net Assets

147,727

164,108

176,293

176,637

CASH FLOW

Operating Cash Flow

24,895

26,749

25,463

27,116

Net Interest

(1,512)

(1,126)

(1,364)

(1,486)

Tax

0

(396)

(2,815)

(2,891)

Capex

(16,836)

(32,395)

(15,030)

(15,330)

Acquisitions/disposals

3

19

0

0

Financing

0

0

0

0

Dividends

(3,859)

(4,067)

(4,211)

(4,374)

Net Cash Flow

2,691

(11,216)

2,044

3,035

Opening net debt/(cash)

20,459

17,732

29,253

27,209

HP finance leases initiated

0

0

0

0

Other

36

(305)

0

0

Closing net debt/(cash)

17,732

29,253

27,209

24,174

Source: Company accounts, Edison Investment Research

Contact details

Revenue by geography

The Powerhouse
PO Box 45
Queen’s Road
St. Helier
Jersey JE4 8NY
+44 1534 505460
www.jec.co.uk

Contact details

The Powerhouse
PO Box 45
Queen’s Road
St. Helier
Jersey JE4 8NY
+44 1534 505460
www.jec.co.uk

Revenue by geography

Management team

Chairman: Geoffrey Grime

Chief Executive: Chris Ambler

A qualified accountant, former senior partner of Coopers & Lybrand Channel Islands and a former deputy in the States of Jersey, Mr Grime joined the board of JEL in 2003 and has served as chairman since 2008.

Mr Ambler has served as chief executive since 2008, having previously held senior positions in the utility and chemical sectors. He is a chartered engineer with the Institution of Mechanical Engineers and holds an MBA from Insead. Mr Amber is also a NED of Apax Global Alpha and Foresight Solar Fund.

Finance Director: Martin Magee

Mr Magee is a qualified accountant and previously worked for Stakis and Scottish Power in a variety of senior financial roles. He joined JEL as finance director in 2002 and has served in this role since that date. Externally, Mr Magee is also the non-executive chairman of the Standard Life Wealth Offshore Strategy Fund.

Management team

Chairman: Geoffrey Grime

A qualified accountant, former senior partner of Coopers & Lybrand Channel Islands and a former deputy in the States of Jersey, Mr Grime joined the board of JEL in 2003 and has served as chairman since 2008.

Chief Executive: Chris Ambler

Mr Ambler has served as chief executive since 2008, having previously held senior positions in the utility and chemical sectors. He is a chartered engineer with the Institution of Mechanical Engineers and holds an MBA from Insead. Mr Amber is also a NED of Apax Global Alpha and Foresight Solar Fund.

Finance Director: Martin Magee

Mr Magee is a qualified accountant and previously worked for Stakis and Scottish Power in a variety of senior financial roles. He joined JEL as finance director in 2002 and has served in this role since that date. Externally, Mr Magee is also the non-executive chairman of the Standard Life Wealth Offshore Strategy Fund.

Principal shareholders* (listed shares only)

(%)

Ravenscroft

50.2%

Miton Asset Management

8.3%

*The figures above were taken from Bloomberg (27 January 2017). According to the 2016 Report & Accounts: 62% of the ordinary share capital is owned by the States of Jersey with the remaining 38% held by 600 shareholders. Of the holders of listed shares, Huntress (CI) Nominees owns 5.4m (47%) of the “A” shares and around 5% of the voting rights. This nominee company is held within the broker firm Ravenscroft.

Companies named in this report

EdF, National Grid, Pennon, Severn Trent, United Utilities, Terna, Snam Rete Gas, Enagas and Red Electrica

Edison is an investment research and advisory company, with offices in North America, Europe, the Middle East and AsiaPac. The heart of Edison is our world-renowned equity research platform and deep multi-sector expertise. At Edison Investment Research, our research is widely read by international investors, advisers and stakeholders. Edison Advisors leverages our core research platform to provide differentiated services including investor relations and strategic consulting. Edison is authorised and regulated by the Financial Conduct Authority. Edison Investment Research (NZ) Limited (Edison NZ) is the New Zealand subsidiary of Edison. Edison NZ is registered on the New Zealand Financial Service Providers Register (FSP number 247505) and is registered to provide wholesale and/or generic financial adviser services only. Edison Investment Research Inc (Edison US) is the US subsidiary of Edison and is regulated by the Securities and Exchange Commission. Edison Investment Research Limited (Edison Aus) [46085869] is the Australian subsidiary of Edison and is not regulated by the Australian Securities and Investment Commission. Edison Germany is a branch entity of Edison Investment Research Limited [4794244]. www.edisongroup.com

DISCLAIMER
Copyright 2017 Edison Investment Research Limited. All rights reserved. This report has been commissioned by Jersey Electricity and prepared and issued by Edison for publication globally. All information used in the publication of this report has been compiled from publicly available sources that are believed to be reliable, however we do not guarantee the accuracy or completeness of this report. Opinions contained in this report represent those of the research department of Edison at the time of publication. The securities described in the Investment Research may not be eligible for sale in all jurisdictions or to certain categories of investors. This research is issued in Australia by Edison Aus and any access to it, is intended only for "wholesale clients" within the meaning of the Australian Corporations Act. The Investment Research is distributed in the United States by Edison US to major US institutional investors only. Edison US is registered as an investment adviser with the Securities and Exchange Commission. Edison US relies upon the "publishers' exclusion" from the definition of investment adviser under Section 202(a)(11) of the Investment Advisers Act of 1940 and corresponding state securities laws. As such, Edison does not offer or provide personalised advice. We publish information about companies in which we believe our readers may be interested and this information reflects our sincere opinions. The information that we provide or that is derived from our website is not intended to be, and should not be construed in any manner whatsoever as, personalised advice. Also, our website and the information provided by us should not be construed by any subscriber or prospective subscriber as Edison’s solicitation to effect, or attempt to effect, any transaction in a security. The research in this document is intended for New Zealand resident professional financial advisers or brokers (for use in their roles as financial advisers or brokers) and habitual investors who are “wholesale clients” for the purpose of the Financial Advisers Act 2008 (FAA) (as described in sections 5(c) (1)(a), (b) and (c) of the FAA). This is not a solicitation or inducement to buy, sell, subscribe, or underwrite any securities mentioned or in the topic of this document. This document is provided for information purposes only and should not be construed as an offer or solicitation for investment in any securities mentioned or in the topic of this document. A marketing communication under FCA Rules, this document has not been prepared in accordance with the legal requirements designed to promote the independence of investment research and is not subject to any prohibition on dealing ahead of the dissemination of investment research.
Edison has a restrictive policy relating to personal dealing. Edison Group does not conduct any investment business and, accordingly, does not itself hold any positions in the securities mentioned in this report. However, the respective directors, officers, employees and contractors of Edison may have a position in any or related securities mentioned in this report. Edison or its affiliates may perform services or solicit business from any of the companies mentioned in this report. The value of securities mentioned in this report can fall as well as rise and are subject to large and sudden swings. In addition it may be difficult or not possible to buy, sell or obtain accurate information about the value of securities mentioned in this report. Past performance is not necessarily a guide to future performance. Forward-looking information or statements in this report contain information that is based on assumptions, forecasts of future results, estimates of amounts not yet determinable, and therefore involve known and unknown risks, uncertainties and other factors which may cause the actual results, performance or achievements of their subject matter to be materially different from current expectations. For the purpose of the FAA, the content of this report is of a general nature, is intended as a source of general information only and is not intended to constitute a recommendation or opinion in relation to acquiring or disposing (including refraining from acquiring or disposing) of securities. The distribution of this document is not a “personalised service” and, to the extent that it contains any financial advice, is intended only as a “class service” provided by Edison within the meaning of the FAA (ie without taking into account the particular financial situation or goals of any person). As such, it should not be relied upon in making an investment decision. To the maximum extent permitted by law, Edison, its affiliates and contractors, and their respective directors, officers and employees will not be liable for any loss or damage arising as a result of reliance being placed on any of the information contained in this report and do not guarantee the returns on investments in the products discussed in this publication. FTSE International Limited (“FTSE”) © FTSE 2017. “FTSE®” is a trade mark of the London Stock Exchange Group companies and is used by FTSE International Limited under license. All rights in the FTSE indices and/or FTSE ratings vest in FTSE and/or its licensors. Neither FTSE nor its licensors accept any liability for any errors or omissions in the FTSE indices and/or FTSE ratings or underlying data. No further distribution of FTSE Data is permitted without FTSE’s express written consent.

Frankfurt +49 (0)69 78 8076 960

Schumannstrasse 34b

60325 Frankfurt

Germany

London +44 (0)20 3077 5700

280 High Holborn

London, WC1V 7EE

United Kingdom

New York +1 646 653 7026

245 Park Avenue, 39th Floor

10167, New York

US

Sydney +61 (0)2 8249 8342

Level 12, Office 1205, 95 Pitt St,

Sydney NSW 2000

Australia

More on Jersey Electricity

View All

Latest from the Industrials sector

View All Industrials content

Marlborough Wine Estates — Update 2 March 2017

Marlborough Wine Estates

Continue Reading

Subscribe to Edison

Get access to the very latest content matched to your personal investment style.

Sign up for free