Last close As at 05/08/2026
GBP4.98
▲ −1.00 (−0.20%)
Market capitalisation
GBP990m
Research: Investment Companies
Invesco Asia Trust (IAT) has generated an annualised NAV total return of 10.1% over the past 10 years, supported by steady income. The board aims to pay a regular six-monthly dividend equivalent to 2% of NAV. A performance-related conditional tender offer (subject to shareholder approval), announced in August 2020, emphasises the board’s focus on total return. The fund manager, Ian Hargreaves, who has co-managed IAT since 2011 and has been sole manager since 2015, aims to outperform the market over three- to five-year rolling periods, following a bottom-up, contrarian approach, blending growth and value. He targets a double-digit annualised return from each portfolio holding. The manager expects his strategy to work well in the current environment.
Invesco Asia Trust |
Rallying out of the crisis |
Investment trusts |
2 September 2020 |
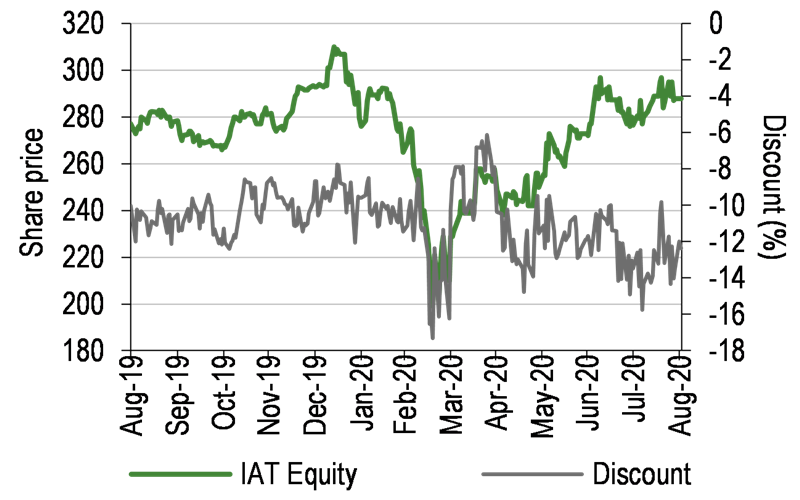
Share price/discount performance
Three-year performance vs index
Gearing
Analysts
|
|||||||||||||||||||||||||||||||||||||||||||||||||||||||||||||||||||||||||||||||||||||||||||
Invesco Asia Trust (IAT) has generated an annualised NAV total return of 10.1% over the past 10 years, supported by steady income. The board aims to pay a regular six-monthly dividend equivalent to 2% of NAV. A performance-related conditional tender offer (subject to shareholder approval), announced in August 2020, emphasises the board’s focus on total return. The fund manager, Ian Hargreaves, who has co-managed IAT since 2011 and has been sole manager since 2015, aims to outperform the market over three- to five-year rolling periods, following a bottom-up, contrarian approach, blending growth and value. He targets a double-digit annualised return from each portfolio holding. The manager expects his strategy to work well in the current environment.
|
The fund has outperformed during market rallies following corrections |
|
|
Source: Refinitiv, Bloomberg at 31 August 2020, Edison Investment Research |
The market opportunity
The chart above illustrates that IAT displays defensive features and tends to outperform the market during rallies that follow market corrections. The improving performance of Asian markets is correlated with the region’s long-term economic prospects. These remain bright and, despite current disruptions, regional economic growth should continue to outpace that of advanced economies. Asian companies are also likely to benefit from US-China global competition.
Why consider investing in Invesco Asia Trust?
■
Relatively high dividend income and enhanced dividend policy.
■
Ability to use revenue and capital reserves when necessary.
■
The manager believes that the portfolio is repositioned to outperform.
■
The board is proactive and committed to promoting the trust.
Volatile discount with the potential to narrow
IAT is trading at a 14.5% discount to its cum-income NAV, compared to its three-year average of 11.8%. The narrowing discount trend of 2019 (with a discount target of c 10%) was interrupted by the pandemic crisis in Q1 this year. Following the recent introduction of the performance-related conditional tender offer and enhanced dividend policy, IAT is well positioned for a narrower discount on the back of acceleration in performance and improving investor sentiment towards Asia.
Exhibit 1: Trust at a glance
Investment objective and fund background |
Recent developments |
||||||||||||||||||||||||||||||||||||||||||||||||||||||||||||||||||||||
Invesco Asia Trust’s objective is to provide long-term capital growth by investing in a diversified portfolio of Asian companies. On 1 May 2015, the trust adopted a new benchmark, MSCI AC Asia ex-Japan, in place of the former benchmark, MSCI AC Asia Pacific ex-Japan. While the new benchmark excludes Australasia, the trust may still invest in these markets. |
■ 28 August 2020: IAT announced two initiatives: the introduction of a performance-related conditional tender offer for up to 25% of issued share capital at a 2% discount to prevailing NAV/share, if the fund underperforms the benchmark, MSCI AC Asia ex Japan, by 0.5% pa over five years to 30 April 2025; and the aim to pay a regular six-monthly dividend equivalent to 2% of NAV on the last business day of September and February. These dividends will be paid from a combination of IAT’s revenues, revenue reserves and capital reserves as required. ■ 7 July 2020: Annual report for 12 months ending 30 April 2020 NAV TR -10.2% vs benchmark TR -4.1%. Share price TR -10.0%. Declared final dividend of 3.6p, total dividends of 7.0p (up 22.8% y-o-y). |
||||||||||||||||||||||||||||||||||||||||||||||||||||||||||||||||||||||
Forthcoming |
Capital structure |
Fund details |
|||||||||||||||||||||||||||||||||||||||||||||||||||||||||||||||||||||
AGM |
September 2020 |
Ongoing charges |
1.0% |
Group |
Invesco Asset Management |
||||||||||||||||||||||||||||||||||||||||||||||||||||||||||||||||||
Interim results |
December 2020 |
Net gearing |
3.1% |
Manager |
Ian Hargreaves |
||||||||||||||||||||||||||||||||||||||||||||||||||||||||||||||||||
Year end |
30 April |
Annual mgmt fee |
Tiered (see page 9) |
Address |
43–45 Portman Square |
||||||||||||||||||||||||||||||||||||||||||||||||||||||||||||||||||
Dividend paid |
November, April |
Performance fee |
None |
||||||||||||||||||||||||||||||||||||||||||||||||||||||||||||||||||||
Launch date |
July 1995 |
Trust life |
Indefinite |
Phone |
+44 (0)20 3753 1000 |
||||||||||||||||||||||||||||||||||||||||||||||||||||||||||||||||||
Continuation vote |
Three yearly, next 2022 |
Loan facilities |
£20m multi-currency |
Website |
|||||||||||||||||||||||||||||||||||||||||||||||||||||||||||||||||||
Dividend policy and history (financial years) |
Share buyback policy and history (financial years) |
||||||||||||||||||||||||||||||||||||||||||||||||||||||||||||||||||||||
An interim dividend was introduced in FY19. Dividends are payable in November and April (previously January and September). |
Renewed annually, the trust has authority to purchase up to 14.99% and allot up to 5% of issued share capital. Repurchases include tender offers. |
||||||||||||||||||||||||||||||||||||||||||||||||||||||||||||||||||||||
|
|
||||||||||||||||||||||||||||||||||||||||||||||||||||||||||||||||||||||
Shareholder base (as at 26 June 2020) |
Portfolio exposure by sector (as at 31 July 2020, ex-cash) |
||||||||||||||||||||||||||||||||||||||||||||||||||||||||||||||||||||||
|
|
||||||||||||||||||||||||||||||||||||||||||||||||||||||||||||||||||||||
Top 10 holdings (as at 31 July 2020) |
|||||||||||||||||||||||||||||||||||||||||||||||||||||||||||||||||||||||
|
|||||||||||||||||||||||||||||||||||||||||||||||||||||||||||||||||||||||
Source: Invesco Asia Trust, Edison Investment Research, Bloomberg, Morningstar. Note: *N/A where not in end-July 2019 top 10.
Market outlook: A what-shape recovery?
The pandemic saw Asian equities fall almost 30% from their highs of January 2020, and have since recovered close to their pre-COVID-19 level, but the outlook remains uncertain.
The Q2 rebound was led by fresh stimulus from major central banks and the reopening of economies across the world as the lockdowns were lifted. In China, targeted stimulus measures resulted in some consumer spending recovery and the return of production to pre- COVID-19 levels. Market returns in Korea, a country that avoided a complete economic lockdown, were supported by a better-than-expected earnings season and additional economic support from the government. The export-focused Taiwanese market performed well on hopes of global demand recovery in H220, while the Hong Kong market lagged the broader market rally, following China’s announcement of a national security law, which came into effect on 30 June.
The COVID-19 pandemic turned out to be a ‘black swan’: an unexpected event with significant repercussions for the market and world economies. It has led to a significant contraction in economic activity and considerable uncertainty over the timing and pace of recovery. Economic uncertainty is likely to continue into 2021. The timing and shape of the recovery depends a lot upon: the emergence of a tested and reliable vaccine; the ability of governments to manage second (and further) waves of COVID-19 with minimum disruption to the economy; and the speed at which the world adjusts to the new order.
Asia’s long-term economic prospects remain bright and, despite current disruptions, regional economic growth should continue to outpace that of advanced economies, as illustrated by the IMF figures in Exhibit 2 (RHS). US-China global competition continues and is likely to produce more investible Asian companies, benefiting from further government investment in the critical for economic breakthrough areas, such as science and technology research and development.
|
Exhibit 2: Market performance and valuation |
|
Performance vs index |
IMF world economic growth forecasts (June 2020) |
|
|
|
Source: Refinitiv, Edison Investment Research, International Monetary Fund (IMF) |
|
Fund profile: Long-term capital growth and income
Launched in 1995, IAT aims to provide long-term capital growth through investing in a well-diversified portfolio of companies listed in Asia. The benchmark is the MSCI AC Asia ex-Japan index (the MSCI Asia Pacific ex-Japan Index prior to 2015), reflecting the trust’s primary focus on Asia and persistently low exposure to Australasia. The fund manager, Ian Hargreaves, who co-ran IAT since 2011 and became sole manager in 2015, aims to outperform the market over three- to five-year rolling periods, following a bottom-up, contrarian approach. He looks to buy companies with strong fundamentals, but are ‘unloved’ by the market and trading at a significant discount, and targets a double-digit annualised return from each portfolio stock. The style is a blend of growth and value. IAT has recently enhanced its dividend policy and income will continue to contribute materially to NAV and share price total returns. Its underlying dividend yield is close to 3%. The portfolio of c 50–60 stocks represents the manager’s highest-conviction investment ideas. Gearing is permitted up to 25% of net assets; at end-June 2020, IAT had net gearing of 3.3%.
The fund manager: Ian Hargreaves
The manager’s view: The world will eventually normalise
Despite challenges and uncertainties, Hargreaves looks towards the future of Asia and the world with cautious optimism. The rapid spread of COVID-19 during the first quarter, firstly in China and then globally, and subsequent lockdowns, put a sudden break on Hargreaves’ hopes for an Asian economic recovery in 2020. He expects the world order to normalise eventually but believes the recovery will be slow. The manager is upbeat about 2021 earnings potential and dividends from Asian companies. Anticipating economic rebound and steady earnings, he invested in businesses from still unpopular sectors, such as airports and financials. He is focused on finding companies that are oversold and present a ‘golden’ long-term opportunity. The manager uses a regional approach to buy into companies based in less-indebted countries. He currently views India to be on the favourable side of a credit cycle emerging from a period of very low credit growth and aims to benefit from increased Indian exposure. Hargreaves points out that the coronavirus outbreak has accentuated some existing trends, such as the shift to online activity, and IAT is well positioned to benefit from its overweight position in Chinese internet companies.
Asset allocation
Investment process: Valuation based, contrarian and long-term
The approach is team-based, bottom-up and valuation-focused. The Invesco Asia team consists of eight experienced analysts/portfolio managers and Hargreaves has been investing in the region for over 25 years. The team searches for Asia ex-Japan listed companies that are ‘unloved’ by the market and whose shares trade at a significant discount to their fair values. The initial universe of over 10,000 listed Asian companies is narrowed down by quantitative filters to an investable universe of c 1,000 companies. The team conducts close to 1,000 company meetings each year. Each analyst has country responsibilities, but some crossover is permitted. Analysts maintain their stock monitoring lists with up-to-date valuations and pitch ideas to each other. These companies are ranked by their estimated total return over three years. Hargreaves targets a double-digit annualised return for each portfolio company over a three- to five-year year rolling period. Portfolio construction reflects the conviction levels behind the individual stocks, but also portfolio diversification and risk considerations.
Current portfolio positioning
At 31 July 2020 the portfolio had 56 holdings within its 50–60 range. Exhibits 3 and 4 display the fund’s exposures by country and sector at end-July 2020 and illustrate active management of the portfolio. The most significant change over 12 months was the reduction of the overweight in financials (-16.1pp), bringing the position to 17.8% – a marginal underweight (-0.3pp) relative to the benchmark. Prior to the COVID-19 crisis the portfolio was positioned for a 2020 recovery in Asia, with large exposure to cyclicals, in particular, banks and other financials. Following the sharp market correction in March, when banks fell more than the market, Hargreaves began repositioning the portfolio for the new environment. He materially cut financials and added to the pandemic ‘beneficiaries’ in the areas of technology hardware, semiconductors, internet and healthcare. The manager continued to cut exposure to the financials sector over the second quarter by selling holdings in Shinhan Financial and China Life Insurance (Taiwan), and reducing exposure to other banks and insurers. As Asia began to handle the crisis in the spring and summer, he increased exposure to selective cyclical economically sensitive businesses given their undemanding valuations and strong balance sheets. These included consumer discretionary (+8.7pp) and information technology (+7.6pp). The technology sector’s weighting was boosted by highly cash-generative Chinese internet companies, as well as dominant cash-backed technology companies in Korea and Taiwan.
As a result, geographic weightings of both Hong Kong and China (+4.7pp) and South Korea (+5.9pp) increased year-on-year and were the largest sector increases over the period. Despite the overall India weighting reduction which is the largest over the 12-month period (-2.4pp), Hargreaves selectively favours Indian companies. India is at the bottom of the credit cycle, with the recent market sell-off leaving a number of good-quality businesses trading meaningfully below the team’s estimate of their fair values. During the second quarter the manager added to the holdings in the Indian conglomerate, Mahindra & Mahindra and in UPL.
Exhibit 3: Portfolio geographic exposure vs benchmark (% unless stated)
Portfolio end- April 2020 |
Portfolio end-April 2019 |
Change |
Benchmark weight |
Active weight vs index (pp) |
Trust weight/ index weight (x) |
|
Hong Kong & China |
46.3 |
41.6 |
4.7 |
54.1 |
(7.8) |
0.9 |
South Korea |
19.4 |
13.4 |
5.9 |
14.6 |
4.8 |
1.3 |
Taiwan |
16.0 |
16.4 |
(0.4) |
12.9 |
3.1 |
1.2 |
India |
14.0 |
16.5 |
(2.4) |
9.1 |
4.9 |
1.5 |
Singapore |
2.2 |
3.4 |
(1.2) |
2.6 |
(0.4) |
0.8 |
Thailand |
2.1 |
1.9 |
0.2 |
0.0 |
2.1 |
N/A |
Australia |
1.7 |
3.4 |
(1.7) |
2.3 |
(0.6) |
0.7 |
Indonesia |
1.0 |
1.5 |
(0.5) |
1.6 |
(0.5) |
0.7 |
Malaysia |
0.1 |
0.9 |
(0.7) |
2.0 |
(1.9) |
0.1 |
Japan |
0.0 |
0.0 |
0.0 |
0.0 |
(0.0) |
0.0 |
Philippines |
0.0 |
0.0 |
0.0 |
0.8 |
(0.8) |
0.0 |
Source: Invesco Asia Trust, Edison Investment Research. Note: Rebased for cash/gearing
Exhibit 4: Portfolio sector exposure vs benchmark (% unless stated)
Portfolio end- July 2020 |
Portfolio end-July 2019 |
Change |
Benchmark weight |
Active weight vs index (pp) |
Trust weight/ index weight (x) |
|
Information technology |
27.7 |
20.0 |
7.6 |
20.6 |
7.1 |
1.3 |
Consumer discretionary |
20.2 |
11.5 |
8.7 |
18.5 |
1.7 |
1.1 |
Financials |
17.8 |
33.9 |
(16.1) |
18.1 |
(0.3) |
1.0 |
Communication services |
16.6 |
11.2 |
5.4 |
13.4 |
3.2 |
1.2 |
Industrials |
6.8 |
7.5 |
(0.7) |
5.5 |
1.3 |
1.2 |
Materials |
3.7 |
4.3 |
(0.6) |
3.8 |
(0.1) |
1.0 |
Energy |
2.6 |
4.0 |
(1.5) |
3.3 |
(0.8) |
0.8 |
Healthcare |
2.3 |
2.1 |
0.2 |
4.6 |
(2.3) |
0.5 |
Consumer staples |
2.0 |
2.0 |
0.0 |
5.4 |
(3.4) |
0.4 |
Real estate |
0.5 |
2.6 |
(2.1) |
4.5 |
(4.1) |
0.1 |
Utilities |
0.0 |
0.9 |
(0.9) |
2.4 |
(2.4) |
0.0 |
Total |
100.0 |
100.0 |
100.0 |
Source: Invesco Asia Trust, Edison Investment Research. Note: Rebased for cash/gearing.
Recent new positions in the portfolio include Astra International, the largest seller of cars in Indonesia; and Yue Yuen Industrial, the Hong Kong-headquartered athletic footwear manufacturer with scope for operating margins to recover as conditions normalise. Hargreaves also bought Beijing Capital International, the cheapest airport in the world, with a market cap of c $3bn. The manager spotted a valuation opportunity, as prior to 2020, Bangkok airport’s capacity was comparable in size but had a market cap of c $20bn. Beijing Capital International has very little debt and the manager expects the valuation gap to narrow, as international travel resumes. Recent sales included Korea Electric Power and Bitauto, after it was confirmed that its privatisation was going ahead, and the share price discount to the bid price narrowed.
Two examples of strong stock selection of growth companies purchased at favourable prices within the portfolio are Mediatek, the Taiwanese supplier of 5G chips and NetEase, the largest game developer in China.
Performance: On the improving trend
The trust’s long-term performance remains solid. Exhibits 6 and 7 illustrate that IAT significantly outperformed its benchmark over 10 years, generating annualised gains of 10.1%, on a NAV total return basis, compared with 8.4% pa for the index. The more recent relative performance has weakened, resulting in the fund’s NAV underperforming the benchmark in the last three consecutive years (Exhibit 5).
IAT’s disciplined blended value/growth investment style typically results in the fund’s outperformance as markets rally following a crisis, such as those in the second and third quarters of 2020 (see chart on page 1). It also results in relative underperformance in growth momentum markets, including those of the past three years. Consistent portfolio acquisitions at relatively low valuations have resulted in IAT’s forward P/E and P/B ratios of 15.3x and 1.3x, respectively (source: Invesco at 31 July 2020) below that of the MSCI Asia ex Japan (17.9x and 1.8x, respectively). During the coming out of crisis rallies, share prices of quality undervalued stocks tend to appreciate faster than the market. Generally consisting of such stocks, IAT’s portfolio outperformed during the 2009 and 2016 market recoveries and has broadly caught up with the market ytd. The relative performance catch-up has been slower this year, as the manager had to reposition the portfolio, following the sharp market correction in March.
Hargreaves believes that the rebalanced portfolio is positioned well to outperform. He suggests that the market has priced in the potential of most technology related stocks already. These comprise 40–45% of the fund, but many other companies still have upside. The manager adds that even some technology portfolio companies, particularly Apple suppliers, still have potential upside.
Exhibit 5: Five-year discrete performance data
12 months ending |
Total share price return (%) |
Total NAV return (%) |
Benchmark* (%) |
MSCI World (%) |
CBOE UK All Companies (%) |
MSCI AC Asia ex-Japan (%) |
31/08/16 |
39.3 |
39.3 |
33.0 |
26.0 |
12.7 |
33.0 |
31/08/17 |
26.9 |
28.0 |
27.2 |
18.8 |
14.3 |
27.2 |
31/08/18 |
(1.1) |
0.8 |
2.2 |
12.7 |
4.3 |
2.2 |
31/08/19 |
2.5 |
(0.5) |
0.3 |
7.6 |
0.3 |
0.3 |
31/08/20 |
7.2 |
9.1 |
10.9 |
6.8 |
(13.5) |
10.9 |
Source: Refinitiv. Note: All % on a total return basis in GBP. *Benchmark is MSCI AC Asia Pacific ex-Japan until 30 April 2015 and MSCI AC Asia ex-Japan thereafter.
|
Exhibit 6: Five-year discrete performance data |
|
Price, NAV and benchmark total return performance, one-year rebased |
Price, NAV and benchmark total return performance (%) |
|
|
|
Source: Refinitiv, Edison Investment Research. Note: Three, five and 10-year performance figures annualised. |
|
|
Exhibit 7: Share price and NAV total return performance, relative to indices (%) |
||||||||
|
One month |
Three months |
Six months |
One year |
Three years |
Five years |
10 years |
|
Price relative to benchmark |
2.6 |
2.3 |
0.4 |
(3.4) |
(4.4) |
(0.1) |
14.8 |
|
NAV relative to benchmark |
0.8 |
2.8 |
0.7 |
(1.7) |
(3.8) |
1.4 |
16.2 |
|
Price relative to CBOE UK All Companies |
2.2 |
15.2 |
20.6 |
23.9 |
20.1 |
64.7 |
46.1 |
|
NAV relative to CBOE UK All Companies |
0.5 |
15.8 |
20.9 |
26.1 |
20.9 |
67.3 |
48.0 |
|
|
Source: Refinitiv, Edison Investment Research. Note: Data to end-August 2020. Geometric calculation. |
||||||||
|
Exhibit 8: NAV total return performance relative to benchmark over three years |
||||||||
|
||||||||
|
Source: Refinitiv, Edison Investment Research |
||||||||
Discount: Volatile with potential to narrow
IAT is currently trading at a 14.5% discount to its cum-income NAV, which is wider than its three-year average of 11.6%. The board targets a discount of less than 10%, in normal market conditions. This year the market conditions have been abnormal. Having widened sharply across the board in March, as the market corrected, most investment funds’ discounts have been volatile. This includes IAT and its peer group. IAT’s discount touched a three-year low of 17.8% on the 17 March, then rallied to a three-year high of 6.4% on the 24 April, as Asian stocks rebounded, and has since drifted wider to the current level. Discounts of the peers have been mixed with about half trading around IAT’s and the others - at tighter levels. IAT is positioned to benefit from a narrower discount on the back of acceleration in performance, as the market begins to recognise and reward more businesses with robust fundamentals. Positive momentum towards Asia should also help to narrow the discount as the region potentially returns to faster growth than the rest of the world, attracting more investors to the region.
|
Exhibit 9: Share price discount to NAV (including income) over three years (%) |
|
|
Source: Refinitiv, Edison Investment Research |
The board recently implemented two further initiatives aimed at bringing the discount to its target: the introduction of a performance-related conditional tender offer and dividend enhancement. The discount appeared to be on a narrowing trend following the board’s efforts to broaden the appeal of the trust in late 2018 until the current crisis struck in Q1 this year. Changes introduced by the board in late 2018 to help broaden the appeal of the trust, with the aim of reducing the discount, include the introduction of an interim dividend and the ability to use the company’s capital reserves if necessary, along with a reduction in the management fee for assets above £250m. The board also has the ability (renewed annually) to repurchase up to 14.99% of the trust’s share capital.
Capital structure and fees
IAT has one share class, there are currently 66.9m ordinary shares in issue and a further 8.1m held in treasury. During FY20, IAT repurchased 3.6m shares at a total cost of £10.1m, representing 5.4% of total shares in issue (0.5m shares were repurchased in FY19). The trust is subject to a continuation vote; the next vote is at the September 2022 AGM.
In August 2020, the board announced a tender offer of up to 25% of the company’s issued share capital at a 2% discount to prevailing NAV per share, if NAV cum-income total return performance over the five-year period ending 30 April 2025 fails to exceed the company’s comparator index, the MSCI AC Asia ex Japan Index (total return, in sterling terms) by 0.5% pa over the five years on a cumulative basis. The tender offer is subject to shareholder approval.
Gearing is permitted up to 25% of net assets. The trust has a £20m multi-currency revolving credit facility with Bank of New York Mellon and at end-July 2020 it had net gearing of 3.1%. In 2018, the board agreed a new fee structure with Invesco Fund Managers. The annual fee of 0.75% per year continues to apply to assets up to £250m; and a lower fee of 0.65% per year on assets over £250m was introduced. The fee is paid from the revenue and capital accounts in the proportion of 25:75 respectively, representing the board’s expected split of long-term returns from the portfolio. Ongoing charge including annual management fee is 1.0% (at 3 July 2020).
Dividend policy and record
Dividends are paid twice a year in November and April. In 2019 the board introduced an interim dividend and in 2020 brought forward the timing of dividend payments from January and September in order to align more closely with receipt of income into the portfolio. In August 2020, the board announced a dividend enhancement initiative to pay a regular six-monthly dividend equal to 2% of NAV on the last business day of September and February. These dividends will be paid from a combination of the company’s revenues, revenue reserves and capital reserves as required. In 2020 the board approved the use of revenue and capital reserves when necessary to smooth dividend payments in years when they are not fully covered by revenue income.
The total dividend for FY20 of 7.0p per share represents an 23% increase on FY19 (5.7p per share). The FY20 revenue return per share was 7.8p per share. After payment of the final dividend of 3.6p per share in April 2020, revenue reserves represented 84% of the full year’s dividend. The company has c £170m of distributable reserves equivalent to around 28x of the full year’s dividend (consisting of 0.8x of revenue and 27.0x of other distributable reserves). Hargreaves expects FY21 revenue income to be broadly in line with the current year, as analysts expect relatively stable earnings. The manager also anticipates some portfolio companies with less stable earnings to increase their payout ratios as a proportion of their earnings, which could help to smooth IAT’s dividend payments.
Peer group comparison
Exhibit 10 shows the eight AIC Asia Pacific sector funds with a market capitalisation greater than £100m; IAT is the smallest in this selected peer group. The trust ranks fourth by NAV total return over one, five and 10 years. Recently the NAV performance has strengthened and the ranking has improved compared to the medium term, as the fund ranks seventh over three years. IAT has the highest dividend yield. The trust’s discount to cum-fair NAV is wider than average; but is similar to three of its peers. Discounts widened across the peer group in March, as the market corrected, and since then have remained volatile.
Exhibit 10: Selected peer group as at 31 August 2020*
% unless stated |
Market cap £m |
NAV TR |
NAV TR |
NAV TR |
NAV TR |
Discount (cum-fair) |
Ongoing charge |
Perf. |
Net |
Dividend yield (%) |
Invesco Asia Ord |
192.5 |
8.8 |
9.0 |
92.5 |
160.7 |
(13.6) |
1.0 |
No |
105 |
2.4 |
Aberdeen New Dawn Ord |
285.1 |
8.8 |
19.3 |
90.0 |
115.9 |
(13.5) |
0.8 |
No |
107 |
1.7 |
Asia Dragon Ord |
520.6 |
4.9 |
17.3 |
86.6 |
116.0 |
(13.9) |
0.8 |
No |
103 |
1.2 |
Pacific Assets Ord |
319.3 |
(0.6) |
15.5 |
67.3 |
167.1 |
(9.6) |
1.2 |
No |
100 |
1.1 |
Pacific Horizon Ord |
366.8 |
55.5 |
62.0 |
197.9 |
242.7 |
5.3 |
1.0 |
No |
103 |
0.0 |
Schroder Asian Total Return |
392.8 |
15.5 |
26.1 |
124.1 |
162.2 |
(2.7) |
0.9 |
Yes |
106 |
1.6 |
Schroder Asia Pacific Ord |
820.1 |
14.9 |
17.4 |
111.3 |
195.4 |
(12.0) |
0.9 |
No |
100 |
2.0 |
Witan Pacific Ord |
225.9 |
5.0 |
6.7 |
61.0 |
105.8 |
(2.8) |
1.0 |
Yes |
100 |
1.9 |
Average |
390.4 |
14.1 |
21.7 |
103.8 |
158.2 |
(7.9) |
1.0 |
103 |
1.5 |
|
Trust rank in sector (8 funds) |
14.8 |
22.4 |
107.7 |
164.8 |
(8.4) |
0.9 |
103 |
1.5 |
Source: Morningstar, Edison Investment Research. Note: *Performance data to 31 August 2020 based on ex-par NAV. TR=total return. Net gearing is total assets less cash and equivalents as a percentage of net assets.
The board
The IAT board consists of five independent non-executive directors, chaired by Neil Rogan (appointed in September 2017 and assumed his current role in July 2018). Vanessa Donegan was appointed to the board with effect from October 2019, bringing 37 years’ experience of managing Asian equity portfolios. She will replace Tom Maier who will retire this year, at the conclusion of the AGM on 3 September, after 11 years on the board. The other directors are Owen Jonathan (appointed March 2013 and became senior independent director in July 2018) and Fleur Meijs (December 2016).
|
|
Research: Industrials
The performance in H120 was encouraging, especially given the global disruption caused by the pandemic in Q220. However, external challenges that arose, such as delays or deferral of orders by customers and disruption to the supply chain for key components and subsystems, are expected to weigh on H220 and could persist into FY21. We are reducing our net sales estimates for FY20 and FY21 by 12% and 24%, respectively, which still represents strong growth in both years, although deferring the estimate of positive EBITDA beyond FY21.