Last close As at 06/08/2026
GBP2.22
▲ 1.00 (0.45%)
Market capitalisation
GBP508m
Research: TMT
The acquisition of PCA Predict is an excellent fit with GB Group’s (GBG) address intelligence services, adding SME reach and, combined with Matchcode360 and Loqate, providing GBG with the most complete offer in the industry. GBG has closed a £58m placing to fund the £66m acquisition (EV), which it will supplement with existing cash and debt. Despite the planned increase in investment to expand PCA outside the UK, the deal should be earnings enhancing and we upgrade our FY18 and FY19 EPS forecasts by 8.5% and 10.4%, respectively.
GB Group |
PCA acquisition an excellent fit |
Acquisition |
Software & comp services |
11 May 2017 |
Share price performance
Business description
Next events
Analysts
GB Group is a research client of Edison Investment Research Limited |
|||||||||||||||||||||||||||||||||||||||||||||||||
The acquisition of PCA Predict is an excellent fit with GB Group’s (GBG) address intelligence services, adding SME reach and, combined with Matchcode360 and Loqate, providing GBG with the most complete offer in the industry. GBG has closed a £58m placing to fund the £66m acquisition (EV), which it will supplement with existing cash and debt. Despite the planned increase in investment to expand PCA outside the UK, the deal should be earnings enhancing and we upgrade our FY18 and FY19 EPS forecasts by 8.5% and 10.4%, respectively.
Year |
Revenue (£m) |
EBIT* |
PBT* |
EPS* |
DPS |
P/E |
Yield |
03/16 |
73.4 |
13.4 |
13.2 |
8.2 |
2.1 |
47.0 |
0.5 |
03/17e |
87.5** |
17.0** |
16.5 |
9.7 |
2.2 |
39.7 |
0.6 |
03/18e |
117.1 |
23.3 |
22.6 |
11.5 |
2.5 |
33.5 |
0.6 |
03/19e |
133.4 |
27.3 |
26.7 |
13.4 |
2.8 |
28.7 |
0.7 |
Note: *EBIT, PBT and EPS (fully diluted) are normalised, excluding amortisation of acquired intangibles, exceptional items and share-based payments. **Reported in trading update.
PCA adds SME reach to address intelligence services
PCA Predict provides type-ahead address look-up functionality to SMEs in order to improve customer experience and conversion rates. PCA has over 9,000 SME customers to its self-serve cloud-based platform, providing a highly complementary fit to GBG’s existing enterprise focused services in this area (Loqate and Matchcode360). The combined business will have the broadest offering on the market and management believes that there are other synergy opportunities from the cross sell of GBG’s other services. GBG is paying net £66m for the business; a total consideration of £78m reflects £10m cash acquired with the company and £2m fees. To finance the acquisition, GBG has placed 17.1m new shares at 340p, raising £58m, and will supplement this with cash on hand and debt drawn from existing facilities.
Earnings enhancing despite growth investment
Management estimates the global addressable market for address intelligence services at $1bn, of which the UK is c 15%. PCA has grown its revenues at double-digit rates over the last two years, but its customer base remains largely UK oriented. It plans to invest to enable the enlarged division to target the US and Australian markets, where it is currently under-represented. Despite this step up in investment, we expect the deal to be earnings enhancing from the first year and upgrade our FY18 and FY19 EPS by 8.5% and 10.4%, respectively.
Valuation: Fairly priced
GBG is paying a multiple of 14.0x EV/EBITDA and 20.3x P/E for PCA (12 months to February 2017), a full but fair price given the strategic value it brings to GBG, and still considerably below GBG’s own rating. Chris Clarke, incoming CEO at GBG, is steeped in experience in this segment from his time at Experian, and we are optimistic that cross-selling opportunities and plans to invest outside the UK should ensure strong growth into the medium term.
PCA Predict acquisition
PCA – type ahead look-up functionality
PCA (derived from Post Code Anywhere) is a UK-based provider of postal address, mobile and email data cleansing and verification in order to improve the customer data entry experience and ultimately customer conversion rates. It runs a cloud-based self-serve platform for its 9,000, largely SME customer base, however it also sells into some larger accounts (for example Allianz, ASOS, Atos, Countrywide, William Hill). PCA’s headquarters are in Worchester, UK, where the majority of its 50 employees are located. It also has small satellite operations in the US and Germany.
Deal rationale
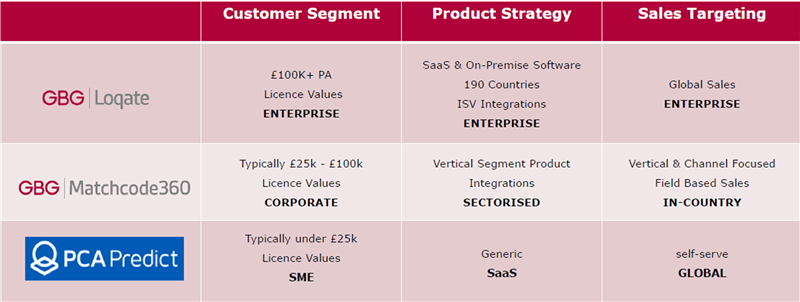
Scale and reach: GBG’s US-based Loqate has a predominantly enterprise customer base, sold via channel partners, and UK-based Matchcode also serves a largely enterprise grade customer. PCA’s self-serve, cloud-based platform gives GBG reach into the SME market.
Leading position: Management believes that post this acquisition, GBG will have the most complete solution in the address intelligence services market. Its largest competitors in this segment include Experian (Experian Data Quality), Informatica (Address Doctor) and to a lesser extent Google’s Auto Address functionality (although this only goes as far as street level). However, these services do not have an SME capability, nor the granularity of reference data that can be offered by GBG post this acquisition.
Synergies: GBG will add data access from the wider group to enhance the PCA service offer. The acquisition should also enable GBG to cross sell its other services into PCA’s client base. For example, regulated customers such as lawyers or IFAs may be interested in the verification tools. The technology will be integrated with GBG Loqate and GBG Matchcode and the use of a common technology platform should enable scale benefits related to data sourcing.
Expansion to the US and Australia: GBG estimates the address intelligence market is worth approximately $1bn. PCA is currently largely UK-focused. Under the GBG umbrella, management plans to introduce a common brand and add new data sources to grow its footprint in the US and Australia.
|
Exhibit 1: PCA Predict complements Matchcode and Loqate |
|
|
Source: GB Group |
Acquisition terms and impact on forecasts
The total consideration for the deal is £78m, reflecting an enterprise value of £66m, £10m cash acquired with PCA and £2m in deal fees. Of this consideration, £10m will be placed in escrow to cover any potential warranties, indemnities, potential competition authority reviews and other conditions.
To finance the acquisition, GBG has placed 17.1m new shares at 340p (a 3.4% discount to the price on 8 May), raising £58m. The balance will be financed by existing cash reserves and borrowings of £10m under existing bank facilities.
PCA reported double-digit revenue growth in FY15 (+18%) and FY17 (+16.5% for the 12 months to February) and management expects double-digit revenue growth to continue in the current year.
PCA runs a self-serve cloud-based platform to customers. This means that the gross margin was approximately 10pp lower than GBG’s equivalent business (due to commissions paid to channel partners, payment service providers hosting costs and scale benefits). However, as there is no direct salesforce, the operating margin (33% in FY17) is higher than GBG’s.
In our forecasts we reflect plans to immediately reconfigure the sales effort to enable the cross-selling of GBG’s services, and the investment in new reference data sources in the US and Australian markets, and consequently we expect EBIT margins to decrease to approximately 27%. We forecast PCA revenues of £14.5m (on a reported basis) in FY17 and £18.1m in FY19, which implies an average revenue growth of 16% over the period FY17 to FY19. Over time, we believe there could be scope to increase the gross margin as PCA benefits from GBG’s scale in sourcing data. This would represent upside to our current margin estimates.
We update our forecasts to reflect the acquisition and financing and have also taken the opportunity to update for GBG’s headline FY17 revenue and EBITA figures, announced in April. Changes are summarised in Exhibit 2 and presented in full in Exhibit 3.
Overall, we increase our EBITA estimates by approximately 19% in both FY18 and FY19. The dilution impact from the placing and the additional £10m of debt financing mean that at the EPS level we increase forecasts by 8.5% in FY18 and 10.4% in FY19.
Exhibit 2: Summary forecast changes
£000s |
2017e |
2018e |
2019e |
||||||||
Previous |
New |
% change |
|
Previous |
New |
% change |
|
Previous |
New |
% change |
|
Revenues |
89,000 |
87,500 |
-1.7 |
105,000 |
117,093 |
11.5 |
118,125 |
133,352 |
12.9 |
||
EBITA |
16,574 |
17,000 |
2.6 |
19,600 |
23,300 |
18.9 |
22,900 |
27,300 |
19.2 |
||
PBT |
15,917 |
16,500 |
3.7 |
19,008 |
22,550 |
18.6 |
22,308 |
26,700 |
19.7 |
||
EPS - normalised, diluted (p) |
9.4 |
9.7 |
3.4 |
10.6 |
11.5 |
8.5 |
12.1 |
13.4 |
10.4 |
||
Source: Edison Investment Research
Exhibit 3: Financial summary
£000s |
2014 |
2015 |
2016 |
2017e |
2018e |
2019e |
||
Year end 31 March |
IFRS |
IFRS |
IFRS |
IFRS |
IFRS |
IFRS |
||
PROFIT & LOSS |
||||||||
Revenue |
|
|
41,835 |
57,283 |
73,401 |
87,500 |
117,093 |
133,352 |
Cost of Sales |
(14,473) |
(16,448) |
(17,606) |
(11,693) |
(28,822) |
(32,798) |
||
Gross Profit |
27,362 |
40,835 |
55,795 |
75,807 |
88,271 |
100,555 |
||
EBITDA |
|
|
7,849 |
11,844 |
14,772 |
19,200 |
26,200 |
30,605 |
Operating Profit (before amort. and except.) |
7,164 |
10,790 |
13,428 |
17,000 |
23,300 |
27,300 |
||
Acquired intangible amortisation |
(1,110) |
(1,986) |
(2,501) |
(2,540) |
(2,540) |
(2,540) |
||
Exceptionals |
(1,080) |
(1,629) |
(94) |
(1,200) |
(2,200) |
0 |
||
Share of associate |
(159) |
(10) |
0 |
0 |
0 |
0 |
||
Share based payments |
(747) |
(971) |
(1,245) |
(1,600) |
(1,750) |
(1,699) |
||
Operating Profit |
4,068 |
6,194 |
9,588 |
11,660 |
16,810 |
23,061 |
||
Net Interest |
(79) |
(266) |
(270) |
(500) |
(750) |
(600) |
||
Profit Before Tax (norm) |
|
|
7,085 |
10,524 |
13,158 |
16,500 |
22,550 |
26,700 |
Profit Before Tax (FRS 3) |
|
|
3,989 |
5,928 |
9,318 |
11,160 |
16,060 |
22,461 |
Tax |
(474) |
(1,127) |
(178) |
(3,630) |
(4,961) |
(5,874) |
||
Profit After Tax (norm) |
5,597 |
8,314 |
10,395 |
12,870 |
17,589 |
21,093 |
||
Profit After Tax (FRS 3) |
3,515 |
4,801 |
9,140 |
7,530 |
11,099 |
16,587 |
||
Average Number of Shares Outstanding (m) |
109.6 |
119.1 |
122.7 |
127.8 |
147.8 |
152.5 |
||
EPS - normalised (p) |
|
|
5.1 |
7.0 |
8.5 |
10.1 |
11.9 |
13.8 |
EPS - normalised and fully diluted (p) |
|
4.8 |
6.7 |
8.2 |
9.7 |
11.5 |
13.4 |
|
EPS - (IFRS) (p) |
|
|
3.2 |
4.0 |
7.4 |
5.9 |
7.5 |
10.9 |
Dividend per share (p) |
1.7 |
1.9 |
2.1 |
2.2 |
2.5 |
2.8 |
||
Gross Margin (%) |
65.4 |
71.3 |
76.0 |
86.6 |
75.4 |
75.4 |
||
EBITDA Margin (%) |
18.8 |
20.7 |
20.1 |
21.9 |
22.4 |
23.0 |
||
Operating Margin (before GW and except.) (%) |
17.1 |
18.8 |
18.3 |
19.4 |
19.9 |
20.5 |
||
BALANCE SHEET |
||||||||
Fixed Assets |
|
|
26,985 |
51,238 |
59,364 |
94,424 |
165,684 |
162,489 |
Intangible Assets |
23,329 |
45,296 |
54,113 |
88,573 |
159,933 |
157,243 |
||
Tangible Assets |
1,519 |
2,829 |
2,234 |
2,834 |
2,734 |
2,229 |
||
Other fixed assets |
2,137 |
3,113 |
3,017 |
3,017 |
3,017 |
3,017 |
||
Current Assets |
|
|
23,775 |
33,186 |
36,189 |
51,945 |
67,339 |
86,202 |
Debtors |
11,929 |
17,408 |
23,774 |
34,555 |
49,073 |
56,377 |
||
Cash |
11,846 |
15,778 |
12,415 |
17,390 |
18,267 |
29,825 |
||
Other |
0 |
0 |
0 |
0 |
0 |
0 |
||
Current Liabilities |
|
|
(17,861) |
(30,784) |
(32,559) |
(40,640) |
(52,158) |
(57,162) |
Creditors |
(17,861) |
(24,305) |
(30,927) |
(39,008) |
(50,526) |
(55,530) |
||
Contingent consideration |
0 |
(5,733) |
(1,050) |
(1,050) |
(1,050) |
(1,050) |
||
Short term borrowings |
0 |
(746) |
(582) |
(582) |
(582) |
(582) |
||
Long Term Liabilities |
|
|
(2,066) |
(7,506) |
(6,593) |
(17,751) |
(24,851) |
(20,851) |
Long term borrowings |
0 |
(3,643) |
(3,160) |
(14,318) |
(21,418) |
(17,418) |
||
Contingent consideration |
0 |
(895) |
0 |
0 |
0 |
0 |
||
Other long term liabilities |
(2,066) |
(2,968) |
(3,433) |
(3,433) |
(3,433) |
(3,433) |
||
Net Assets |
|
|
30,833 |
46,134 |
56,401 |
87,978 |
156,015 |
170,678 |
CASH FLOW |
||||||||
Operating Cash Flow |
|
|
9,355 |
11,684 |
13,397 |
15,300 |
21,000 |
28,305 |
Net Interest |
(79) |
(266) |
(282) |
(500) |
(750) |
(600) |
||
Tax |
65 |
(337) |
(248) |
(3,630) |
(4,961) |
(5,874) |
||
Capex |
(1,144) |
(2,011) |
(1,762) |
(2,700) |
(2,700) |
(2,650) |
||
Acquisitions/disposals |
(1,443) |
(18,672) |
(12,263) |
(37,100) |
(74,000) |
0 |
||
Financing |
416 |
10,954 |
790 |
25,000 |
58,000 |
0 |
||
Dividends |
(1,632) |
(1,955) |
(2,277) |
(2,553) |
(2,812) |
(3,622) |
||
Net Cash Flow |
5,538 |
(603) |
(2,645) |
(6,183) |
(6,223) |
15,559 |
||
Opening net debt/(cash) |
|
|
(6,308) |
(11,846) |
(11,389) |
(8,673) |
(2,490) |
3,733 |
HP finance leases initiated |
0 |
0 |
0 |
0 |
0 |
0 |
||
Other |
0 |
146 |
(71) |
0 |
0 |
0 |
||
Closing net debt/(cash) |
|
|
(11,846) |
(11,389) |
(8,673) |
(2,490) |
3,733 |
(11,825) |
Source: GB Group (historics), Edison Investment Research (forecasts)
|
|
Research: TMT
TXT reported strong organic revenue growth in Q117, with 14% growth for TXT Retail and 8% growth for TXT Next. Our forecasts are substantially unchanged. TXT continues to internationalise both businesses and we believe it could make further bolt-on acquisitions in the TXT Next business. In Italy, the recently introduced individual savings account scheme (PIR) is driving up demand for TXT’s shares, and in our view this is the main driver of the share price outperformance year-to-date.