Last close As at 05/08/2026
—
— 0.00 (0.00%)
Market capitalisation
—
Research: Investment Companies
Merchants Trust (The)
The Merchants Trust |
High income and dividend growth |
Investment trusts |
9 January 2017 |
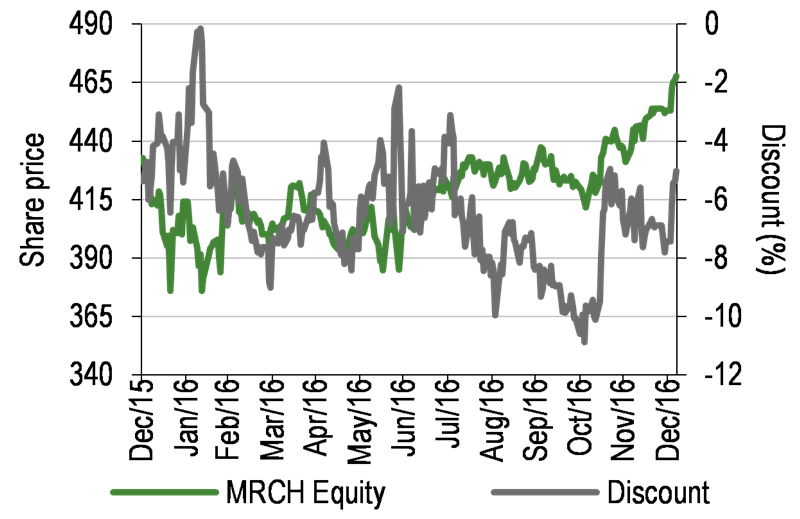
Share price/discount performance
Three-year performance vs index
Gearing
Analysts
|
|||||||||||||||||||||||||||||||||||||||||||||||||||||||||||||||||||||||||||||||||||||
The Merchants Trust (MRCH) invests in a portfolio of primarily large-cap UK equities aiming to generate income and long-term capital growth. MRCH differentiates itself from its peers due to its high income and dividend growth – its dividend yield is consistently above the benchmark FTSE 100 index – and has 34 years of consecutive annual dividend growth. Near-term investment performance has improved; this is partly a function of rising bond yields as investors are starting to rotate away from expensive bond proxies and towards more cyclical, higher-yielding sectors of the UK stock market. MRCH is now outperforming its benchmark over five years. Gearing of up to 25% of net assets is permitted.
12 months ending |
Share price |
NAV |
FTSE 100 |
FTSE All-Share |
31/12/12 |
11.8 |
15.8 |
10.0 |
12.3 |
31/12/13 |
40.3 |
27.4 |
18.7 |
20.8 |
31/12/14 |
(3.5) |
(1.6) |
0.7 |
1.2 |
31/12/15 |
(3.3) |
0.6 |
(1.3) |
1.0 |
31/12/16 |
10.9 |
13.7 |
19.1 |
16.8 |
Source: Thomson Datastream. Note: All % on a total return basis in GBP.
Investment strategy: Income, growth and valuation
Manager Simon Gergel runs a relatively concentrated portfolio of c 40-50 stocks selected for high and growing income with the potential for long-term capital growth. The investment process combines three elements: fundamentals, valuation and themes. MRCH’s portfolio is diversified by sector; currently the largest overweight exposures versus the benchmark are industrials, utilities and consumer services, while the largest underweight exposures are to consumer goods and basic materials. As well as offering a consistently higher dividend yield than the benchmark, MRCH’s compound growth in annual dividends is considerably higher than the growth in UK inflation over the long term (see Exhibit 10, page 7).
Market outlook: Attractive large-cap valuations
Although UK equities have rallied significantly following the post-Brexit vote sell-off, the dividend yield of the FTSE 100 index is in line with the average of the last five years. Large-cap UK equities remain marginally more attractively valued than smaller-caps on a forward P/E multiple basis and they offer a meaningfully higher dividend yield. For investors wishing to gain exposure to UK equities, a fund offering high and growing income with the potential for long-term capital growth may appeal.
Valuation: Discount modestly wider than average
MRCH’s current 5.0% share price discount to cum-income NAV (with debt at market value) is modestly wider than the averages of the last three, five and 10 years (2.9%, 2.3% and 2.0% respectively). There is potential for the discount to narrow if near-term improved investment performance is maintained and as the date for the maturity of the first tranche of MRCH’s high-cost debt in January 2018 approaches. MRCH has a progressive dividend policy; its annual dividend has increased for 34 consecutive years and the current dividend yield is 5.1%.
Exhibit 1: Trust at a glance
Investment objective and fund background |
Recent developments |
|||||||||||||||||||||||||||||||||||||||||||||||||||||||||
The Merchants Trust’s investment objective is to provide an above-average level of income and income growth, together with long-term growth of capital through investing mainly in higher-yielding UK FTSE 100 companies. The benchmark index is the FTSE 100 index. |
■ 29 September 2016: Appointment of Timon Drakesmith as non-executive director, effective 1 November 2016. ■ 16 September 2016: Six-month results ending 31 July 2016. NAV TR +4.9% versus benchmark TR +13.1%. Share price TR +5.3%. Second interim dividend of 6.0p declared. ■ 4 July 2016: First interim dividend of 6.0p declared. |
|||||||||||||||||||||||||||||||||||||||||||||||||||||||||
Forthcoming |
Capital structure |
Fund details |
||||||||||||||||||||||||||||||||||||||||||||||||||||||||
AGM |
May 2017 |
Ongoing charges |
0.58% |
Group |
Allianz Global Investors |
|||||||||||||||||||||||||||||||||||||||||||||||||||||
Final results |
March 2017 |
Net gearing |
19.4% |
Manager |
Simon Gergel |
|||||||||||||||||||||||||||||||||||||||||||||||||||||
Year end |
31 January |
Annual mgmt fee |
0.35% |
Address |
199 Bishopsgate, London, |
|||||||||||||||||||||||||||||||||||||||||||||||||||||
Dividend paid |
Quarterly |
Performance fee |
None |
|||||||||||||||||||||||||||||||||||||||||||||||||||||||
Launch date |
February 1889 |
Trust life |
Indefinite |
Phone |
+ 44 (0)800 389 4696 |
|||||||||||||||||||||||||||||||||||||||||||||||||||||
Continuation vote |
N/A |
Loan facilities |
See page 7 |
Website |
||||||||||||||||||||||||||||||||||||||||||||||||||||||
Dividend policy and history |
Share buyback policy and history (financial years shown) |
|||||||||||||||||||||||||||||||||||||||||||||||||||||||||
Dividends are paid quarterly in August, November, February and May. The annual dividend has increased for 34 consecutive years. |
Renewed annually, the trust has authority to purchase up to 14.99% and allot up to 5% of issued share capital. |
|||||||||||||||||||||||||||||||||||||||||||||||||||||||||
|
|
|||||||||||||||||||||||||||||||||||||||||||||||||||||||||
Shareholder base (as at 7 December 2016) |
Sector breakdown of portfolio (excluding cash, as at 30 November 2016) |
|||||||||||||||||||||||||||||||||||||||||||||||||||||||||
|
|
|||||||||||||||||||||||||||||||||||||||||||||||||||||||||
Top 10 holdings (as at 31 December 2016) |
||||||||||||||||||||||||||||||||||||||||||||||||||||||||||
|
||||||||||||||||||||||||||||||||||||||||||||||||||||||||||
Source: The Merchants Trust, Edison Investment Research, Morningstar, Bloomberg. Note: *N/A where not in December 2015 top 10.
Market outlook: Large-caps relatively attractive
Exhibit 2 (left-hand side) shows the total return and dividend yield of the FTSE 100 index over the last five years. UK share prices have rallied strongly following the post-Brexit vote sell-off and the FTSE 100 index has hit a record high. However, the current dividend yield of the FTSE 100 index is in line with the average of the last five years. As shown in Exhibit 2 (right-hand side), the valuation of UK large-cap companies remains marginally more attractive than for smaller-cap companies on a forward P/E basis and more significantly on a dividend yield basis. For investors looking for exposure to large-cap UK equities, a fund with a long-term record of high and growing income may be of interest.
|
Exhibit 2: Market performance and valuation |
|
FTSE 100 total return and dividend yield (last five years) |
Valuation metrics for FTSE 100, 250 and Small Cap indices |
|
|
|
Source: Thomson Datastream, Edison Investment Research, Bloomberg |
|
Fund profile: High and growing income
Launched in 1889, MRCH is a well-established investment trust. It aims to provide a high and growing level of income and long-term capital growth by investing mainly in higher-yielding, large-cap UK equities. Since April 2006, MRCH has been managed by AllianzGI’s chief investment officer of UK equities, Simon Gergel, who runs a relatively concentrated portfolio of c 40-50 positions. MRCH is currently benchmarked against the FTSE 100 rather than the FTSE All-Share index, although at end-November 2016 c 35% was invested outside the benchmark. Gearing as a percentage of net assets (at the time of drawdown) of 10-25% is permitted. No single investment may exceed 15% of total assets at the time of purchase and individual sector exposure is limited at 35% of the portfolio. MRCH has one of the highest dividend yields in the AIC UK Equity Income sector and has 34 years of consecutive dividend growth – this has continued through many economic cycles including the global financial crisis; when necessary, reserves have been used to ensure consistent annual dividend growth.
The fund manager: Simon Gergel
The manager’s view: Attractive investment opportunities
Manager Simon Gergel comments that the FTSE 100 is outperforming mid-cap stocks for the first time in many years. There has been strong performance from mega-cap companies such as HSBC, BP and Royal Dutch Shell, where MRCH has greater exposure than most of its peers, although it does have c 35% of the portfolio outside the benchmark. MRCH’s near-term performance has also benefited from higher bond yields – in H116, the high value of its debt was a drag as bond yields fell; however, the value of MRCH’s debt has fallen with higher bond yields. Gearing has also enhanced investment returns as the UK market has rallied significantly in recent months.
The manager highlights three areas of the UK stock market that he considers particularly interesting on a valuation basis: mega-caps, telecoms/utilities and recovery stocks. Despite recent upward stock price moves, the manager suggests that some mega-cap companies still offer good value, such as BP, HSBC and Royal Dutch Shell. They have dividend yields of c 6% and Gergel has more confidence in their ability to continue to pay high dividends. A recent addition to the portfolio is BT, where the manager took advantage of a pullback in the share price to repurchase a position; an 8% free cash flow yield is viewed as attractive. Although there have been concerns about the competitive environment, the manager believes that the acquisition of EE ensures that BT has the leading mobile and fixed network and the deal offers the opportunity for major cost savings. In addition, higher bond yields are reducing the size of BT’s significant defined benefit pension deficit. Within utilities, exposure has been added to National Grid; its regulated earnings are protected by an inflation linkage rather than having an allowed fixed rate of return.
With regard to recovery stocks, investors had been paying high multiples for stocks with perceived earnings certainty, such as consumer staples and undervaluing many companies where the earnings outlook is depressed or uncertain. Gergel suggests that this trend appears to be turning as value stocks are recovering and quality growth/momentum stocks are starting to struggle. He highlights Marks & Spencer, where its food business is delivering robust results and the company is generating strong cash flow. However, investors do not have high confidence in management’s ability to turn the clothing operations around. The manager suggests that the company’s CEO is making the right decisions, although it will take time for any turnaround to become apparent.
The UK construction industry has suffered a multi-year decline, but there are now indications of higher construction and infrastructure spending. A white paper on the housing sector is due to be published in January 2017, which should lead to higher activity in the sector. In addition, there are major projects underway such as the Hinkley Point nuclear facility, expansion of Heathrow Airport, the High Speed 2 railway and higher spending on highways.
Asset allocation
Investment process: Disciplined stock selection
Manager Simon Gergel aims to generate high and growing income and long-term capital growth from a relatively concentrated portfolio of primarily large-cap UK equities. Stocks are selected based on an investment process that is a blend of three elements: fundamentals, valuation and themes. Fundamental analysis is undertaken to determine industry dynamics and a company’s competitive position, financial considerations focus on cash flow strength as a key driver of performance and the potential for dividends, and a company’s corporate governance record is assessed. When considering a company’s valuation the manager focuses on both absolute measures and relative to its history/the overall stock market as well as dividend yield. A focus on themes takes the macroeconomic environment into account, as well as the stage of the business cycle and any industry-specific or secular issues. Positions may be sold if target prices are achieved, if there is a company/industry change so that the original buy thesis is put into question, or if a better investment opportunity has been identified; a holding is not automatically sold if its dividend yield falls below a certain level. Gergel is able to draw on extensive analyst resources at AllianzGI, which includes GrassrootsSM, a proprietary market research network.
Current portfolio positioning
At end-December 2016, MRCH’s top 10 positions comprised 46.9% of the portfolio. This was a modest increase in concentration from 44.0% at end-December 2015; eight holdings were common to both periods. Exhibit 3 shows that over the last 12 months to end-November 2016 there has been a small decrease in exposure to benchmark FTSE 100 stocks, with investment increased in mid- and small-cap companies. The majority of revenue from portfolio companies is generated overseas, such as oil and pharmaceutical companies, which have significant sales in US dollars. In periods of sterling weakness, companies with global operations, which do not hedge their currency exposure, generate higher profits, enhancing their ability to pay or increase their dividends.
Exhibit 3: Market capitalisation breakdown (%)
Index |
Portfolio end-November 2016 |
Portfolio end-November 2015 |
Change (pp) |
FTSE 100 |
62.8 |
66.1 |
-3.3 |
FTSE 250 |
30.1 |
27.4 |
2.7 |
FTSE Smaller Companies |
5.0 |
3.9 |
1.1 |
FTSE AIM |
0.7 |
1.3 |
-0.6 |
Cash |
1.4 |
1.3 |
0.1 |
100.0 |
100.0 |
Source: The Merchants Trust, Edison Investment Research
Exhibit 4 shows MRCH’s exposure by sector. Over the last 12 months the largest increase in exposure has been oil and gas, while the largest decreases have been consumer services, which remains an overweight position, and consumer goods, where MRCH is significantly underweight versus the benchmark as the manager considers the companies expensive. The largest overweight sector is industrials; holdings include aerospace components company Senior, which is benefiting from Airbus and Boeing ramping up their production schedules. Senior also sells into some cyclically depressed industries such as oil and gas and trucking, which have recovery potential. The manager considers that given the growth in the aerospace industry, it is an attractive time to buy shares in Senior and he believes that the company should be in a position to grow its dividend.
Exhibit 4: Portfolio sector exposure vs benchmark (% unless stated)
Portfolio end- November 2016 |
Portfolio end- November 2015 |
Change (pp) |
Index weight |
Active weight vs index (pp) |
Trust weight/ index weight (x) |
|
Financials |
26.3 |
26.3 |
0.0 |
22.0 |
4.3 |
1.2 |
Consumer services |
15.5 |
17.6 |
-2.1 |
10.5 |
5.0 |
1.5 |
Industrials |
14.1 |
13.4 |
0.7 |
7.6 |
6.5 |
1.9 |
Oil & gas |
13.5 |
11.5 |
2.0 |
14.8 |
-1.3 |
0.9 |
Utilities |
9.7 |
9.9 |
-0.2 |
4.2 |
5.5 |
2.3 |
Healthcare |
6.8 |
6.8 |
0.0 |
10.7 |
-3.9 |
0.6 |
Consumer goods |
5.4 |
7.4 |
-2.0 |
16.7 |
-11.3 |
0.3 |
Telecommunications |
4.1 |
3.3 |
0.8 |
4.8 |
-0.7 |
0.9 |
Basic materials |
3.2 |
2.5 |
0.7 |
8.2 |
-5.0 |
0.4 |
Technology |
0.0 |
0.0 |
0.0 |
0.7 |
-0.7 |
0.0 |
Cash |
1.4 |
1.3 |
0.1 |
0.0 |
1.4 |
N/A |
100.0 |
100.0 |
100.0 |
Source: The Merchants Trust, Edison Investment Research, FTSE Russell
Performance: Improved near-term relative performance
|
Exhibit 5: Investment trust performance to 31 December 2016 |
|
Price, NAV and benchmark total return performance, one-year rebased |
Price, NAV and benchmark total return performance (%) |
|
|
|
Source: Thomson Datastream, Edison Investment Research. Note: Three-, five- and 10-year performance figures annualised. |
|
Exhibit 5 (right-hand side) shows the absolute performance of MRCH’s share price, NAV and the benchmark over both the short and long term, while Exhibit 6 highlights MRCH’s performance versus the benchmark FTSE 100 and FTSE All-Share indices. Better relative performance over three and six months has led to higher relative performance over one, three and five years compared to our last review, which was published in July 2016. MRCH’s share price and NAV total returns are now both outperforming the benchmark over five years.
|
Exhibit 6: Share price and NAV total return performance, relative to indices (%) |
||||||||
|
One month |
Three months |
Six months |
One year |
Three years |
Five years |
10 years |
|
Price relative to FTSE 100 |
(1.6) |
3.0 |
3.6 |
(6.8) |
(12.5) |
5.1 |
(6.8) |
|
NAV relative to FTSE 100 |
(0.4) |
1.2 |
4.0 |
(4.6) |
(4.9) |
7.5 |
(7.9) |
|
Price relative to FTSE All-Share |
(1.3) |
3.4 |
3.3 |
(5.0) |
(13.2) |
0.3 |
(9.6) |
|
NAV relative to FTSE All-Share |
(0.1) |
1.6 |
3.8 |
(2.7) |
(5.7) |
2.6 |
(10.6) |
|
|
Source: Thomson Datastream, Edison Investment Research. Note: Data to end-December 2016. Geometric calculation. |
||||||||
|
Exhibit 7: NAV total return performance relative to benchmark over five years |
||||||||
|
||||||||
|
Source: Thomson Datastream, Edison Investment Research |
||||||||
Discount: Modestly wider than historical averages
MRCH’s current 5.0% share price discount to cum-income NAV with debt at market value is narrower than the 6.5% average of the last year. Over the last year, the discount has been in a range of 0.2% to 10.9%; the widest discount was on 3 November 2016, a period of heightened investor risk aversion ahead of the US presidential election. The current discount is modestly wider than the averages of the last three, five and 10 years (range of 2.0% to 2.9%).
|
Exhibit 8: Three-year discount to NAV (debt at par or book value) |
Exhibit 9: Three-year cum-income discount (debt at fair or market value) |
|
|
|
Source: Thomson Datastream, Edison Investment Research |
|
Exhibit 8: Three-year discount to NAV (debt at par or book value) |
|
|
Source: Thomson Datastream, Edison Investment Research |
|
Exhibit 9: Three-year cum-income discount (debt at fair or market value) |
|
|
Source: Thomson Datastream, Edison Investment Research |
While interest rates have started to rise, they remain historically low. This means that the market value of MRCH’s debt is higher than its par value (and thus the value of the NAV with debt at par value is higher than the value of the NAV with debt at market value), so the share price discount to NAV with debt at market value is narrower than the discount to NAV with debt at par value.
Capital structure and fees
MRCH is a conventional investment trust with one class of share; there are currently 108.7m ordinary shares in issue. At the end of FY16 (January 2016), MRCH held £110m book value of debt with an average maturity of seven years and an average interest charge of 8.5%. Interest costs are split 35:65 between the revenue and capital account. The first tranche of MRCH’s high-cost debt is getting closer to maturity – the £34m 11.125% debenture is repayable in January 2018. The board regularly considers options for the debt position; if it was refinanced at the current level of interest rates, the manager estimates it would add 3-4% to earnings per share.
In FY16, the annual management fee was 0.35% of net assets, which was in line with the previous year, and the ongoing charge was 0.58% versus 0.62% in FY15. This is in line with the average of the larger investment trusts in the AIC UK Equity Income sector, but much lower than average when compared to all of the peers in the sector.
Dividend policy and record
MRCH has a progressive dividend policy; annual dividends have increased for 34 consecutive years. Exhibit 10 (left-hand side) shows that over the last 20 years, MRCH’s dividend yield has consistently exceeded that of the FTSE 100 index. The right-hand chart illustrates that since the 1980s, MRCH’s annual dividend has compounded at an annual rate of 7.6% versus an average 3.6% annual RPI inflation rate.
|
Exhibit 10: MRCH’s dividend yield and growth (%) |
|
Merchants Trust’s dividend yield vs FTSE 100 dividend yield |
Growth of Merchants Trust’s dividend vs UK inflation |
|
|
|
Source: Thomson Datastream, The Merchants Trust, Edison Investment Research |
|
Dividends are paid quarterly in August, November, February and May. The 24.0p dividend in FY16 was 0.8% higher than the prior year; it was fully covered by revenue. Revenue reserves of £27.2m at end-H117 (July 2016) were 4.2% higher than the FY16 annual dividend payment. As shown in the following section, MRCH’s current dividend yield compares favourably with the peer group.
Peer group comparison
MRCH is one of 23 investment trusts in the AIC UK Equity Income sector; Exhibit 11 shows the largest funds with market caps above £400m. MRCH is the only trust benchmarked against the FTSE 100 index rather than the FTSE All-Share index. Its near-term performance versus the peers is improving as bond yields have started to rise, as MRCH has low exposure to bond proxies and higher bond yields are reducing the value of MRCH’s debt. MRCH’s NAV total return is significantly above the selected and sector peer group average over one year, ranking seventh out of 23 trusts; however, it lags the averages over three, five and 10 years. In terms of risk-adjusted returns as measured by the Sharpe ratio, MRCH is above the average over one year, reflecting its improved near-term performance, and is in line over three years. Its discount is one of the widest in the sector, perhaps as a result of its high level of gearing, ranking 19th out of 23 trusts. MRCH’s ongoing charge is in line with the selected average, and in common with most trusts in the sector, no performance fee is payable. MRCH has a significantly higher dividend yield than the sector average; its yield of 5.3% is 1.2pp higher, and 1.6pp higher than the largest trusts in the sector. This may be an important consideration for investors in an environment where asset yields remain low.
Exhibit 11: AIC UK Equity Income peer group (market cap above £400m) at 2 January 2017
% unless stated |
Market cap £m |
NAV TR 1 Year |
NAV TR 3 Year |
NAV TR 5 Year |
NAV TR 10 Year |
Sharpe 1y (NAV) |
Sharpe 3y (NAV) |
Discount (ex-par) |
Ongoing charge |
Perf. fee |
Net gearing |
Dividend yield (%) |
Merchants Trust |
492.7 |
13.6 |
13.0 |
66.0 |
51.4 |
(0.2) |
(0.2) |
(9.8) |
0.6 |
No |
119 |
5.3 |
City of London |
1,366.1 |
10.4 |
22.7 |
77.5 |
86.6 |
(0.4) |
(0.1) |
0.8 |
0.4 |
No |
107 |
3.9 |
Edinburgh Investment trust |
1,401.0 |
6.8 |
35.4 |
86.8 |
107.1 |
(0.6) |
0.1 |
(3.1) |
0.6 |
No |
117 |
3.4 |
Finsbury Growth & Income |
967.1 |
12.8 |
34.6 |
83.3 |
168.3 |
(0.3) |
0.0 |
0.8 |
0.7 |
No |
103 |
2.0 |
Murray Income Trust |
485.2 |
15.8 |
17.3 |
59.4 |
64.3 |
(0.1) |
(0.2) |
(9.8) |
0.8 |
No |
109 |
4.5 |
Perpetual Income & Growth |
887.0 |
1.8 |
20.0 |
89.7 |
116.4 |
(0.8) |
(0.2) |
(7.8) |
0.7 |
Yes |
116 |
3.5 |
Temple Bar |
817.9 |
20.7 |
17.5 |
81.5 |
112.3 |
0.1 |
(0.2) |
(5.9) |
0.5 |
No |
103 |
3.3 |
Selected stock average |
916.7 |
11.7 |
22.9 |
77.7 |
100.9 |
(0.3) |
(0.1) |
(5.0) |
0.6 |
111 |
3.7 |
|
Sector average (23 peers) |
403.0 |
8.3 |
20.8 |
82.7 |
72.1 |
(0.5) |
(0.2) |
(1.7) |
1.0 |
113 |
4.1 |
|
MRCH rank (out of 23 peers) |
6 |
7 |
20 |
18 |
17 |
6 |
17 |
19 |
21 |
4 |
4 |
Source: Morningstar, Edison Investment Research. Note: TR=total return. Sharpe ratio is a measure of risk-adjusted return. The ratios shown are calculated by Morningstar for the past 12- and 36-month periods by dividing a fund’s annualised excess returns over the risk-free rate by its annualised standard deviation. Net gearing is total assets less cash and equivalents as a percentage of net assets.
The board
There are six members of the board at MRCH; all are non-executive and independent of the manager. Chairman Simon Fraser was appointed in 2009 and elected to his current position in 2010. The other directors and their dates of appointment are senior independent director Mike McKeon (2008), Paul Yates (2011) and Mary Ann Sieghart and Sybella Stanley (2014). On 29 September 2016 the board announced the appointment of Timon Drakesmith with effect from 1 November 2016. He will be chair of the audit committee and is the CFO at Hammerson, a UK REIT, which is a member of the FTSE 100 index.
|
|
Research: Investment Companies
Fidelity European Values