Last close As at 05/08/2026
—
— 0.00 (0.00%)
Market capitalisation
—
Research: Industrials
Cohort has delivered better than-expected operating profit growth in FY18 as it continues to address the changing dynamics of its end markets. The company believes that the decline in the order book represents delays rather than a reduction in demand and, if this is the case, 2018/19 presents exciting business prospects. Cohort continues to invest and address new business areas while further acquisition presents an opportunity.
Written by
Cohort |
Marching on |
FY18 results |
Aerospace & defence |
3 July 2018 |
Share price performance
Business description
Next events
Analysts
Cohort is a research client of Edison Investment Research Limited |
|||||||||||||||||||||||||||||||||||||||||||||||
Cohort has delivered better than-expected operating profit growth in FY18 as it continues to address the changing dynamics of its end markets. The company believes that the decline in the order book represents delays rather than a reduction in demand and, if this is the case, 2018/19 presents exciting business prospects. Cohort continues to invest and address new business areas while further acquisition presents an opportunity.
Year end |
Revenue (£m) |
PBT* |
EPS* |
DPS |
P/E |
Yield |
04/17 |
112.7 |
14.5 |
26.6 |
7.1 |
13.7 |
1.9 |
04/18 |
111.8 |
15.5 |
29.4 |
8.2 |
12.4 |
2.2 |
04/19e |
118.4 |
16.0 |
31.2 |
9.2 |
11.7 |
2.5 |
04/20e |
124.8 |
17.0 |
33.2 |
10.1 |
11.0 |
2.8 |
Note: *PBT and EPS are normalised, excluding amortisation of acquired intangibles, exceptional items, share-based payments and one-off tax credits.
FY18 demonstrated performance improvement
FY18 reported a closing order book of £102.5m, down from the H118 report of £132.1m and FY17 £136.5m. The company cited delays for the lower order intake in the year. However, FY19 has a larger than normal concentration of opportunities, as expected orders have been delayed. Reported FY18 revenues were £111.8m (FY17: £112.7m), with all divisions reporting growth except for SEA, which is to undergo cost restructuring in FY19. Encouragingly, reported adjusted operating profit was £15.6m (FY17: £14.5m) up 8% with reported adjusted EPS (excluding one-off tax credits) up 10% at 29.4p (FY17: 26.6p). FY18 DPS was 8.2p (FY17: 7.1p), a 15.5% increase in line with the group’s progressive dividend policy. Net cash of £11.3m (FY17 £8.5m) was up from £5.7m at the half year, where a net cash flow had been expected on higher operating profit contribution.
Growth beyond within and across borders
While a UK defence review is in process, the overall pace of contracting at the MOD has yet to show any major signs of improvement. However, Cohort has been able to identify and serve new business areas. At the moment this is reflected in shorter-term contracts; however, the company is excited by the opportunities that 2018/19 presents both in the UK and export markets. Indeed, there appears to be a growing consensus that an increase in UK defence spending may be warranted, not just by the shortages in frontline and administrative personnel, but also because of varying and often resurgent threats. Cohort remains comparatively robust with the financial fire power to invest in its own businesses and pursue acquisitions.
Valuation: Premium to peers deserved
The average of our DCF and peer group SOP valuation approaches generates a fair value of 549p, an increase on our prior fair value of 508p. This fair value gives a 2019e P/E of 16.5x. Although Cohort is developing in line with expectations, it continues to trade on a FY19e P/E discount to its UK defence peers. In our view, such a discount to its peers is not warranted.
FY18 results
The salient features of the interim results are as follows:
■
Reported closing order book of £102.5m was down from the H118 report of £132.1m and FY17 £136.5m. The company cited delays for the lower order intake in the year. However, FY19 has a larger than normal concentration of opportunities, as the contracts expected in FY18 are pushed out into FY19.
■
Reported revenues were £111.8m (FY17: £112.7m).
■
Reported adjusted operating profit was £15.6m (FY17: £14.5m).
■
Reported adjusted EPS was 30.00p (FY17: 27.93p) including one-off tax credits.
■
Reported DPS was 8.2p (FY17: 7.1p), a 15.5% increase in line with the group’s progressive dividend policy.
■
Net cash of £11.3m (FY17 £8.5m) was up from £5.7m at the half year, where a net cash flow had been expected on higher operating profit contribution. Within the year the company paid £2.5m as the final payment on MCL and £3.5m on the 23% EID acquisition.
Exhibit 1: H1 and FY divisional analysis
April year end (£m) |
H117 |
H217 |
FY17 |
H118 |
H218 |
FY18 |
FY % change |
Order intake |
|||||||
MASS |
32 |
29.1 |
(9.1)% |
||||
SCS* |
3 |
||||||
SEA |
31.4 |
27 |
(14.0)% |
||||
MCL |
23.3 |
12.1 |
(48.1)% |
||||
EID |
18.9 |
8.4 |
(55.6)% |
||||
Total order intake |
108.6 |
76.6 |
-29.5% |
||||
Order book |
|||||||
MASS |
49.4 |
42.6 |
40.9 |
(17.2)% |
|||
SCS* |
|||||||
SEA |
44 |
41.4 |
33.1 |
(24.8)% |
|||
MCL |
15.5 |
18.4 |
10.3 |
(33.5)% |
|||
EID |
27.6 |
29.7 |
18.2 |
(34.1)% |
|||
Total order book |
136.5 |
132.1 |
102.5 |
(24.9)% |
|||
Revenue |
|||||||
MASS |
14.5 |
18 |
32.5 |
17.2 |
20.3 |
37.5 |
15.4% |
SCS* |
5 |
0 |
5 |
0 |
|||
SEA |
18 |
26.4 |
44.4 |
15.7 |
22.1 |
37.8 |
(14.9)% |
MCL |
7.9 |
6.9 |
14.8 |
5.1 |
12.3 |
17.4 |
17.6% |
EID |
4.6 |
11.4 |
16 |
6.8 |
12.3 |
19.1 |
19.4% |
Total revenue |
50 |
62.7 |
112.7 |
44.8 |
67 |
111.8 |
-0.8% |
Adjusted operating profit |
|||||||
MASS |
2.4 |
3.5 |
5.9 |
2.549 |
4.551 |
7.1 |
20.2% |
SCS* |
-0.5 |
0.0 |
-0.5 |
||||
SEA |
1.0 |
4.3 |
5.3 |
1.0 |
3.4 |
4.4 |
-16.9% |
MCL |
0.8 |
1.3 |
2.1 |
0.2 |
1.9 |
2.1 |
2.3% |
EID |
1.4 |
2.8 |
4.2 |
1.2 |
3.5 |
4.7 |
11.0% |
HQ & Other |
(1.3) |
(1.2) |
(2.5) |
(1.3) |
(1.4) |
(2.7) |
5.8% |
Total adjusted operating profit |
3.9 |
2.8 |
14.5 |
3.6 |
7.4 |
15.6 |
7.7% |
Operating profit |
(3.2) |
4.2 |
1.0 |
0.8 |
9.2 |
10.0 |
|
Finance costs |
0.0 |
0.0 |
0.0 |
0.0 |
(0.1) |
(0.1) |
|
Profit before tax |
(3.2) |
4.2 |
1.0 |
0.8 |
9.1 |
9.9 |
|
Tax expense |
0.6 |
0.6 |
1.1 |
(0.1) |
(1.3) |
(1.4) |
|
Net income |
(2.7) |
4.8 |
2.1 |
0.6 |
7.8 |
8.5 |
|
EPS (p) reported |
6.0 |
3.1 |
9.1 |
6.3 |
13.6 |
19.9 |
118.6% |
DPS (p) |
2.2 |
4.9 |
7.1 |
2.55 |
5.65 |
8.2 |
15.5% |
Net cash |
8.5 |
8.5 |
5.7 |
11.3 |
32.9% |
Source: Company reports. Note: *SCS business was restructured into MASS and SEA in December 2016.
|
Exhibit 2: FY18 defence and security revenue by market segment |
Exhibit 3: FY18 defence and security revenue by end customer |
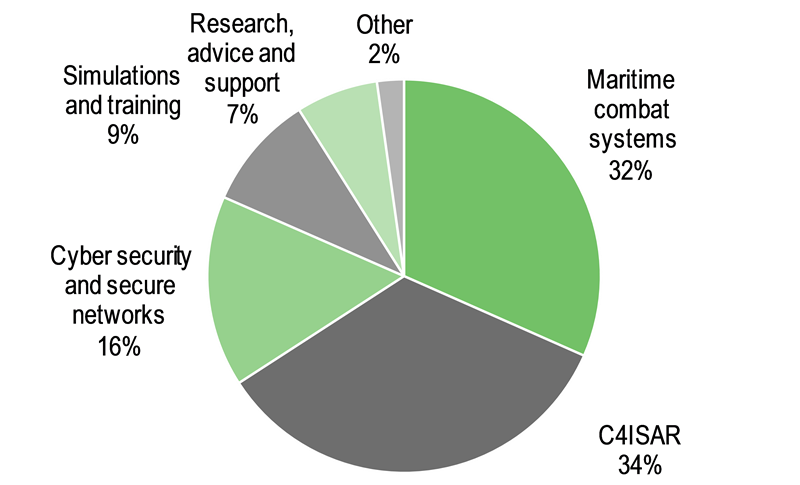
|
|
|
Source: Company reports |
|
Exhibit 2: FY18 defence and security revenue by market segment |
|
|
Source: Company reports |
|
Exhibit 3: FY18 defence and security revenue by end customer |
|
|
Source: Company reports |
MASS (FY18 sales: £37.5m; 34% of group sales) returned to growth. A key input was the completion of the biennial joint forces exercise, driving topline and margin. The division started deliveries to the Metropolitan Police Service for the Digital Forensics Programme, secured at the end of FY17. Lower electronic warfare operational support activity was countered by higher training support (ex SCS) and cyber volumes to increase the division operating margin.
SEA (FY18 sales: £37.8m; 34% of group sales) delivered a lower top-line result, as seen in the H118 report. The higher adjusted operating margin, up from 11.1% in FY16 reflects the higher export content and a trend towards more product sales. There is a natural lull between the completed design work on the Astute Class and the increased activity on Dreadnought Class, expected to last 18-24 months. To put this in context, the submarine revenue contribution was £21.1m in FY16 and just £7.3m in FY18. While the company is taking costs out of this area, it should be noted how successful the division has been to counter this decline with other business areas, including increased export sales of torpedo launch systems. In addition, the submarine communications programme has been considerably derisked and has allowed some contingency to be released. This division is also balancing the longer term contracts and the predictability that brings, with shorter term contracts within its simulation, support and product activity. While the ROADflow product range has seen growth, it experienced tough comparisons in H218 given the prior year peak. Given the reduced research and submarine activity, the business will face restructuring during FY19 at an anticipated cost of £0.5m, targeting annual savings of £1.0m per year.
EID (FY18 £19.1m; 17% of group sales) performance exceeded group expectations, with a higher naval contribution at 60% of the division, up from 30% last year. This is expected to move back in FY19 with lower naval support work and higher intercom and radio products. The company notes that the higher bought in element will bring the division’s expected operating margin levels close to 20%. Within the year, Cohort acquired an additional 23% of EID, taking the total holding to 80% as expected, enhancing future EPS.
MCL (FY18 sales £17.4m; 17% of group sales) delivered a flat performance, with increased volume and margin offset by slightly higher overheads. The company won a further £6m contract for hearing protection systems, building on the success of the business to date. Overall, MCL is moving to shorter-term order book visibility, of around three to six months on average.
Outlook
The current review and tightening of spending at the UK MOD is likely to have an ongoing impact on FY19 and beyond. However Cohort continues to broaden its exposure to different programmes and project areas. While the current order book stands at a lower level year-on-year, the company stresses this is due to contract delays rather than lack of demand. Outside the UK, Portugal is seeing a relatively robust level of spending with upgrades to maritime and land communication systems, from which EID should benefit. In addition, the company is well placed to leverage the growing requirement for defence and counter terrorism capability around the globe.
While FY18 order progression reflected delays, Cohort’s order book progression shows additional strength overall. Exhibit 4 gives a picture of the visibility of the order book across the divisions. Part of the strategy has been to stabilise and build visibility. Cohort’s delivery schedule does stretch out to 2025; however, order cover is typically in the range of 55-65% at the start of any given year. Cohort can also operate with an increasing level of shorter-term contracts, which can be supportive at the operating margin level but may not be visible in order book charts.
|
Exhibit 4: Delivery of the group’s order book into revenue |
|
|
Source: Company reports |
The company expects net cash to remain flat on FY18, as working capital is expected to rise to support contract work. However, beyond that the company expects cash contribution in FY20 to be strong, as the working capital unwinds. The group continues to be agile and will consider further suitable acquisitions.
Valuation
We continue to derive a fair value for Cohort from the simple average of a capped DCF and a peer-based group SOP. Our DCF approach generates a value of 550p (previous 529p) while our peer group SOP generates a value of 548p (previous 460p). This gives an average of 549p, an increase on our prior fair value of 508p. This reflects the uplift from moving our DCF on by one year but also, more significantly, the improvement in value of the peer group. This fair value gives a 2019e P/E of 16.5x. Although Cohort continues to develop in line with expectations, it continues to trade on a FY19e P/E discount to its UK defence peers. In our view, such a large discount is not warranted.
Exhibit 5: Peer group valuation sheet
Fiscal year end |
Market Cap |
Share Price |
FX |
FY1 PE |
FY2 PE |
FY1 EV/EBITDA |
FY2 EV/EBITDA |
FY1 EV/Sales |
FY2 EV/Sales |
FY1 Div Yield |
FY2 Div Yield |
||
COHORT PLC |
CHRT LN |
04/2018 |
149.5 |
365.0 |
GBP |
11.7X |
11.2X |
8.6X |
8.1X |
1.21X |
1.22X |
2.5% |
2.7% |
BAE SYSTEMS PLC |
BA/ LN |
12/2017 |
20,437.1 |
640 |
GBP |
14.7X |
13.6X |
9.6X |
9.1X |
1.15X |
1.11X |
3.5% |
3.6% |
CHEMRING GROUP |
CHG LN |
10/2017 |
636.7 |
227.5 |
GBP |
17.8X |
16.1X |
9.0X |
8.5X |
1.43X |
1.45X |
1.4% |
1.6% |
COBHAM PLC |
COB LN |
12/2017 |
3,067.7 |
128.3 |
GBP |
27.3X |
19.4X |
12.3X |
11.2X |
1.83X |
1.80X |
0.5% |
1.7% |
MEGGITT PLC |
MGGT LN |
12/2017 |
4,070.3 |
524.2 |
GBP |
16.3X |
15.2X |
11.3X |
10.5X |
2.56X |
2.44X |
3.1% |
3.3% |
QINETIQ GROUP PLC |
QQ/ LN |
03/2018 |
1,535.5 |
270.4 |
GBP |
15.8X |
15.5X |
8.6X |
8.2X |
1.51X |
1.48X |
2.4% |
2.6% |
ROLLS-ROYCE |
RR/ LN |
12/2017 |
18,228.4 |
975 |
GBP |
65.4X |
35.6X |
13.9X |
10.7X |
1.25X |
1.20X |
1.3% |
1.5% |
ULTRA ELECTRONICS |
ULE LN |
12/2017 |
1,195.7 |
1611.000 |
GBP |
14.7X |
13.2X |
10.1X |
9.4X |
1.70X |
1.59X |
3.1% |
3.2% |
Uk Average |
24.6X |
18.4X |
10.7X |
9.6X |
1.6X |
1.6X |
2.2% |
2.5% |
|||||
AIRBUS SE |
AIR FP |
12/2017 |
75,810.6 |
97.7 |
EUR |
21.8X |
17.6X |
8.6X |
7.3X |
1.02X |
0.92X |
1.8% |
2.1% |
FACC AG |
FACC AV |
02/2018 |
751.9 |
16.4 |
EUR |
19.0X |
15.4X |
9.7X |
8.4X |
1.17X |
1.06X |
1.5% |
2.1% |
LATECOERE |
LAT FP |
12/2017 |
429.7 |
4.5 |
EUR |
27.5X |
14.7X |
10.6X |
6.7X |
0.63X |
0.61X |
0.0% |
0.7% |
LEONARDO SPA |
LDO IM |
12/2017 |
4,838.0 |
8.4 |
EUR |
10.7X |
8.5X |
5.4X |
5.0X |
0.73X |
0.70X |
1.7% |
1.9% |
MTU AERO ENGINES AG |
MTX GR |
12/2017 |
8,382.4 |
161.2 |
EUR |
19.9X |
18.5X |
12.1X |
11.4X |
2.31X |
2.00X |
1.7% |
1.9% |
RHEINMETALL AG |
RHM GR |
12/2017 |
4,029.2 |
92.5 |
EUR |
14.6X |
12.6X |
5.9X |
5.3X |
0.65X |
0.60X |
2.1% |
2.4% |
SAAB AB-B |
SAABB SS |
12/2017 |
40,047.3 |
366.9 |
SEK |
21.4X |
17.2X |
12.2X |
10.1X |
1.27X |
1.17X |
1.7% |
1.9% |
SAFRAN SA |
SAF FP |
12/2017 |
45,388.5 |
102.3 |
EUR |
22.8X |
19.0X |
12.3X |
10.6X |
2.18X |
1.99X |
1.7% |
2.1% |
THALES SA |
HO FP |
12/2017 |
23,196.7 |
109.0 |
EUR |
20.7X |
17.3X |
9.8X |
8.6X |
1.29X |
1.13X |
1.8% |
2.2% |
19.8X |
15.6X |
9.6X |
8.2X |
1.3X |
1.1X |
1.6% |
1.9% |
Source: Bloomberg. Note: Priced at close 2 July 2018
Financials
While revenues were below expectations, margins have continued to deliver the operating performance expected. SEA is likely to improve profitability in the current year, with the £0.5m charge for restructuring being taken as an exceptional cost, with MASS and MCL continuing to grow and EID performing well despite some margin reduction. Overall our EBIT expectation is essentially unchanged.
In FY19 the company expects to invest in working capital in the current year. As a result, our pre-tax profit declines by 0.3% and with a slightly higher weighted average number of shares than we had anticipated our EPS stays flat against our previous forecast. It should be noted that the one-off tax credits (FY18 0.6p) in each of the last three years are not expected to continue.
We introduce our FY20 estimates, which show accelerating earnings performance and a significantly improved cash flow following the FY19 investment.
Exhibit 6: Revisions
Year to April (£m) |
2018e |
2018 |
|
2019e |
2019e |
|
2020e |
|
Prior |
Actual |
% change |
Prior |
New |
% change |
New |
Revenues |
|||||||
MASS |
39.0 |
37.6 |
-3.8% |
41.4 |
39.8 |
-3.8% |
42.2 |
SEA |
43.0 |
37.8 |
-12.0% |
46.4 |
38.2 |
-17.7% |
40.1 |
MCL |
17.4 |
17.4 |
-0.2% |
19.7 |
19.7 |
-0.2% |
20.9 |
EID |
19.5 |
19.1 |
-2.4% |
20.7 |
20.8 |
0.4% |
21.6 |
Total Group |
119.0 |
111.8 |
-6.0% |
128.2 |
118.4 |
-7.6% |
124.8 |
|
|
|
|
|
|
|
|
EBITDA |
16.6 |
16.7 |
0.4% |
17.4 |
17.2 |
-1.0% |
18.3 |
|
|
|
|
|
|
|
|
MASS |
7.0 |
7.1 |
1.2% |
7.4 |
7.6 |
2.1% |
8.0 |
SEA |
5.2 |
4.4 |
-14.0% |
5.4 |
4.6 |
-15.6% |
4.8 |
MCL |
2.1 |
2.1 |
-0.9% |
2.4 |
2.4 |
0.6% |
2.5 |
EID |
3.9 |
4.7 |
19.6% |
3.7 |
4.4 |
17.1% |
4.5 |
HQ Other and intersegment |
-2.8 |
-2.7 |
-3.6% |
-2.9 |
-2.8 |
-3.5% |
-2.8 |
EBIT (Pre PPA amortisation) |
15.4 |
15.6 |
1.4% |
16.0 |
16.1 |
0.4% |
17.1 |
|
|
|
|
|
|
|
|
Underlying PTP |
15.4 |
15.5 |
0.8% |
16.1 |
16.0 |
-0.3% |
17.0 |
|
|
|
|
|
|
|
|
EPS - underlying continuing (p)* |
29.1 |
30.0 |
3.0% |
31.2 |
31.2 |
0.0% |
33.2 |
DPS (p) |
8.2 |
8.2 |
0.0% |
9.0 |
9.2 |
2.2% |
10.1 |
Net cash / (debt) |
9.7 |
11.3 |
16.9% |
17.3 |
11.9 |
-30.1% |
24.7 |
Source: Company reports, Edison Investment Research estimates. Note: *EPS includes one-off tax credit in FY18.
Exhibit 7: Financial summary
£m |
2016 |
2017 |
2018 |
2019e |
2020e |
|||||||||||
Year end 30 April |
IFRS |
IFRS |
IFRS |
IFRS |
IFRS |
|||||||||||
PROFIT & LOSS |
||||||||||||||||
Revenue |
|
|
112.6 |
112.7 |
111.8 |
118.4 |
124.8 |
|||||||||
Cost of Sales |
(79.1) |
(73.7) |
(72.4) |
(76.7) |
(80.8) |
|||||||||||
Gross Profit |
33.5 |
39.0 |
39.4 |
41.7 |
44.0 |
|||||||||||
EBITDA |
|
|
13.0 |
15.7 |
16.7 |
17.3 |
18.3 |
|||||||||
Operating Profit (before amort. and except). |
11.9 |
14.5 |
15.6 |
16.1 |
17.1 |
|||||||||||
Intangible Amortisation |
(6.4) |
(11.3) |
(5.3) |
(4.7) |
(0.3) |
|||||||||||
Exceptionals |
(0.3) |
(2.3) |
(0.3) |
(0.5) |
0.0 |
|||||||||||
Other |
0.0 |
0.0 |
0.0 |
0.0 |
0.0 |
|||||||||||
Operating Profit |
5.2 |
1.0 |
10.0 |
11.0 |
16.8 |
|||||||||||
Net Interest |
0.1 |
0.0 |
(0.1) |
(0.1) |
(0.1) |
|||||||||||
Profit Before Tax (norm) |
|
|
12.0 |
14.5 |
15.5 |
16.0 |
17.0 |
|||||||||
Profit Before Tax (FRS 3) |
|
|
5.3 |
1.0 |
9.9 |
10.9 |
16.7 |
|||||||||
Tax |
0.1 |
1.1 |
(1.4) |
(1.9) |
(2.7) |
|||||||||||
Profit After Tax (norm) |
11.2 |
12.8 |
13.1 |
13.5 |
14.3 |
|||||||||||
Profit After Tax (FRS 3) |
5.4 |
2.1 |
8.5 |
9.0 |
14.0 |
|||||||||||
Average Number of Shares Outstanding (m) |
40.6 |
40.4 |
40.7 |
40.7 |
40.7 |
|||||||||||
EPS - fully diluted (p) |
|
|
26.7 |
31.0 |
29.7 |
30.9 |
32.9 |
|||||||||
EPS - normalised (p) |
|
|
27.2 |
31.5 |
30.0 |
31.2 |
33.2 |
|||||||||
EPS - (IFRS) (p) |
|
|
12.7 |
9.1 |
18.6 |
20.3 |
32.6 |
|||||||||
Dividend per share (p) |
6.0 |
7.1 |
8.2 |
9.2 |
10.1 |
|||||||||||
Gross Margin (%) |
29.8 |
34.6 |
35.2 |
35.2 |
35.2 |
|||||||||||
EBITDA Margin (%) |
11.5 |
13.9 |
15.0 |
14.6 |
14.7 |
|||||||||||
Operating Margin (before GW and except.) (%) |
10.6 |
12.9 |
14.0 |
13.6 |
13.7 |
|||||||||||
BALANCE SHEET |
||||||||||||||||
Fixed Assets |
|
|
59.7 |
60.6 |
54.9 |
49.9 |
49.2 |
|||||||||
Intangible Assets |
49.5 |
50.6 |
45.3 |
40.7 |
40.4 |
|||||||||||
Tangible Assets |
10.2 |
9.9 |
9.6 |
9.2 |
8.8 |
|||||||||||
Investments |
0.0 |
0.0 |
0.0 |
0.0 |
0.0 |
|||||||||||
Current Assets |
|
|
54.0 |
56.3 |
60.7 |
80.1 |
89.9 |
|||||||||
Stocks |
2.0 |
5.3 |
6.4 |
8.9 |
8.4 |
|||||||||||
Debtors |
27.3 |
37.8 |
32.9 |
40.9 |
41.2 |
|||||||||||
Cash |
23.1 |
12.0 |
20.5 |
29.5 |
39.5 |
|||||||||||
Other |
1.6 |
1.2 |
0.8 |
0.8 |
0.9 |
|||||||||||
Current Liabilities |
|
|
(40.1) |
(39.7) |
(38.1) |
(29.3) |
(31.1) |
|||||||||
Creditors |
(36.8) |
(36.1) |
(28.9) |
(29.3) |
(31.1) |
|||||||||||
Short term borrowings |
(3.3) |
(3.5) |
(9.2) |
0.0 |
0.0 |
|||||||||||
Long Term Liabilities |
|
|
(2.7) |
(3.2) |
(1.9) |
(19.2) |
(16.6) |
|||||||||
Long term borrowings |
(0.0) |
(0.0) |
0.0 |
(17.4) |
(14.8) |
|||||||||||
Other long term liabilities |
(2.7) |
(3.2) |
(1.9) |
(1.9) |
(1.9) |
|||||||||||
Net Assets |
|
|
70.8 |
74.0 |
75.6 |
81.4 |
91.3 |
|||||||||
CASH FLOW |
||||||||||||||||
Operating Cash Flow |
|
|
8.5 |
2.4 |
15.7 |
7.7 |
20.1 |
|||||||||
Net Interest |
0.1 |
0.0 |
(0.1) |
(0.1) |
(0.1) |
|||||||||||
Tax |
(1.8) |
(1.7) |
(2.4) |
(2.6) |
(2.7) |
|||||||||||
Capex |
(1.0) |
(0.9) |
(0.7) |
(0.8) |
(0.8) |
|||||||||||
Acquisitions/disposals |
(0.7) |
(9.1) |
0.0 |
0.0 |
0.0 |
|||||||||||
Financing |
(3.2) |
0.5 |
(6.8) |
0.0 |
0.0 |
|||||||||||
Dividends |
(2.2) |
(2.5) |
(3.0) |
(3.5) |
(3.9) |
|||||||||||
Net Cash Flow |
(0.3) |
(11.4) |
2.6 |
0.8 |
12.6 |
|||||||||||
Opening net debt/(cash) |
|
|
(19.7) |
(19.8) |
(8.5) |
(11.3) |
(12.1) |
|||||||||
HP finance leases initiated |
0.0 |
0.0 |
0.0 |
0.0 |
1.0 |
|||||||||||
Other |
0.5 |
0.0 |
0.2 |
(0.0) |
0.0 |
|||||||||||
Closing net debt/(cash) |
|
|
(19.8) |
(8.5) |
(11.3) |
(12.1) |
(25.7) |
|||||||||
Source: Company reports, Edison Investment Research estimates. Note: *FY16, FY17, FY18 EPS include one-off tax credits
|
|
Genkyotex has initiated a Phase II investigator-sponsored trial in patients with Type 1 diabetes (T1D) and kidney disease (DKD). Separately, it has announced the positive outcome of a safety review of its Phase II trial with GKT831 in patients with primary biliary cholangitis (PBC) with no adverse events or patient dropouts. Interim data have been pushed back slightly to autumn 2018 from mid-2018 and full data to H119 from end-2018 due to a slow rate of activation of a number of research centres. Additionally, the original deal with the Serum Institute of India Ltd (SIIL) has been expanded and Genkyotex is now eligible to an additional €100m in milestone payments plus royalties on sales. We include the DKD indication and the new terms with SIIL in our valuation, which is now €338.7m or €4.35/share.